Bitcoin Eyes $200K: Why a Correction Could Come FirstAs Bitcoin continues its remarkable run, optimism is high that we could see BTC break the $200,000 mark this year. The momentum is there, with bullish sentiment across the crypto and traditional finance spaces. Yet, it’s important to acknowledge a potential short-term correction ahead before new highs are reached.
Why a Correction May Happen Soon
Several factors point to a volatile period in the weeks ahead:
Upcoming Tariffs: On August 1st, the new round of tariffs announced by President Trump is set to take effect. Trade disputes historically introduce uncertainty into global markets and can sap risk appetite, even in alternative assets like crypto.
Federal Reserve Policy: The Federal Reserve has not yet begun lowering interest rates. High rates continue to pressure both equity and crypto markets by making cash relatively more attractive and increasing the cost of leverage.
Geopolitical Tensions: Ongoing instability in the Middle East adds another layer of unpredictability. Geopolitical flare-ups often lead to market volatility as investors act defensively.
The Takeaway
While Bitcoin is on track to reach unprecedented levels this year, investors should remain mindful of the broader market context. Short-term corrections are part of any healthy bull run and can be driven by macroeconomic and geopolitical events. Staying informed and maintaining a disciplined approach will be crucial for navigating what promises to be an exciting—and eventful—rest of the year.
Not Investment Advice!
#crypto #bitcoin #short #correction #dump #uncertainty #volatility #war #news #bearish
BTCDOWNUSDT trade ideas

#BTC Update #7 – July 15, 2025#BTC Update #7 – July 15, 2025
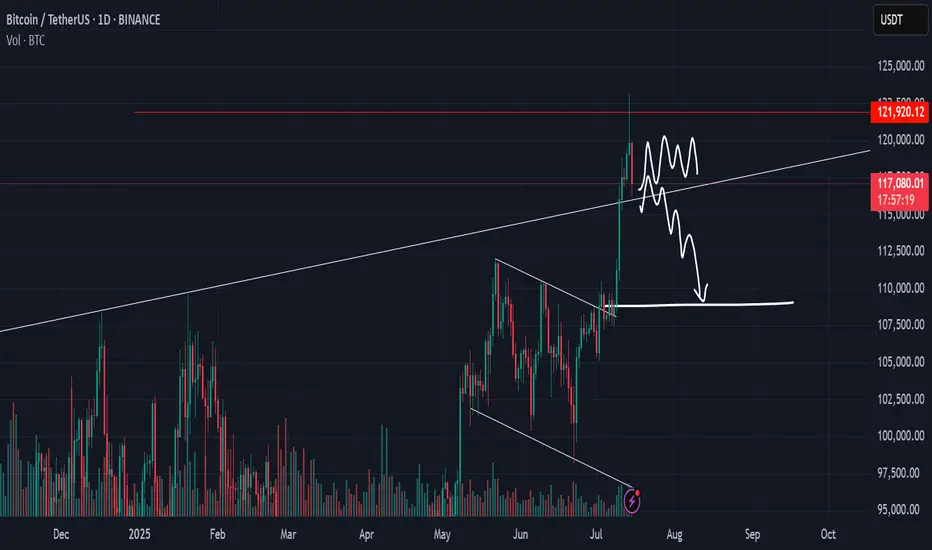
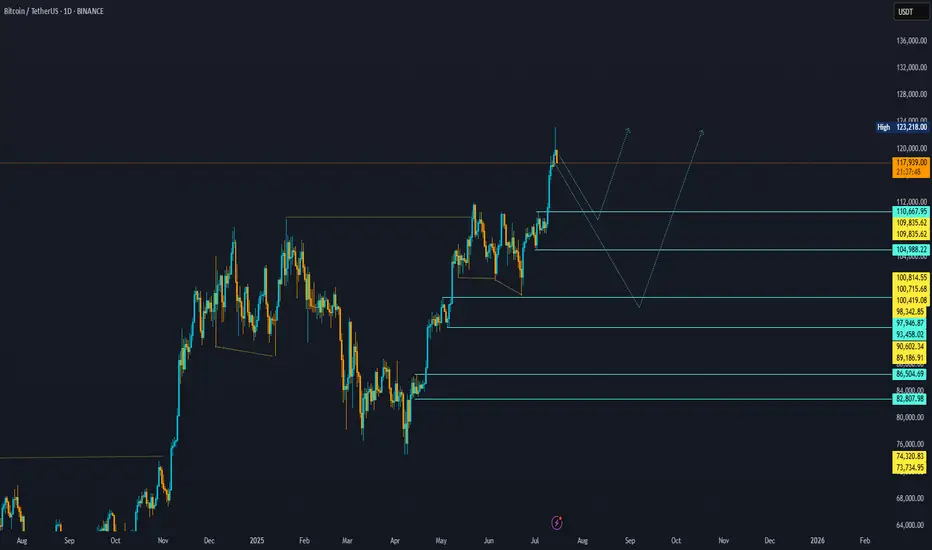
Bitcoin is currently within the consolidation zone where it previously paused during its last upward move. From this zone, it had previously bounced and created a new all-time high. It is now undergoing a correction, and the level it has reached aligns with the 0.382 Fibonacci retracement, which is perfectly normal for a first stop in a correction.
If the correction continues, the second stop could be around $114,795, and the third around $113,012. If it reaches these levels, it will have filled at least half of the imbalance created during the previous rally.
Looking at the volume, I anticipate that Bitcoin might start to bounce from this level. If it manages to break above the $122,666 zone, the next target would be around $127,172.
I do not plan to buy Bitcoin here unless I see a high-volume green candle. However, if Bitcoin breaks above the $118,900 level with strong volume, a long position might be considered, as the target would likely shift toward the $127,000 range.

BTCUSDT.P liquidity analysis🟠 CRYPTOCAP:BTC
📄 This analysis is for liquidity and comparing supply and demand ratios
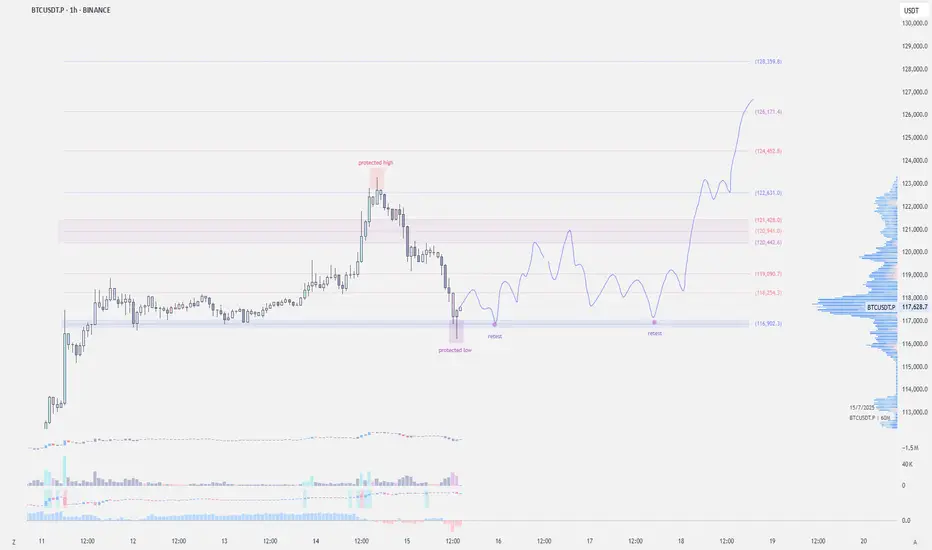
🚨 We start by noting that actual selling pressure began at 121826 and this ratio increased as it dropped below 119723
📄 Any daily close below 117612 will increase this pressure, which is logical after such a rise, specifically in Bitcoin
⭕️ The two closest important levels with liquidity and buying strength are at 114813 and 110623
◀️ The current rebound from 116114 (the lowest point Bitcoin has reached currently at the time of writing this analysis) is insufficient in terms of liquidity and needs more momentum, and attention here should be on the level 117612
📄 The current movement is between 117612 - 114813, the range where Bitcoin stabilized before achieving the historical peak, and thus maintaining this range will provide a boost for a larger rise

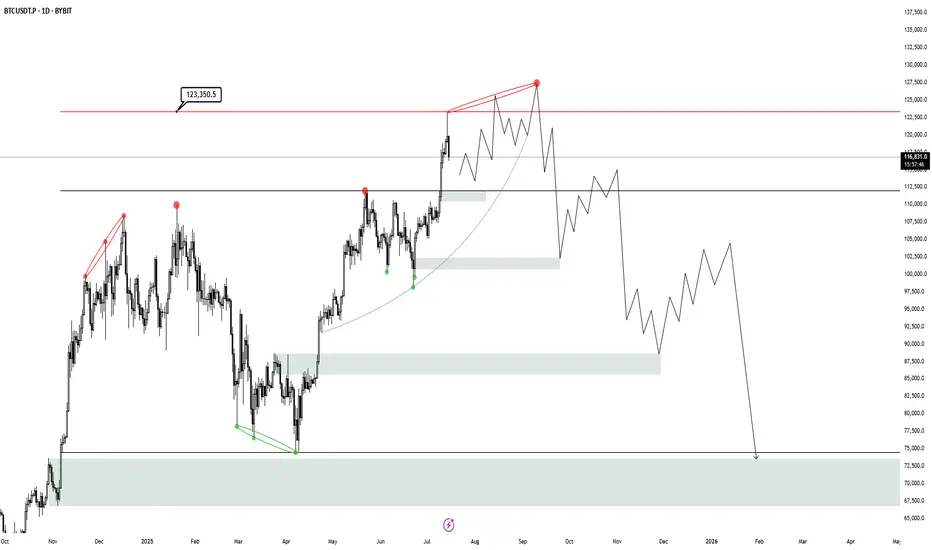
BTC HTF Distribution V3This is my new outlook for BTC if this 250 day old range is intended to be a HTF Distribution Model 1, which has neither been confirmed nor invalidated. A weekly close above 123.350$ will invalidate this model and likely lead to higher prices. Yesterday we had a perfect rejection from the deviation limit, which now probably creates a new range, that then will either reaccumulate or distribute.
It stopped (resisted) where the AI said it would! Very Exciting!Witness the precision: Price hit resistance exactly as predicted by AI analysis. Thrilling confirmation of my AI tech-driven trading insights!


Bitcoin, its time to short full leverage ?this idea still great
now bitcoin ranging or auto dump ?
short full leverage when retesting on resisten is great
$BTC - LTF OutlookCRYPTOCAP:BTC | 1h
We're establishing a new value area here
Looking at a potential ltf setup:
If 116.5k holds as base support, targeting a move toward 120.5k–121.4k (immediate supply zone)
Similar to past price action, we might see a few pushes before breaking through ltf supply.
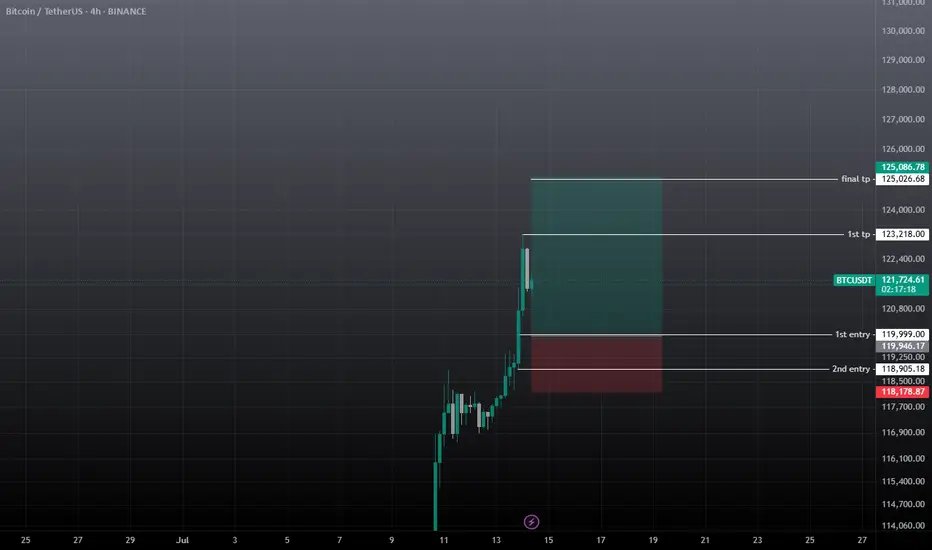
BTC/USDT Long Position Plan🔥 BTC/USDT LONG IDEA (4H CHART)
Published by: Ali15349323
Timeframe: 4H
Exchange: Bybit Spot
Date: July 15, 2025
📊 Analysis Summary:
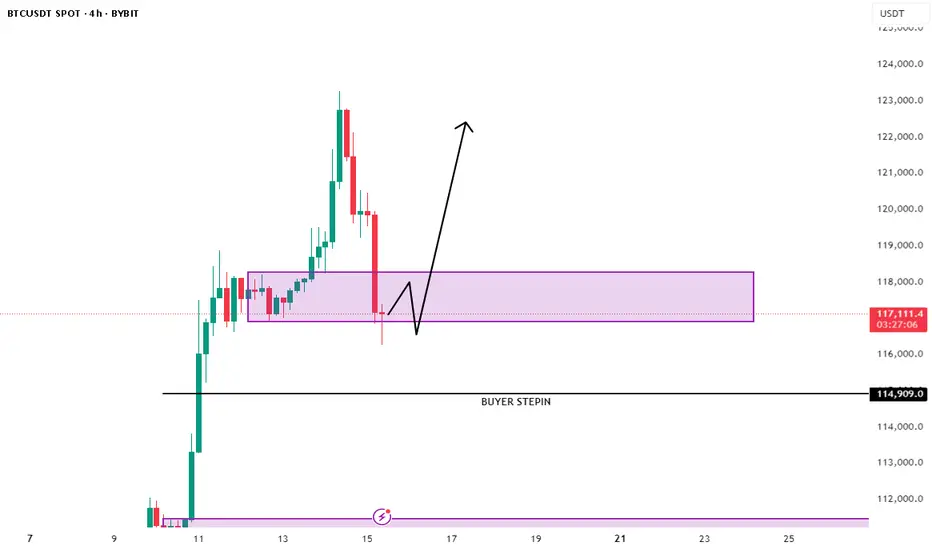
Bitcoin is pulling back after a strong impulsive move upward. Price has now entered a key 4H demand zone between 116,200 – 117,300, which previously acted as a consolidation base before the breakout.
We are now watching for a potential long entry in this zone, with a bounce confirmation and invalidation criteria clearly defined.
📌 Trade Plan (Long Setup)
Entry Zone:
🔹 116,200 – 117,300 USDT
🔹 Price is currently reacting within this support range
Stop Loss (Invalidation):
🔹 Below 114,900 USDT
🔹 A 4H candle close below this level would break structure and invalidate the setup
Take Profit Targets:
🔹 TP1: 121,000 – Local resistance
🔹 TP2: 123,000 – 124,000 – Imbalance fill zone
🔹 TP3 (Optional): 125,500+ – If momentum continues
🧠 Reasoning Behind the Trade:
✅ Strong demand zone with historical reaction
✅ Wick rejection from the lower boundary, showing early buyer interest
✅ Price structure still bullish unless 114.9k breaks
✅ Previous sell-off likely triggered liquidation — now a chance for recovery bounce
⚠️ Invalidation Criteria:
❌ A 4H candle close below 114,900 signals demand has failed
❌ In this case, the setup is no longer valid — next demand sits around 111k – 112k
🧾 Summary:
We’re looking for a bullish continuation if BTC holds above the current demand zone. A sweep-and-reclaim structure could give confirmation. If the zone fails, no trade — we step aside and wait for deeper support.
📣 Don’t forget to:
🔁 Like & Share
🧠 Follow me @Ali15349323 on X for more trades
#BTC #Bitcoin #Crypto #LongSetup #TechnicalAnalysis #TradingView
BTC next bull run after taking restAs is clear, BTC has made a new high, and we should wait for the next bullish entry after a retracement.
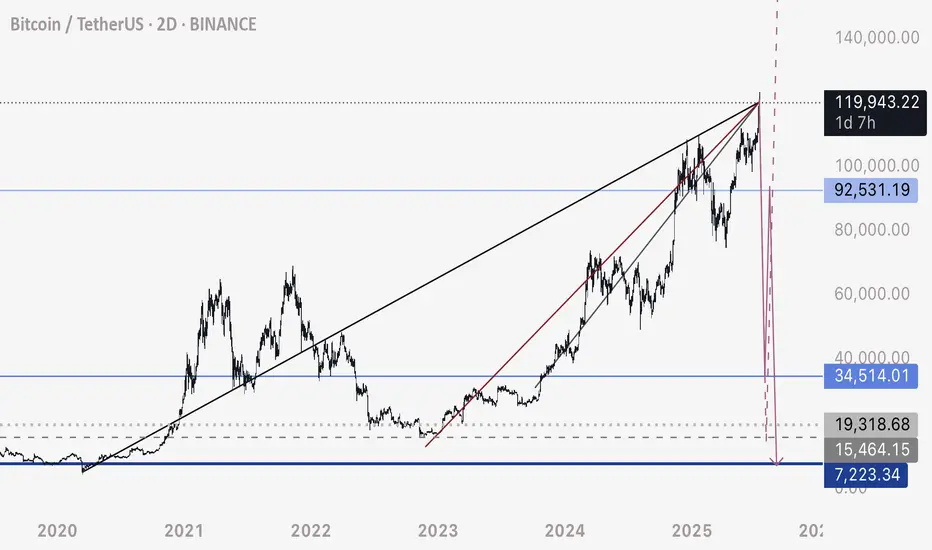
Cycle Top Theory: BTC 2025–2028 : The ₿ Line BreakoutCycle Top Theory: BTC 2025–2028" explores the probabilistic path of Bitcoin through the remainder of the current bull cycle. Combining historical market structure, halving-driven supply shocks, and volatility-based modeling, this thesis outlines potential top scenarios ranging from $xxxK to $xxxK.

BTC — Long from Support Box (#4h) | BULLISH1. Buy: Limit order 115.5k–116.6k
2. Alert: If close < 113k, scenario invalid
3. Target: 125k

BTC - Last Attempt at Predicting TopThis is my last attempt at predicting the top of this upwards move on the HTF.
Adjusting these trendlines to where BTC pumped to, which was a lot higher than initially anticipated, it does look to me that these trendlines are still respected.
There are 3 bearish ascending lines that price has been interacting with - I assume we are looking at a crossing intersection of them, per the chart here.
If BTC continues higher without a very fast, drastic free fall - I will be looking at other possibilities. If price moves above 122,000 again, I would consider this invalid - as I suspect the resistance level sits around 120,000 to 120,500 area.
I will be looking for a very fast drop to consider this possibility as valid and likely from here on.
BTC-----Buy around 121100, target 121800 areaTechnical analysis of BTC contract on July 14:
Today, the large-cycle daily level closed with a small positive line yesterday, the K-line pattern continued to rise, the price was above the moving average, and the attached indicator was running in a golden cross. The overall trend is still very obvious, and it can be seen from the overall trend that the retracement is very small. After the shock correction in the two trading days over the weekend, it rose strongly again during the day and broke through the previous high position, so we keep the main idea of buying on retracement in trading; the short-cycle hourly chart intraday price broke upward, the starting point was 118880 area, the current price is consolidating at a high level, the K-line pattern continued to rise, and the attached indicator was running in a golden cross. If we look at the continuation of the high closing today, two conditions must be met: the European market price broke through the intraday high; the retracement cannot break the starting point, otherwise it will be difficult to fall.
Today's BTC short-term contract trading strategy:
Trade in the 121100 area when retracement, stop loss in the 120500 area, and the target is the 121800 area;

How many bag holders will BTC leave behind?We've had our fun and some fake pumping from the short squeeze. No comes the real stuff! What are the fundamentals and what problem is BTC trying to solve? Ok, crickets. It's a speculative asset, that's it. If history repeats itself, which it typically does, we will see a major pull back and anyone who's bought at the top will have a negative performing portfolio. It's too expensive and you still can't buy a banana with BTC and there are plenty of middlemen involved, which goes 100% against it's original purpose (after the financial crisis).
If you're up, this would be a good time to sell IMHO and buy at the next support level, which is way below 100k.

Bitcoin Go 130k Now you just have to take a long position and the whole market will be pumped.
Bitcoin 130k __134k

BTC BUY / LONG SCALP TRADEWait for the entry to be filled, must use SL and don't use high margin on any trade. If TPs achieved first then ignore the trade.

btcusdt buy / long scalp setupWait for the entry and must use sl on all trades, if tp achieves first then ignore it.
Long Target UpdateSince there was more info in the price action, I updated my last view of it. I expect a 5th wave extension and a deep pullback. Be careful if we reach +130k and hold the sl tight and observe if any structure for changing trend is forming.

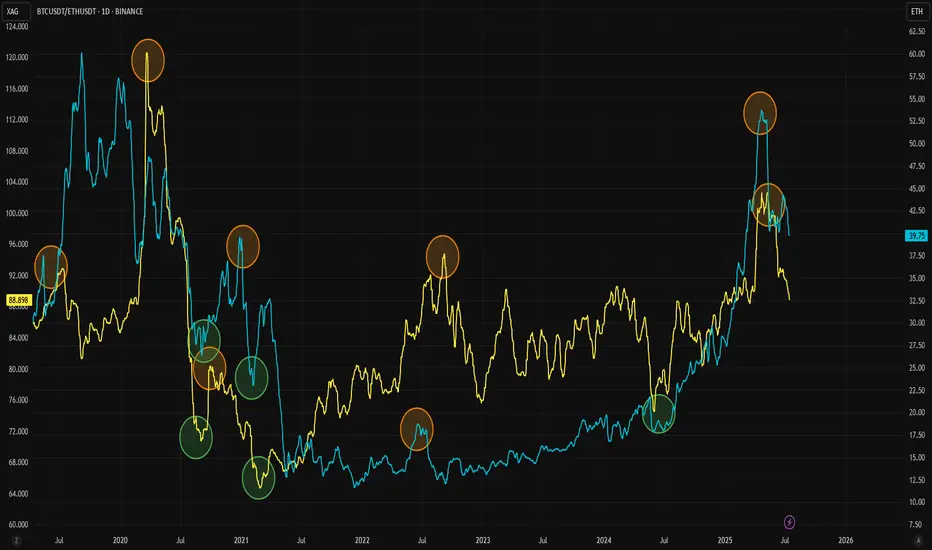
Want to Know What Happens in Crypto? Check Silver InsteadThe Gold/Silver ratio is one of the key indicators that highlights major turning points in modern economic history. Similarly, the ETH/BTC ratio is widely followed as a gauge of strength in the crypto market and the beginning of altcoin seasons. Interestingly, these two ratios also appear to correlate well with each other.
As adoption of both Ethereum and Bitcoin has grown, the Gold/Silver and BTC/ETH ratios have started to move more closely together. They often follow similar patterns, with tops and bottoms forming one after the other. For clarity, this analysis uses the BTC/ETH ratio rather than ETH/BTC.
Historically, BTC/ETH tends to lead during market tops, followed by a similar move in the Gold/Silver ratio. This pattern has been observed repeatedly since 2020. When it comes to bottoms, the timing between the two ratios is usually tighter, as seen during the 2020, 2021, and 2024 lows.
The latest signal came from a top in the BTC/ETH ratio, and the Gold/Silver ratio now appears to be following that move. Given the cyclical nature of crypto markets, both ETH and silver could be at the early stages of new upward trends. For a potential trend reversal, it may be wise to keep a closer eye on silver in the coming weeks.
BTC/USDT bullish with reverse head and shoulderBTC/USDT completed the reverse head and shoulder pattern.
It could be bullish by the pattern.

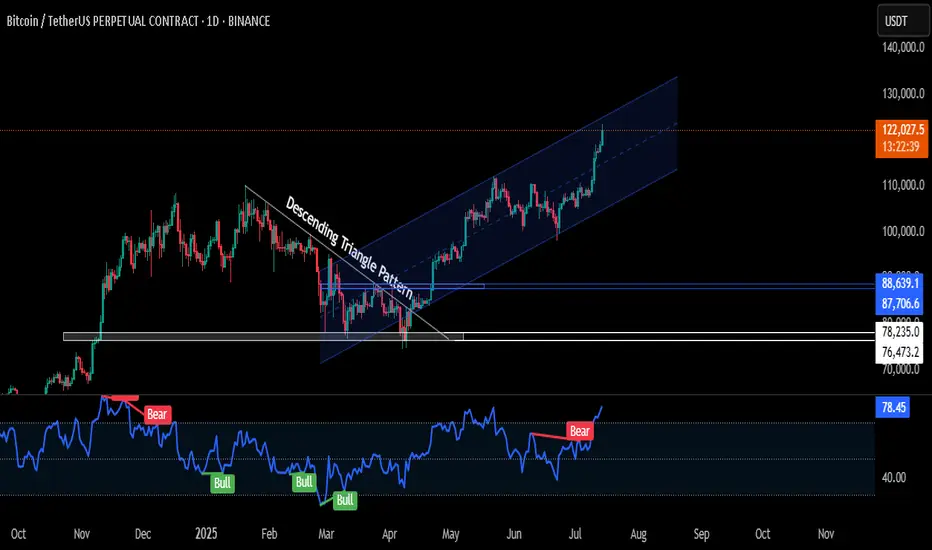
BTC Hits Channel Ceiling – Smart Money Taking ProfitsBINANCE:BTCUSDT.P
🚨 BTC has cleanly broken above $120K, tagging $123,300 today (ATH) — pushing the top boundary of a well-respected rising channel that’s been in play since April.
🔍 Analysis:
Structure & Trend:
Price broke out of a Descending Triangle back in March — that move initiated a trend, not just a spike. Since then, BTC has followed an ascending channel, showing institutional-style demand: controlled, aggressive, and layered.
Current Price Action:
We’re at the upper edge of the rising channel, where many traders either:
- Exit early out of fear of reversal,
or
- Chase breakout longs, often just before a shakeout.
Smart trading now = discipline, not FOMO
If BTC fails to hold above $120K, expect a cool-off to the channel midline around ($111K–$112K) or even lower.
🧠 What to Do as a Trader:
Already in from Lower?
This is your TP zone or trailing stop region. Don't get greedy.
Protect capital. Re-enter on retest or new setup.
Looking to Enter Now?
Not ideal. Let the chart either break and retest cleanly OR
pull back to mid-channel ($112K area) for a high-R:R setup.
📌 Summary
BTC is bullish — no denial. But this is the zone where pros reduce risk and wait for confirmation, while most retail enters blindly.
Don’t be the liquidity.
✅ Follow for more real-time updates
🔁 Share it with your fellow traders
🚀 And hit that Boost button to support the work!
Let’s trade smart, not emotionally. 💯
#CMPInsights
BITCOIN BREAKS YEARS LONG ASCENDING TRENDLINE RESISTANCEThe recent surge in the price of Bitcoin has led to the break of years long ascending trendline resistance as can be seen on Weekly BTC chart.
The price of BTC can soar higher above this resistance level and can take support from this level to mark a successful breakout.
Breakouts like this does create FOMO among traders but trading such breakouts must be done with caution as the price can still fall under the resistance level.
Best of Luck!!
