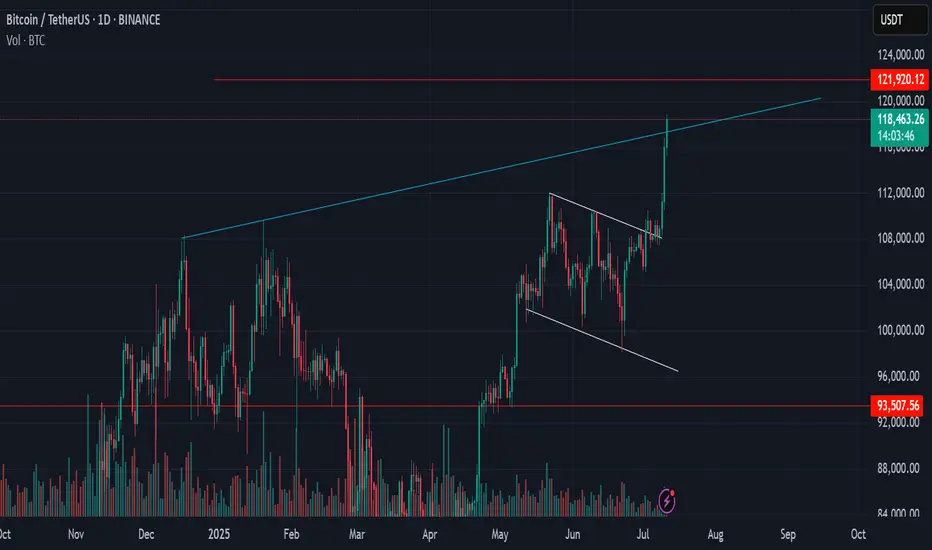
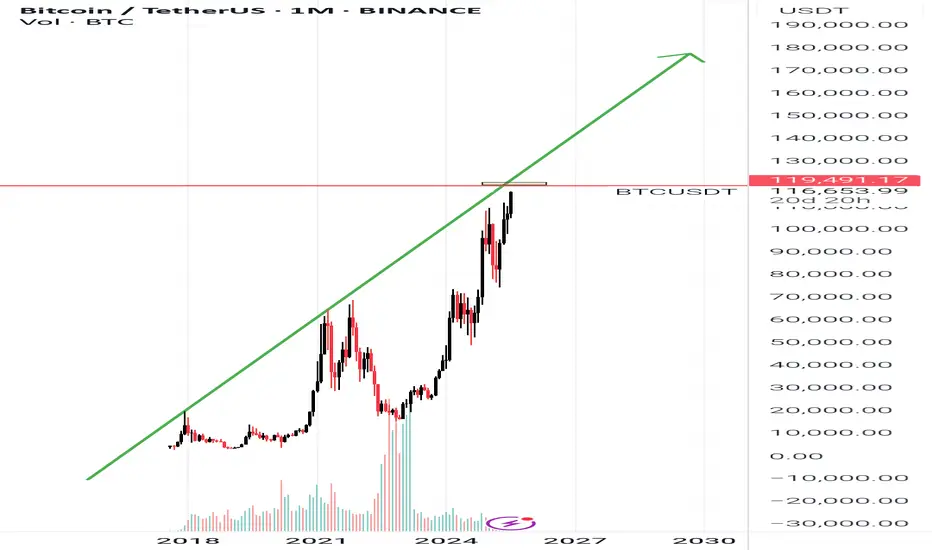
Bitcoin Critical AreaSo we see after flag breakout and auto pump to 118k, but we must pay attention in mega trendline from December 2024 and decision is in this week
if we close above 119k maybe we will see 121k
but maybe whale can doing wick fakeout (?)
BTCDOWNUSDT trade ideas
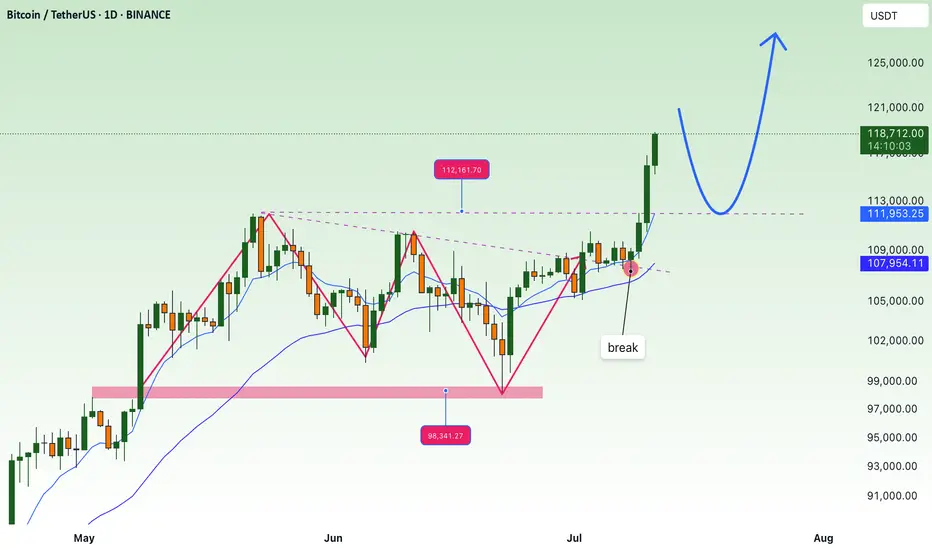
(BTC/USDT) appears to be around $120,000.(BTC/USDT) appears to be around $120,000.
Here's a quick analysis of what the chart suggests:
Timeframe: 1D (Daily)
Current price: ~$111,150
Technical Indicators:
Ascending triangle breakout is indicated.
Ichimoku Cloud shows bullish momentum (price above the cloud).
The breakout is targeting a horizontal resistance zone around $120,000.
✅ Target Zone:
Target Point (based on breakout projection): $120,000 – $124,000
This target aligns with previous resistance levels and technical breakout patterns.
Let me know if you want a more detailed technical breakdown (e.g., support/resistance zones, volume analysis, RSI, etc.).

FOMO price increase, create new ATH💎 Update Plan BTC weekend (July 11)
Continuously creating a new ATH, preparing to have a short sale?
The reinforcement of Bitcoin price around the upper boundary of the previous consolidation area was broken at $ 108,355, which ended on Wednesday. The price has soared to the highest level of the new time of $ 116,868 on Thursday. At the time of writing on Friday, the price is fluctuating above $ 116,600.
When BTC entered the price exploration regime and if the trend of increasing continues, the price can expand the momentum to an important psychological level of $ 120,000.
Technical analysis angle
Our community has continuously chose the trend of increasing as the mainstream for all previous transactions and currently preparing to welcome 120k as forecast.
The relative power index (RSI) on the daily chart reaches 71, higher than the excess buying 70, showing a sharp increase. However, traders should be cautious because the ability to adjust the decrease is very high due to over -purchase. Meanwhile, the average divergence dynamic indicator (MACD) has shown a price intersection at the end of June. The indicator also shows that green histograms are increasing on neutral zero, showing that the rising momentum is being strengthened and continues to increase.
However, if BTC must be adjusted, the price may extend the decline to search and support around the upper boundary of the unified area that has been broken earlier at $ 108,355.
Plan has been constantly accurate in the past 2 months, which is the positive signal of the channel that brings value to the community.
Please follow the channel to receive accurate scenarios about gold and BTC
==> Comments for trend reference. Wishing investors successfully trading
Skeptic | Bitcoin Deep Dive: Rate Hikes, War Tensions & TriggersInterest Rates: The Big Picture
Let’s start with the Federal Reserve’s move—interest rates jumped from 4.25% to 4.5% . What’s the deal? Higher rates mean costlier borrowing , so businesses and folks pull back on loans. This drains liquidity from risk assets like Bitcoin and SPX 500, slowing their uptrend momentum or pushing them into ranges or dips. Now, mix in the Israel-Iran conflict escalating ? Straight talk: risks are sky-high , so don’t bank on wild rallies anytime soon. My take? BTC’s likely to range between 97,000 and 111,000 for a few months until geopolitical risks cool (like Russia-Ukraine became “normal” for markets) and the Fed starts cutting rates. Those two could ignite new highs and a robust uptrend. Let’s hit the charts for the technicals! 📊
Technical Analysis
Daily Timeframe: Setting the Stage
You might ask, “If 100,000 support breaks, does that mean we’ve formed a lower high and lower low, flipping the trend bearish per Dow Theory?” Absolutely not! Here’s why: our primary uptrend lives on the weekly timeframe, not daily. The daily is just a secondary trend. If 100K cracks, it only turns the secondary trend bearish, leading to a deeper correction, but the major weekly uptrend stays intact.
Spot Strategy: No spot buys for now. Economic and geopolitical risks are too intense. I’ll jump in once things stabilize. 😎
Key Insight: A 100K break isn’t a death sentence for the bull run—it’s just a shakeout. Stay calm!
4-Hour Timeframe: Long & Short Triggers
Zooming into the 4-hour chart, here’s where we hunt for long and short triggers:
Long Trigger: Break above 110,513.92. We need a strong reaction at this level—price could hit it early or late, so stay patient for confirmation.
Short Trigger: Break below 101,421.65. Same vibe—watch for a clean reaction to tweak the trigger for optimal entry.
Pro Tip: These levels are based on past key zones, but time outweighs price. Wait for a reaction to nail the best entry. Patience is your edge! 🙌
Bitcoin Dominance (BTC.D): Altcoin Watch
As BTC dips, BTC.D (Bitcoin’s market share) is climbing, meaning altcoins are taking a bigger beating. Don’t touch altcoin buys until the BTC.D upward trendline breaks. They haven’t moved yet—you might miss the first 10-100%, but with confirmation, we’ll catch the 1,000-5,000% waves together. 😏
Shorting? If you’re shorting, altcoins are juicier than BTC—sharper, cleaner drops with more confidence. Patience, patience, patience—it’s the name of the game.
Final Thoughts
My quieter updates lately? Blame the geopolitical chaos, not me slacking . I’m hustling to keep you in the loop with clear, actionable insights. here, we live by No FOMO, no hype, just reason. Protect your capital—max 1% risk per trade, no exceptions. Want a risk management guide to level up? Drop a comment! If this analysis lit a spark, hit that boost—it keeps me going! 😊 Got a pair or setup you want next? Let me know in the comments. Stay sharp, fam! ✌️

Bitcoin : Missed $100K? Don’t Miss What’s Coming Next!!MARKETSCOM:BITCOIN BINANCE:BTCUSDT continues to show exceptional strength and strong bullish momentum. When we look back at the charts from 2023 and 2024, a clear and reliable pattern stands out. Each time Bitcoin touched the 50 EMA on the weekly chart, it triggered a significant rally that led to new all-time highs. That same setup appears to be forming once again.
MARKETSCOM:BITCOIN tested the 50-week EMA around the $75,000 level and has since bounced with conviction. The price has reclaimed the $100,000 mark and is now challenging previous all-time high resistance. Historically, a successful bounce from this key moving average has not only signaled recovery but also sparked explosive upside moves.
Following this repeating pattern, the current cycle target is positioned at $150,000. A clean breakout above the current resistance zone could act as the trigger that launches Bitcoin into uncharted territory. The technical structure remains bullish, momentum is clearly accelerating, and the overall trend continues to favor the upside.
This moment represents a textbook Buy and HODL opportunity. Technical indicators are aligning, market sentiment is turning increasingly optimistic, and all signs suggest that Bitcoin could be preparing for another historic rally. Stay ready for what could be the next big move.
Follow Our Tradingview Account for More Technical Analysis Updates, | Like, Share and Comment Your thoughts

DeGRAM | BTCUSD got out from the triangle📊 Technical Analysis
● Price reclaimed the purple 2-month trend cap and has “fixed” above the 107 k former supply, turning it into support; this validates the grey ascending triangle whose base lies on the channel mid-line.
● Triangle height and prior swing grid point to 112 k first, then the 114.9 k May high just beneath the channel ceiling. Invalid if candles sink back below 107 k.
💡 Fundamental Analysis
● Spot-ETF desks added >9 800 BTC since Friday while on-chain miner reserves stabilised, suggesting dwindling sell pressure just as U.S. CPI relief is lifting real-yield headwinds.
✨ Summary
Long 107–108 k; breakout >112 k opens 114.9 k. Bull view void on 4 h close <107 k.
-------------------
Share your opinion in the comments and support the idea with a like. Thanks for your support!

king BTC !As we were waiting for Bitcoin to move up, we published its signal on our channel
, and it was a beautiful analysis,
now we are waiting for the price of $ 120 thousand, the price may move down from here, we will buy again at prices of 114350 or 111, with the target of 126 thousand, good luck,
to profit with us, send a private message, everything is free

BTCUSDTBitcoin may be looking to complete the downward correction from the $101,000 price range to $99,000 and then begin a long-term upward trend. Pay close attention to the extent of the correction and don't give in to fear or greed.
In any case, it should go to $1300,000.
BINANCE:BTCUSDT

Can Bitcoin see $120,000?
Hi My Dears
If the Bitcoin price closes above $106,602, we can be optimistic about the specified targets.
I think Bitcoin has the potential to reach $120,000. We just have to wait.

Bitcoin breaks through a new high, aiming at 120,000!Bitcoin breaks through a new high, aiming at 120,000! ——Trend analysis and operation strategy
Bitcoin (BTC) finally broke through the shock range and broke through the 120,000 US dollar mark, setting a new record! The current market sentiment is high, and both technical and capital aspects show that bulls have an absolute advantage.
Key data observation:
Price structure: After breaking through the previous high, 120,000 US dollars became a new psychological barrier. If it can stand firm, the upper space will be further opened.
Support confirmation: The 114,000-115,000 range forms a short-term strong support. If the callback is not broken, the trend will continue.
Fund flow: Institutional positions are stable, derivatives have not shown excessive leverage, and the healthy rising structure is still there.
My opinion: The bull market has no top, but we need to be wary of short-term profit-taking. The trend has not changed, and low-absorption is still the main strategy.
【Operation strategy: Pullback is an opportunity】
1. Short-term layout:
Entry range: 114000-115000 (trend support + Fibonacci retracement level)
Target: 120000 (expected to accelerate after breakthrough)
Risk control: If it falls below 113000, the market structure needs to be re-evaluated
2. Trend holders:
Stay stable at 114000 and continue to hold. Observe the breakthrough strength above 120,000. If the volume increases, the target can be higher (such as 125000-130000).
【Risk warning】
Short-term volatility intensifies: A rapid pullback may occur after a new high, so avoid blindly chasing highs.
Macro variables: Fed policies and geopolitical situations may still trigger a spike.
My conclusion: Pullbacks in a bull market are all better opportunities to get on board. Keep a low-multiple mindset, but strictly control risks.
BTC - Can it reach 100k?FOR SUREEEEE it can! Just let it close above 120k for it to form in a formed manner or way

Bitcoin & new rallyBitcoin surpassed its previous all-time high of $112,000 and is now approaching $124,700, the third resistance level for July's pivot.

BTCUSDT – Bullish Momentum MaintainedBitcoin is maintaining a solid bullish structure after breaking out of its recent accumulation zone and filling the FVG gap around $110,400. On the H4 chart, BTCUSDT has just completed a successful retest near the dynamic support zone and is now aiming for the potential resistance at $112,949 – where it intersects with a long-term trendline. A breakout above this level could signal the start of a new expansion phase.
Major news from yesterday regarding new capital inflows into several approved spot Bitcoin ETFs, combined with rising expectations of a Fed rate cut later in Q3, are fueling strong buying momentum. This rally could gain even more strength if crypto markets continue to attract liquidity.

BTC Roadmap Still Intact Bullish Momentum Building Toward 120KBitcoin Price action continues to validate the bullish roadmap shared in our last BTC post. The market respected the Immediate Buy Back Zone, springing from a demand backed structure into a fresh impulsive leg.
Notably, price has carved a clean 5-wave structure supported by recurring bullish pennants and continuation patterns each breakout driving momentum higher. Our target at 120,151 remains firmly intact, with price action showing healthy structure and controlled pullbacks.
The current setup remains valid as long as price holds above 106,655 and especially 100,941, which now act as structural pivot zones. Any deeper correction into the Demand Area would only serve as a re-accumulation window before the next leg.
Let’s see how price behaves into June. Momentum is aligning with structure.
Share your thoughts, like the post, and drop your setup confirmations on the comment section.

CoinMarketCap chart and correlation with BTC
Hello, traders.
If you "Follow", you can always get new information quickly.
Have a nice day today.
-------------------------------------
(USDT.D 1D chart)
USDT dominance is showing a downward trend along the medium- to long-term downtrend line.
The decline in USDT dominance can be interpreted as an upward trend in the coin market.
Therefore, if it remains below 4.91 or continues to decline, the coin market is likely to enter a bull market.
The coin market is expected to show a major bull market until 2025.
At this time, the USDT dominance is expected to fall to around 3.42 and then rise, causing the coin market to enter a bear market.
Therefore, a major bear market is expected in 2026.
-----------------------------------------------
(BTCUSDT 1M chart)
You might think that it would be good if it continued to rise in a bull market, but in reality, that is not the case.
The reason is that if the price continues to rise, you have to buy more money.
Therefore, it will show a pattern of falling when appropriate and rising again when appropriate.
As I mentioned earlier, 2025 is a major bull market, so it will eventually show a rising pattern.
So, when should we buy and when should we sell?
It would be nice if we could know this a little bit faster, but we can never know.
Currently, BTC is renewing its ATH, so it is even more difficult to predict the movement.
Therefore, we can only predict it through predictable chart analysis techniques.
Among them, the method I use is to predict and respond to the high point using the HA-Low, HA-High indicators and the DOM (DMI + OBV + MOMENTUM) indicator using the Heikin-Ashi chart.
The DOM indicator indicates the end of the high and low points, and the HA-Low and HA-High indicators are used to establish a basic trading strategy.
The sky blue (#00bcd4) arrow is generated, indicating that the DOM (60) indicator is likely to be generated soon.
In other words, it means that the end of the high point is becoming more likely.
When the DOM(60) indicator is created, there is a high possibility of resistance, so the price is likely to fall.
Therefore, you should think about a countermeasure for the decline.
However, as I mentioned earlier, since 2025 is expected to show a major uptrend, it is recommended to sell in installments at an appropriate level to preserve profits.
The reason is that we cannot know how far it will fall.
The start of a full-scale decline is likely to begin when it falls below the HA-High indicator.
Therefore, if it falls after the DOM(60) indicator is created, we should observe whether a new HA-High indicator is created.
If a new HA-High indicator is created, the key point is whether there is support in the vicinity.
If a new HA-High indicator is not created, it is likely to fall to the current HA-High indicator location of 73499.86.
-
A trend line has been formed between highs, but a trend line between lows has not yet been formed.
Therefore, it is difficult to predict how far it will fall once the decline begins.
In the 2025 bull market, BTC is expected to rise to around the Fibonacci ratio of 2.618 (133889.92).
Therefore, we should also consider countermeasures for this.
------------------------------------------------
(BTC.D 1M chart)
When will the altcoin bull market start?
I think the timing is when BTC dominance falls below 55.01 and is maintained or continues to decline.
I think the rising BTC dominance means that the funds flowing into the coin market are concentrated toward BTC.
Therefore, we should consider that a market for trading BTC has been formed.
If BTC dominance fails to fall below the 55.01-62.47 range, BTC dominance is expected to rise to around 73.63-77.07.
At this time, it is highly likely that it will encounter strong resistance and begin to decline.
Since it has not fallen below the mid- to long-term trend line, it seems likely that it will continue to rise.
In order to eventually turn into a downtrend, BTC dominance must fall below 60.
If not, I think it will be difficult to expect an uptrend in altcoins.
----------------------------------------------------------------------
(BTCUSDT 1D chart)
This period of volatility is expected to continue until July 11.
Therefore, the key issue is whether there is support near 111696.21.
If there is support at the 111696.21 point, it is expected to rise to the right Fibonacci ratio 2.24 (116940.43).
If not, we need to check whether there is support near 108316.90.
As I mentioned in the previous idea, three conditions must be met to break through the 111696.21 point upward.
- The StochRSI indicator is showing an upward trend with K>D,
- The PVT-MACD oscillator is showing an upward trend (if possible, above the 0 point),
- The OBV indicator of the Low Line ~ High Line channel is maintained above the High Line,
If the above conditions are met, I said that there is a high possibility of a stepwise upward trend from the 111696.21 point.
-
The next volatility period is expected to occur around July 18 (July 17-19).
Therefore, we need to see if it can be maintained above 111696.21 until the next volatility period.
If it fails, we need to check if it is supported above the M-Signal indicator on the 1D chart, near 108316.90.
If not, it is likely to fall to the M-Signal indicator on the 1W chart or near 99705.62.
-
The basic trading strategy is to buy near the HA-Low indicator and sell near the HA-High indicator.
However, if the HA-High indicator rises, there is a possibility of a stepwise uptrend, and if the HA-Low indicator falls, there is a possibility of a stepwise downtrend.
The end of the stepwise uptrend is a downtrend, and the end of the stepwise downtrend is an uptrend.
That is, we can see that the support around the HA-High ~ DOM(60) section and the DOM(-60) ~ HA-Low section will be important turning points for the future trend.
----------------------------------------------------
On the USDT dominance chart, it seems likely that August 3rd will be the volatility period.
Looking at the BTC chart, it seems likely that August 2nd to 5th (August 1st to 6th) will be the pre-movement for the volatility period of August 1st to 6th.
-
Thank you for reading to the end.
I hope you have a successful trade.
--------------------------------------------------
- This is an explanation of the big picture.
(3-year bull market, 1-year bear market pattern)
I will explain more details when the bear market starts.
------------------------------------------------------

BTCUSDTBitcoin came and made its move according to the FVG, which was in the $98,000 to $99,000 range, but considering the war that took place between Iran, the United States, and Israel and that affected the markets, I expected it to reach the $91,000 or even $85,000 area and then make a move, but considering the previous analysis and consolidation in the $109,000 area and the breakout of $110,000, it started its move and is expected to go up to $120,000 in the short term and up to $144,000 in the medium term.

BTCUSDTHello Traders! 👋
What are your thoughts on BITCOIN?
Bitcoin has once again failed to break above its previous high and entered a corrective phase. The price is now moving within a channel and is approaching the lower boundary of that channel.
The correction is expected to continue toward the support zone and the bottom of the channel, where we may see buying interest and a bullish reaction.
If Bitcoin breaks above the channel resistance and key supply zone, it could trigger a strong upward move and lead to new all-time highs.
Key Note:
Price action near the channel support and demand zone will be crucial. A successful rebound from this area may signal the start of the next bullish leg.
Will Bitcoin hold the channel and bounce higher, or is a deeper correction ahead? Share your thoughts below! 🤔👇
Don’t forget to like and share your thoughts in the comments! ❤️

Bitcoin Breaks Out — Major Momentum ShiftBTC/USDT has officially broken out of the descending channel it was consolidating in for over a month. The breakout was strong, clearing the horizontal resistance at $111,862, flipping it into support.
Chart Structure:
Descending channel broken to the upside
Horizontal resistance is flipped to support
Volume confirmed breakout momentum
Key Levels:
Support: $111,862 → Newly flipped support
Resistance Zones Ahead:
$116,818
$122,342
Upside Targets:
Immediate: $116,818
Extended: $122,342
Caution: Avoid FOMO. Wait for a retest near $111,800–$112,200 to confirm breakout strength.
Bias: Bullish
Timeframe: 4H
Wait for confirmation before fresh entries.
DYOR | Not financial advice
#BTC #Bitcoin

BTC/USDT TrendHello friends, This chart is very important. Bitcoin will soon touch the long-term trend line, and it might even end the upcoming bullish trend that started around $15,000... The key point is that this end of the bullish trend could mark the beginning of an altcoin season, although an altcoin season may not necessarily occur. Anyway, if Bitcoin cannot break the trend line convincingly and pass through it, we will see its end. So, stay very alert.
BTC Long / Buy SetupBTC is strongly Bullish towards 120k liquidity level, I'm not seeing any healthy correction before hitting the 120k level. If BTC strongly breaks and closes below 106.9k then chances are high that it will touch the weekly level and again come to 107k level, but this time it will struggle to break the 107k level because it will become bearish fvg, if it holds the 107k level and give any strong reaction from the zone then the next level is 120k. even a wick towards 105k or below doesn't matter, any body closing below the 106.9k (at least 4hrs) will lead short term weakness to the trend.

BTC Intraday SetupWait for the liquidation sweep on any side, then take entry, btc moving in sideways for many days, remember that first breakout will be fakeout on any side.

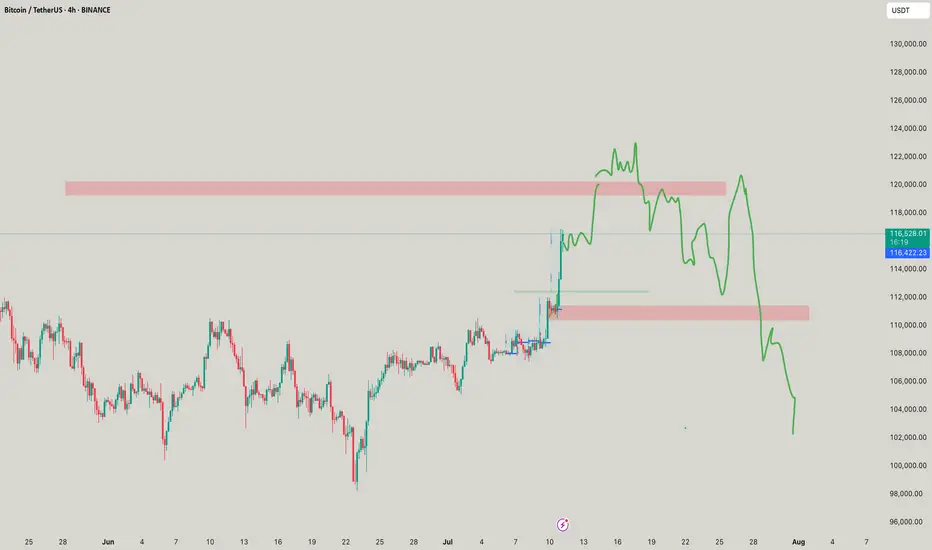
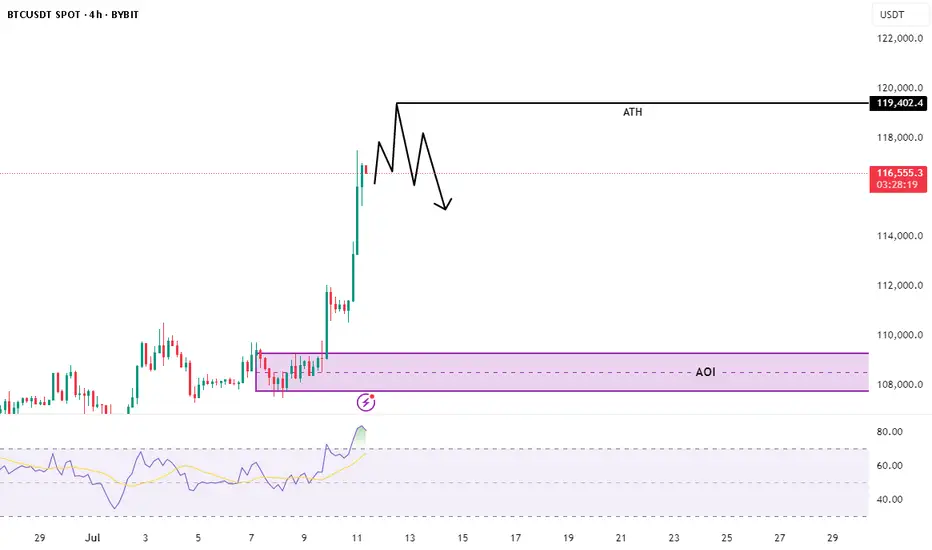
Chart Explanation: BTC/USDT (4H, Bybit)📊 Chart Explanation: BTC/USDT (4H, Bybit)
🟢 Current Situation:
BTC is pushing toward its All-Time High (ATH) level at $119,402.
We've seen a strong vertical rally with minimal pullbacks — classic "euphoria phase" behavior.
Price is currently around $116,500, getting close to major resistance.
⚠️ Key Observation – Bearish Divergence:
The Relative Strength Index (RSI) is showing bearish divergence:
Price is making higher highs
RSI is making lower highs
This signals momentum weakening, despite price moving up — a possible reversal warning.
🚫 Why No Trade (Yet):
You're not entering a position now because:
Price is near ATH — a major liquidity area where fakeouts are common
You expect a potential rejection or liquidity sweep near ATH
No confirmed reversal or entry trigger yet
🟣 What You're Watching:
The AOI (Area of Interest) marked around $108,000–$110,000
This is likely a previous consolidation or demand zone
If price retraces and gives a clean setup (e.g., bullish structure, volume, RSI reset), then you may consider a long entry
🔍 Summary:
You're being patient and strategic, observing potential weakness in momentum . now 119.4k will be next ATH. In my point of view .
No trade now — waiting for confirmation or a pullback into your AOI zone.
👉 Follow me on X for real-time market updates & trade ideas! 👇
#BTC #Bitcoin #Crypto #Trading #TA #RSI #Divergence
BTC - See you at 120k!As said to all 120k shall be your park stances! Lets see how it breaks the range of 120-125k huehuehue