BITCOIN PREDICTION - MASSIVE CANDLE INCOMING!!! (WARNING) Watch this Bitcoin Prediction video now, you will love it!
Yello, Paradisers! Big warning sign: #Bitcoin is about to liquidate more traders soon if we get these confirmations that I'm sharing with you in this video. Loads of people will get wrecked again. Be careful not to get trapped into fakeouts.
In this video, I'm describing exactly what I'm seeing on Bitcoin, what patterns I'm waiting to form, and what confirmations I want to see before being able to say with 100% accuracy guaranteed that MARKETSCOM:BITCOIN is moving in that direction.
I'm sharing with you all the important targets and also how professional trading works: how risk-reward proper ratio trading works, and how high-probability trading depends a lot on how you choose to create your trades.
Watch this Bitcoin prediction to understand what I'm seeing right now on the chart and how I'm acting and making my decisions.
BTCDOWNUSDT trade ideas

The $BTC Swing Indicator Signals Low RiskHappy New Year! The indicators that make up the Bitcoin Swing Trade Indicator (BSTI) are bottoming in aggregate. I've been searching for nice daily swing trade indicators and have been swapping them out in the BSTI. Therefore, the BSTI has gone through changes, but it is almost ready for prime time. I'm thinking of changing out one more indicator. The solid ones I'm keeping are the SOPR momentum, money flow, aggregate funding rate (AFR), MACD, RSI, hash rate capitulation, Bollinger band trend, Coinbase premium, plus directional movement, and the transaction fee spike indicators. Besides the AFR, which is neutral, the indicators are signaling generally low risk.
--Da_Prof

Bitcoin - Will hit 135k in the short-term, Elliott and FIBOBitcoin is rising! That's what everyone sees at the moment, but we don't want to get drunk and establish our profit target. Where to take profit? Because we are in the price discovery mode, there is no previous price action above the current price. At this moment we really cannot use any horizontal lines, gaps, volume profiles, imbalances, previous ranges, or previous swing highs to establish our profit target. So we have to use special tools, such as Fibonacci extension or Elliott Wave.
The Fibonacci extension is a great tool - in bitcoin's case we have a 1:1 FIB extension sitting at 135,096. This level is also in confluence with a major trendline that we can see on the chart. This gives us a really good profit target in the short term for this particular trade. This is also an opportunity to short Bitcoin here, if you trade futures. From the Elliott Wave perspective, we are in wave (3), so I made a prediction on where this wave should terminate and also where wave (5) should terminate. I think my analysis definitely makes sense! Please share your analysis in the comment section, only copy your link here.
Trading tip at the end: Avoid the Obvious / Market Traps - Some obvious trading situations are kind of a trap where the chances are that everyone else has also spotted a wonderful trade situation which eventually sets you up for a disaster. Many people get trapped in some obvious good looking trades. Some obvious trades can sometimes be the market traps as they are hyped, professional traders stay away from these traps. Write a comment with your altcoin + hit the like button, and I will make an analysis for you in response. Trading is not hard if you have a good coach! This is not a trade setup, as there is no stop-loss or profit target. I share my trades privately. Thank you, and I wish you successful trades!

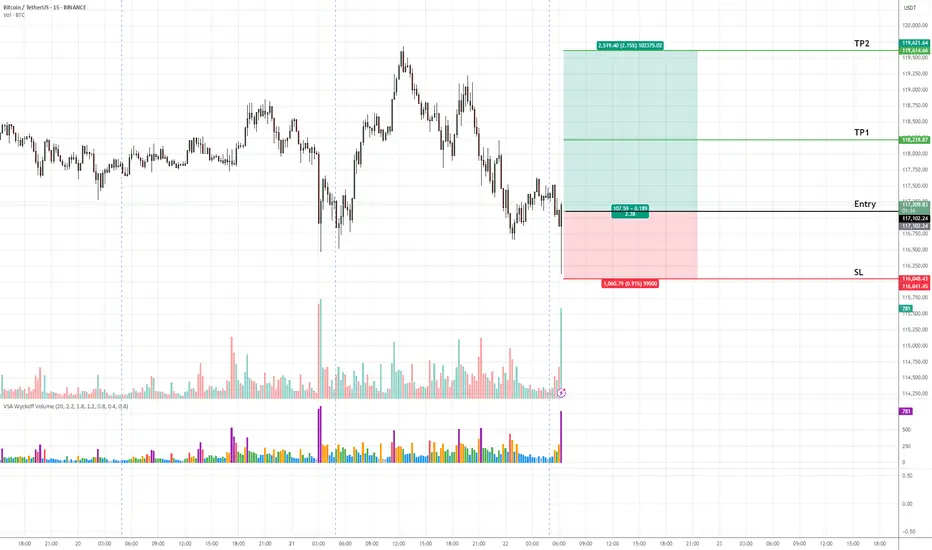
BTCUSD (Bitcoin) Buy Setup – VSA & Market Structure Analysis✅ Entry: As marked on chart
🎯 Take Profit 1 (TP1): Highlighted zone on chart
🎯 Take Profit 2 (TP2): Highlighted zone on chart
🛑 Stop Loss (SL): Defined below recent demand zone
📊 Technical Insight (VSA & Market Structure):
The recent decline into the support zone occurred on diminishing volume, indicating a lack of selling pressure.
A climactic volume spike (stopping volume) followed by a wide spread bullish candle suggests strong professional buying activity.
Subsequent bars show narrow range candles with low volume, characteristic of an absorption phase, hinting at smart money accumulation.
Price is now attempting to break above the previous minor resistance, which would confirm demand overcoming supply.
The broader market structure aligns with this setup: Bitcoin is in a higher timeframe accumulation range, and this move could initiate a markup phase as per Wyckoff/VSA principles.
📍 As long as price holds above the stop loss zone, we expect a bullish leg towards TP1 and TP2, in line with the emerging demand dominance.
TradeCityPro | Bitcoin Daily Analysis #132👋 Welcome to TradeCity Pro!
Let’s dive into the Bitcoin analysis and key crypto indices. As usual, in this analysis I’ll review the futures triggers for the New York session.
📅 1-Hour timeframe
On the 1-Hour timeframe, as you can see, Bitcoin is still holding the key support at 116829 and has been ranging between 116829 and 118440 since yesterday.
✨ Today, if the 118440 level breaks, we can open a solid long position. However, I still believe that due to Bitcoin Dominance being in a downtrend, altcoins are a much better choice for opening positions.
✔️ If you're only planning to trade Bitcoin, this trigger is suitable. The next entry points would be 120594 and 122733. If we open positions at all three triggers and the market moves upward, we can get strong risk-to-reward setups since we’ve entered with significant volume across three positions.
📊 If the 116829 level breaks downward, we might see sharper corrections. In that case, the next supports will be the 0.5 and 0.618 Fibonacci levels.
👑 BTC.D Analysis
Looking at Bitcoin Dominance, as you can see, the trend is heavily bearish and moving downward.
⭐ The downtrend in dominance is quite steep, and the next support we have is at 60.49. There’s still room for dominance to drop to this level.
📅 Total2 Analysis
Moving to Total2, yesterday the 1.46 trigger was activated and price moved to 1.5, and it is now sitting just below that level.
💫 If this level breaks, another bullish wave towards 1.62 could form.
📅 USDT.D Analysis
Looking at Tether Dominance, this index is also in a downtrend similar to Bitcoin Dominance, which shows that money is exiting both Bitcoin and Tether and entering altcoins.
🎲 So keep a close eye on altcoins in the coming days, because a lot of capital is flowing into them and they could see significant pumps.
❌ Disclaimer ❌
Trading futures is highly risky and dangerous. If you're not an expert, these triggers may not be suitable for you. You should first learn risk and capital management. You can also use the educational content from this channel.
Finally, these triggers reflect my personal opinions on price action, and the market may move completely against this analysis. So, do your own research before opening any position.

TradeCityPro | Bitcoin Daily Analysis #133👋 Welcome to TradeCity Pro!
Let's dive into the Bitcoin analysis and key crypto indexes. As usual, in this analysis, I’m going to review the triggers for the New York futures session.
⏳ 1-Hour timeframe
On the 1-hour timeframe, Bitcoin has once again dropped to the support area at 116829 and reacted to it. Currently, it is fluctuating above this level.
✨ If 119395 is broken, the price could move toward the highs at 120594 and 122733.
📈 So for a long position, we can enter on the breakout of 119395. Pay attention to Bitcoin dominance, because if it’s in a downtrend, Bitcoin setups might not be ideal, and altcoins may offer better opportunities.
✔️ If the price stabilizes below 117647, it will enter the box between 116829 and 117647, and this time the likelihood of breaking the 116829 bottom and heading toward lower supports for deeper corrections becomes very high.
👑 BTC.D Analysis
Now let’s look at Bitcoin Dominance. BTC.D is still falling and after breaking the 61.45 level, it has reached 60.46.
⭐ If this level breaks, the next bearish leg may begin. The trend is strongly bearish with no visible weakness, and we’ll have to see how long this continues.
📅 Total2 Analysis
Let’s move to Total2. This index has broken the 1.5 resistance and is moving toward 1.62.
💫 At the moment, I don’t have a trigger for it, and we need to wait until its structure gives us the next setup.
📅 USDT.D Analysis
Now let’s look at Tether Dominance. This index has stabilized below the 4.22 level and is now moving downward after a pullback to this area.
🧩 The next support is at 4.08, and the index has room to fall to that level. I still see the USDT Dominance trend as bearish for now.

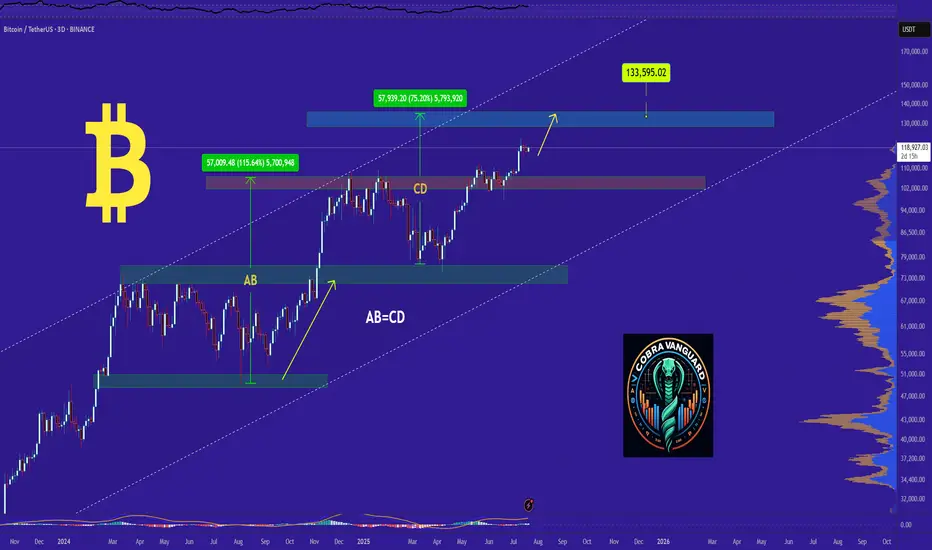
BITCOIN's Situation (12h) !!!So if you pay attention to the TON chart you can see that the price has formed a Ascending wedge which means it is expected to price move as equal as the measured price movement.( AB=CD )
NOTE: wait for break of the WEDGE .
Best regards CobraVanguard.💚

5 Lessons from My First 100 TradesAfter executing and reviewing over 100 real trades in crypto, forex, and gold — I found patterns. Bad patterns. Repeating mistakes. And lessons I wish someone had told me earlier.
So I broke them down into 5 key insights that changed how I trade — and might just save you thousands.
📘 Here’s what’s inside:
1️⃣ Smart Profit-Taking:
How I turned 10 R/R into 32 R/R using a dynamic exit plan.
📘Further resource:
Cycle Mastery (HWC/MWC/LWC)
---
Multi-Timeframe Mastery
2️⃣ The Sleep Edge:
70% of my losing trades happened after bad sleep. Here’s why that matters more than emotions.
3️⃣ No More Blind Stop Orders:
Why I stopped using buy/sell stops without real candle confirmation — and what I do instead.
📘 Further reading:
Breakout Trading Mastery
---
Indecision Candle Strategy
4️⃣ Multi-Layered Setups Win:
How structure, S/R, patterns, and timing stack into high-probability entries.
5️⃣ News Trading? Just Don’t.
The data behind why most of my SLs were hit near news time — and how I avoid the trap.
💡 These aren’t theories. These are real lessons from real trades.
If this video helped you or sparked an “aha” moment, give it a boost, commenting your takeaway, and sharing it with a fellow trader.
lets grow together :)

Bearish retest or deviation for Bitcoin117000 is key. it’ll decide whether this is a bearish retest or just a deviation. i believe it’s a bearish retest and we’re setting up for 110-114 next.
last drop came when price kept failing to hold above EQ. now we’re below the EQ of the ath/previous ath range. if price can’t reclaim that either, a deeper drop is likely. a 12h close above EQ could open the path toward 120-121k, but that’s the less probable case in my view.
why? nasdaq and spx are in premium zones (fib extensions), and holidays are near for big players. as profit taking hits there, pressure will echo here. simple cause, predictable effect.

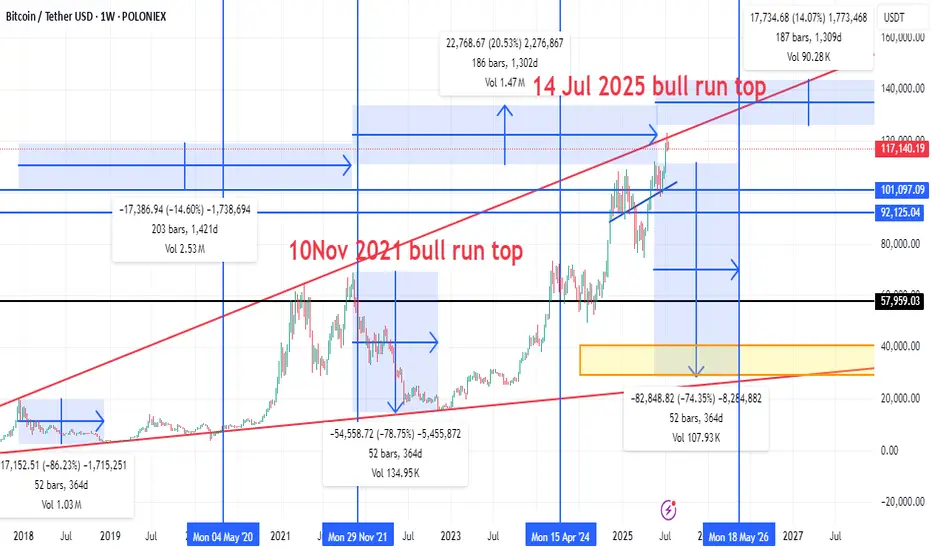
Bitcoin’s “four‑year” halving‑cycle rhythm by overlaying three c🔍 Key Highlights from the Chart
🟢 Bull Market Peaks
10 Nov 2021: Previous cycle top around ~$69,000.
14 Jul 2025 (Projected): Potential new bull market top (approx. $120K–$125K zone based on red trend line projection).
🔴 Bear Market Drops
2021–2022 Crash:
Drop of -78.75% from the 2021 top.
Lasted 52 bars (364 days).
Next Projected Bear Market:
Projected from July 2025 to May 2026.
Expected drawdown: -74.35%, possibly taking BTC down to the $30K–$40K range (orange box support zone).
📉 Correction Zones
Mid-cycle corrections like the one from Apr 2024, showing smaller drops (~20%).
📈 Trend Channel
Red diagonal lines form an ascending channel for bull market tops.
Current price (~$117,872) is nearing upper resistance of this long-term trend channel.
📊 Support/Resistance Levels
$120K & $125K: Horizontal resistance zones.
$57,959: Major historical support (former resistance).
$30K–$40K: Bear market bottom zone based on history and trendline confluence.
⏳ Cycle Timing
Historical cycles span about 4 years:
Peak → bottom → new peak = ~1,300–1,400 days.
This cycle’s timing aligns almost perfectly:
Nov 2021 → Jul 2025 = 1,300+ days (same as past cycles).
Suggests potential top is in or near.
📌 Summary & Outlook
Phase Estimate
Current Price ~$117,872
Projected Top ~$120K–$125K (likely topped 14 Jul 2025)
Next Major Drop -70% to -75% (target: $30K–$40K)
Next Cycle Low Mid 2026 (May–July 2026)
Strong Support Zone $30K–$40K (orange box)
🧭 Strategic Notes
If this chart pattern holds, major profit-taking should already be done or initiated.
Watch for weekly close rejections at trend channel top for confirmation of top formation.
Reentry in mid-2026 would historically offer a high reward/risk zone.
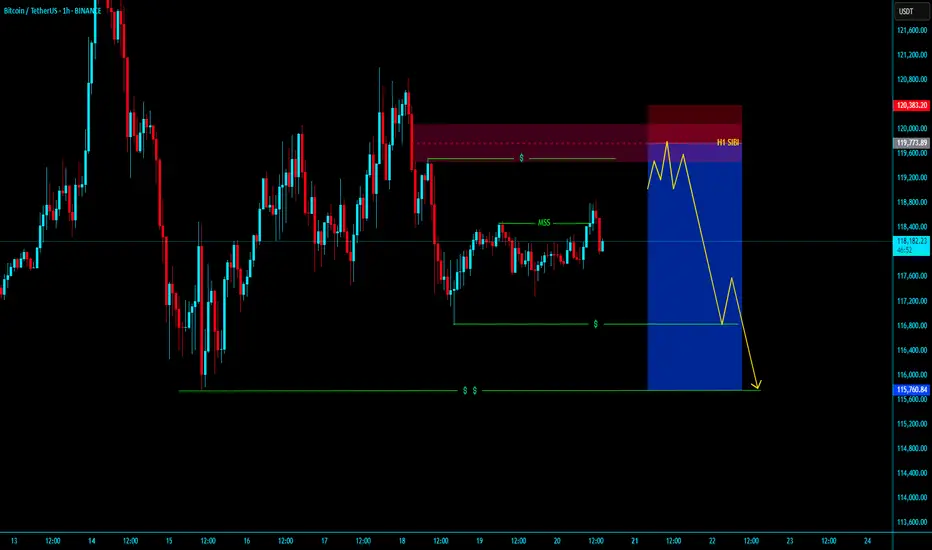
BTCUSDT BEARISH H1 SIBI SELL SHOTBTCUSDT BEARISH H1 SIBI SELL SHOT
Market is Bullesh Right now market is going to h1 sibi in LTF with valid mss with valid obi
entyr with tight sl and Target is our nearest Liquidity .....enjoyyyyyyyyyyy
KGB Priyabrat Behera
ICT Trader & Advance Mapping SMC Trader
$BTCXAG - BITCOIN TO SILVER - BULLMARKET IS NOT OVER!I bet you haven't seen this chart anywhere! The Bitcoin to Silver chart is preparing for another explosion!
And yes, BULLMARKET IS NOT OVER!

TradeCityPro | Bitcoin Daily Analysis #135👋 Welcome to TradeCity Pro!
Let’s move on to the analysis of Bitcoin and major crypto indices. In this analysis, as usual, I’m going to review the futures triggers for the New York session.
⏳ 1-Hour Timeframe
Yesterday, Bitcoin broke the 119,395 level but couldn’t hold above it and has now returned below this level, currently sitting on its previous trendline.
✔️ Today, the market will probably try to form more structure, and I think Bitcoin will range.
⭐ However, if it wants to move, we can enter a long position with the trigger at 120,594.
🔽 For a short position, we can enter if the 116,000 support area breaks.
👑 BTC.D Analysis
Let’s move on to Bitcoin Dominance. Yesterday, dominance had a bullish move, and finally, a support floor managed to prevent further drop in dominance.
🧩 A retracement to 61.20 has occurred. If this retracement continues, the upper levels are 61.53 and 62.
A break of 60.46 will start the next bearish leg.
📅 Total2 Analysis
Let’s go to Total2. This index has formed a range box between 1.48 and 1.55 and is still oscillating within it.
🎲 If 1.55 breaks, we can open a long position, and on the other hand, if 1.48 breaks, the price could correct to lower support levels.
📅 USDT.D Analysis
Let’s move on to Tether Dominance. This index also has a range box and is still moving inside it.
🔑 Breaking 4.13 is very important for the future market trend and could lead to a drop in dominance.

"BTCUSDT Bearish Reversal: FVG Breakout & Sell Target Zone AnalyThis BTCUSDT 1D chart highlights a Bearish Market Structure, showing a Break of Structure (BOS) followed by a Fair Value Gap (FVG) and Breakout. A Support Level within the Demand Zone was tested, and the price is projected to fall toward the Sell Target Zone near 99,581 USDT.

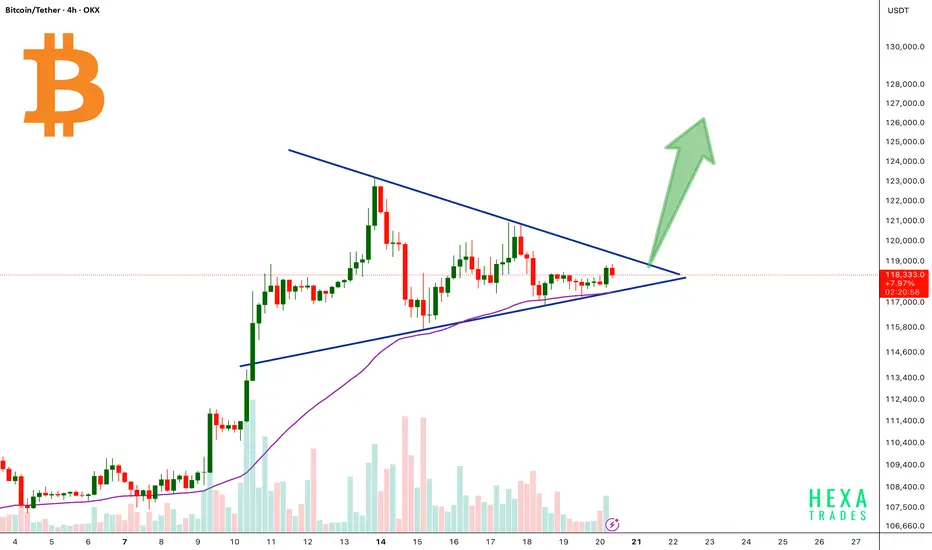
BTC Forming Bullish Triangle!Bitcoin is currently consolidating inside a symmetrical triangle pattern after a strong bullish rally. The price is approaching the apex of the triangle, signaling a potential breakout soon.
The 50 EMA is acting as dynamic support, perfectly aligned with the triangle’s lower trendline, reinforcing the bullish structure.
A confirmed breakout above the triangle resistance could trigger a strong upward move, with a potential target near the $125,000–$130,000 zone.
Cheers
Hexa
BINANCE:BTCUSDT CRYPTOCAP:BTC
Accumulate BTC over 115K💎 BTC PLAN UPDATE (July 23rd)
NOTABLE NEWS ABOUT BTC
Bitcoin (BTC) and Ripple (XRP) are approaching their all-time highs, while Ethereum (ETH) continues to grow steadily toward the important $4,000 mark. These top three cryptocurrencies by market capitalization are showing signs of a new bullish momentum, supported by strong technical structures and increasing investor interest.
TECHNICAL ANALYSIS PERSPECTIVE
1. Main Trend
The overall trend remains bullish, with a clearly rising price channel (black diagonal line).
However, BTC is currently in a short-term correction phase, consolidating sideways after the recent strong surge.
2. Key Price Levels
🔵 Strong Support Zone: 116,000 – 117,000 USDT
This zone includes the 200-day moving average (MA200), horizontal support, and a previous bottom — making it a decisive area for the short-term trend.
If this zone breaks, BTC could fall to a deeper support area around 111,000 USDT.
🔴 Resistance Zone: 122,000 – 123,000 USDT
This is a previous peak and a recently “false breakout” area — a strong psychological resistance.
If broken convincingly, BTC could surge to the 130,000 USDT zone (Fibonacci extension 1.618).
3. Possible Scenarios
✅ Bullish Scenario:
Price retests the 116,000 – 117,000 support zone and then bounces.
If it breaks through the 122K resistance, the next target is 130,000 USDT.
❌ Bearish Scenario:
If price breaks below MA200 and the 116K support zone → it could drop to the deeper zone around 111,000 USDT.
4. Technical Signals
There is a triangle accumulation pattern (with flat tops and bottoms).
The “false breakout” at the resistance zone shows that buyers are not yet strong enough and a retest of support is needed.
Follow the channel for the latest and continuous updates on XAUUSD, CURRENCIES, and BTC.

Bitcoin is testing the triangle ┆ HolderStatBINANCE:BTCUSDT is ranging $132K–$137K in a triangle pattern. Breakout above $137K may target $143K. Decision point near.

Bitcoin price analysisPossible LTF setup:
We got the 2h swing point retest. If base support holds, I’m looking for a potential move back to 119k — possibly even a gap fill to 119.7k before taking out the local lows.

BTC - Long SET-UP BINANCE:BTCUSDT
Bitcoin AMC Pattern Forming?
BTC is showing signs of an AMC-style accumulation after a range-bound consolidation. A clean breakout is possible if price respects the 113k–113.8k support zone — potential entry zone for smart money 📈
Alternatively, deeper liquidity may be tapped at the 110k–112k OB zone, offering another high-probability buy setup🔁
Watch for signs of bullish intent in these key zones — price structure suggests upside potential once liquidity is swept✅

Bitcoin support and resistance areas to observeI've identified some very clear support and resistance areas that could provide some gains on the daily chart.
If it breaks the upward resistance line then the next stop could be all time high resistance.
If it breaks the downward support line then the next stop could be $111,600 area.
One to watch over the next few days to see if it respects those lines.

Bitcoin AnalysisWe have an order block in 1Hour TF, price can retest this before bullish continuation. If it breaks below bearish momentum continues.
BITCOIN Possible trade ideaHere is the graph of a possible BTC trading idea.
BTC is currently consolidating in a triangle with a possible breakdown after reaching ATH.
