Bitcoin - Bull Trap! Don't get caught (Buy at 102,909 USD)Bitcoin has been pumping last week, but the problem is that the bulls made a false breakout above the bullish flag / descending channel. We see that the price went above the channel but failed to continue in the uptrend. This is called a false breakout of a pattern or a bull trap. Usually what happens next is that the price goes in the opposite direction!
That's a pretty bearish case because the bulls are now trapped in their long position, and we all know that the whales need liquidity (orders and stop losses). That's why they will be ready to push the price to the downside, potentially to the 0.618 Fibonacci retracement of the previous impulse wave.
From the Elliott Wave perspective, this is a bullish setup, but we have just finished an impulse wave (1), so we should wait for an ABC correction (wave (2)) to form before entering a long position. I expect Bitcoin to hit 102,909 USD in the short term because there is the 0.618 FIBO. Also, we have an unfilled FVG between 102k - 104k on the daily chart. Usually these kinds of gaps tend to be filled sooner rather than later; that's why I expect a pullback.
Write a comment with your altcoin + hit the like button, and I will make an analysis for you in response. Trading is not hard if you have a good coach! This is not a trade setup, as there is no stop-loss or profit target. I share my trades privately. Thank you, and I wish you successful trades! Trading tip at the end: Organize Personal Life - Professional traders have great management of their personal life as they keep their trading activities from personal concerns. Balancing your personal life is essential to achieve harmony as well as improve your performance in trading.
BTCDOWNUSDT trade ideas

$BTC/USDT Eyes $121KCRYPTOCAP:BTC has broken out of the descending wedge and is holding above key support around $106K.
The structure looks bullish with a potential move toward $121K (+11.24%).
As long as the price stays above the breakout zone, momentum favors the bulls.
DYOR, NFA

BTCUSDTThe Bitcoin market is overbought. I expect a change in trend. A diamond with traders' stop points will be great as a reversal pattern. Let's see

BTC Forming Second Diamond: New ATH Targeting $115K–$120KAfter topping out at the previous ATH, Bitcoin formed a classic diamond top pattern which triggered a drop to the $98,115 level. Now, Bitcoin appears to be forming a second diamond — but this time, the breakout structure suggests a bullish reversal rather than a top.
This second diamond formation indicates consolidation before a strong upward move, potentially driving BTC toward a new all-time high between $115K and $120K.
Watch for confirmation of the breakout. If price holds above key resistance levels post-pattern, the bullish scenario gains strength.

BTC PRICE PREDICTION
According to my personal analysis, Bitcoin has the potential to reach between $112,000 and $120,000.
Everyone should hold onto their coins confidently and avoid panic. The market is expected to move upward. Stay focused and trust the process.

BTCUSDTPreferably suitable for scalping and accurate as long as you watch carefully the price action with the drawn areas.
With your likes and comments, you give me enough energy to provide the best analysis on an ongoing basis.
And if you needed any analysis that was not on the page, you can ask me with a comment or a personal message.
Enjoy Trading ;)
TradeCityPro | Bitcoin Daily Analysis #122👋 Welcome to TradeCity Pro!
Let’s dive into the latest analysis of Bitcoin and major crypto indicators. As usual, this update will focus on potential triggers for the New York futures session.
⌛️ 1-Hour Timeframe
On the 1-hour chart, Bitcoin is once again ranging between the 107,853 and 108,619 levels.
✔️ Last night, Bitcoin briefly faked out below the bottom of this range, so we now need to wait and see how the price reacts upon revisiting this area.
💫 I believe it’s best to hold off on entering a short position until we identify the precise location of the support line. As price retests this area, we can pinpoint the true support level.
✨ Once that level is confirmed, and if it breaks, a short position could be considered. The next support zones would be at 106,586 and 105,370.
📊 Make sure to watch the volume closely for this trade, and I strongly recommend waiting for a volume confirmation before entering.
📈 As for a long position, if 108,619 breaks to the upside, we could consider going long. The buying volume in the current upward leg is increasing, and if this trend continues, a breakout above 108,619 would make a long position reasonable.
👑 BTC.D Analysis
Moving on to Bitcoin dominance — it has once again reached its trendline and is currently being rejected from it. If this rejection continues, BTC.D could decline toward 65.04.
🔍 However, if the trendline breaks, the 65.31 level will be the bullish confirmation trigger.
📅 Total2 Analysis
Now on to the Total2 index (altcoin market cap excluding BTC), it has bounced from the 1.14 support and is moving toward 1.16.
🔑 A breakout above 1.16 would serve as a bullish confirmation for long positions, with 1.17 acting as the main breakout trigger.
📅 USDT.D Analysis
USDT dominance is also moving downward and has reached the 4.78 support zone.
💥 A breakdown below this level would confirm a bearish continuation toward the 4.72 level..
❌ Disclaimer ❌
Trading futures is highly risky and dangerous. If you're not an expert, these triggers may not be suitable for you. You should first learn risk and capital management. You can also use the educational content from this channel.
Finally, these triggers reflect my personal opinions on price action, and the market may move completely against this analysis. So, do your own research before opening any position.

BTCUSDT 4H Analysis | Apex Decision ZoneStructure & Price Action
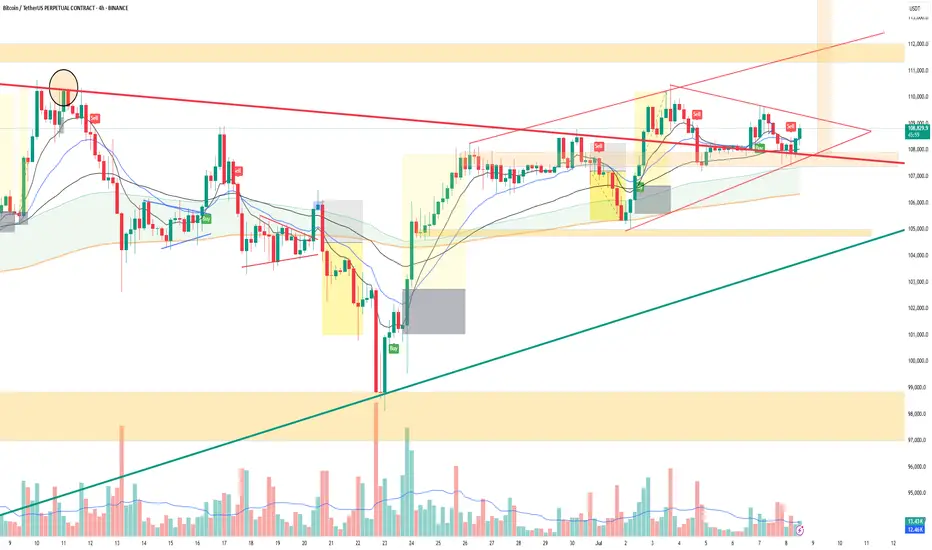
BTC is consolidating within a symmetrical triangle (red trendlines).
Price is squeezing near the apex, suggesting an imminent breakout.
Strong defense at ascending channel support (~108K zone) + green trendline.
Lower highs indicate sellers still active, but higher lows reflect buyer strength too.
Price bounced from previous demand block (green box), now pushing toward resistance.
📊 Indicator Confluence
RSI: Curling up from mid-range (~52–55), no divergence, neutral-to-bullish tilt.
DMI/ADX: ADX rising slightly, -DI weakening vs +DI → potential trend shift brewing.
MACD: Histogram flat; momentum hasn't confirmed either side yet.
Wave Trend: Bouncing from mid-line, bullish cross may form if price breaks triangle.
Volume: Gradual decline = typical pre-breakout compression. Watch for spike.
Stochastic: Flipped bullish from oversold — early bullish bias.
🎯 Summary & Probabilities:
BTC is coiling near triangle apex — breakout likely soon.
🔼 Break above 109.4K with volume → 60% chance of move to 110.5K–111.5K.
🔽 Drop below 107.9K → 40% chance of fall to 106.3K–104.4K.
Bias: Neutral-to-bullish — confirmation needed.
BTC/USD SCENARIO Bitcoin is trying to break out of the 110,000
If we break out we will see a new high
If we don’t break it we could see 105k possibly 100k
BTC LETS RETRY AGAINBINANCE:BTCUSDT.P Is gathering Bullish momentum again to try going war against that resistance. On this short video, i explained the reason why im looking to buy btc, Both entry and exist are on the video. Good luck to us all.

Breakout vs Fakeout: How to Spot the DifferenceHello, Traders! 🖖🏻
There’s probably no phrase that triggers more mixed emotions in crypto trading than: “Looks like we’re breaking out!”. Because let’s be honest…For every clean breakout that follows through with momentum…
…there’s a fakeout waiting to trap overconfident entries.
So, how do you tell the difference? Let’s break it down!
🧱 What Is a Breakout?
A breakout occurs when the price moves decisively beyond a key level, such as support, resistance, a trendline, or a range boundary, and holds.
What makes it a REAL breakout?
Volume Expansion: More participants step in as the price moves through the level.
Strong Candle Closes: Especially on higher timeframes like 4H or 1D.
Follow-Through: The market doesn’t just poke above the level. It builds on it.
No Immediate Rejection: You don’t see a sharp wick straight back below.
Example from BTC (2021):
Look back at January to February 2021. BTC had been stuck under the $42K–$43K resistance for weeks. Every push got sold off, until it didn’t.
When the breakout finally came, it was clean. The massive daily candle closed right through the level. Volume exploded. And there wasn’t even a polite little retest, price just launched straight toward $58K, leaving anyone waiting for a pullback completely behind.
Pure trend breakout energy. Everything lined up: the context, the volume, the structure — textbook 🤌🏻
🪤 What Is a Fakeout?
A fakeout, on the other hand, looks like a breakout… until it isn’t. The price briefly moves beyond a key level, but then snaps back inside the range, often trapping late buyers (or sellers) and triggering stop-losses.
Common Signs of a FAKEOUT:
Low or Declining Volume (at the breakout moment).
Quick Rejection with a Long Wick (especially on intraday charts).
Failure to Hold Above the Level on Retest.
Divergence Between Timeframes: For example, a 15M breakout that looks strong while the 4H still shows consolidation.
Classic BTC example:
This one was sneaky! After BTC hit its all-time high around $65K, the market started looking shaky. Price tried to recover by pushing back into the $58K–$60K zone, a pretty critical level at the time. It looked like a breakout attempt… but something was off. No real volume. No strong candle closes. And then, BOOM, hard rejection. The price popped just enough above resistance to lure in breakout traders (and probably clear out some stop-losses)… then completely reversed. And not just a minor pullback, this fakeout basically triggered the entire leg down toward $30K. Classic liquidity grab. The kind of move that looks like strength for a second… until it absolutely isn’t.
🕵️♂️ Key Differences: Breakout vs Fakeout (Checklist)
🧠 What Causes Fakeouts in Crypto?
Honestly, fakeouts aren’t some kind of accident. They’re almost baked into how crypto markets work.
Part of it comes down to simple liquidity hunting. The market knows exactly where traders tend to place their stop losses, right above resistance or just below support. Price often spikes into those zones, triggers stops, fills larger orders for bigger players… and then reverses completely.
Another reason? A lack of real conviction. Sometimes, it’s mostly retail traders chasing a move. Price pokes above a key level, but there just isn’t enough momentum to sustain it. Without bigger buyers or sellers stepping in, the move collapses right back.
And let’s be honest. When everyone on Crypto Twitter is watching the exact same level, fakeouts become almost inevitable. The more obvious the setup, the more likely it gets front-run, faded, or manipulated.
Plus, a huge mistake? People ignore the higher timeframe context. A breakout on the 15-minute chart might feel exciting… but if the 1D or 4H is still clearly in a downtrend, that breakout is fighting against the bigger picture. No surprise it fails. Fakeouts happen because the market’s job is to make most people wrong, at least for a moment.
🧭 Final Thought
Breakouts and fakeouts are part of the same game: they involve both liquidity and psychology. The market rewards patience, context, and waiting for confirmation. Sometimes, missing the first candle can save you from being a liability to someone else. So, next time an asset “breaks out,” take a second look. Is it really moving with force? Or is it just another trap waiting to be sprung?
What’s the last fakeout that caught you off guard? Drop your story in the comments. Let’s compare lessons learned!

Is the Fear & Greed Index Becoming a Victim of Its Own Success?I’ve noticed something about the Fear & Greed Index that rarely gets discussed:
Its reputation as a “contrarian indicator” may actually dampen market declines. When everyone sees “Extreme Fear” and believes it’s time to buy, the panic doesn’t deepen as it might have in the past—potentially muting major market lows.
This creates a feedback loop:
The index signals “buy the fear,”
Enough traders pile in,
The market stabilizes before real capitulation sets in.
When a widely-followed counter-indicator becomes common knowledge, it can lose its edge. In today’s markets, these signals may serve more as social safety nets than as true predictors of sentiment extremes.
Bottom line: If the “fear” signal stops working, or stops triggering buying, it could be a warning that the market’s safety net is gone. I wonder, is the VIX subject to the same mitigating effect?
The Fear & Greed Index has never been truly tested during a long term bear market.
But then it may partly be why we have not had one in so long.
Would love to hear your thoughts—has anyone else noticed this effect?
Is Bitcoin Getting Ready to dump?
In this analysis, I looked at the weekly, daily, and 4-hour timeframes and found some key signals that suggest a major shift might be coming in Bitcoin’s movement over the next few days and weeks.
If you don’t want to get caught off guard by the next big move, make sure to watch the video all the way through!

Bitcoin (BTC): Bullish as Long as Buyers Hold EMAs | $112K Next?Bitcoin buyers have taken full control since bouncing from EMAs on the 2nd of July (where also our entry point was sitting last week).
Since then we have seen decent buyside dominance and we are looking for further pressure from buyers, which would result in a retest of the current ATH area, but keep in mind—we are in a very dangerous zone (near a new ATH where buyers are still showing dominance which is giving us a sign that this is not yet the full potential of the coin).
We are bullish as long as we are above the EMAs!
Swallow Academy

BTC SCALP TRADE / Long Setupwait for the entry, must use SL. If final tp is achieved then trade is not valid, active till final tp. Must use proper risk management. Expecting upside move. If SL hit then take previous trade, It's still valid.

Like the previous cycles!Our basis is the Fibonacci retracement with 78%. The 78% level should be aligned with the previous peak.

btc/usdtI think it's time for Bitcoin to grow. It doesn't matter what the news is. This time, Bitcoin and Tether's dominance have reached their peak and are ready to make Bitcoin grow. This is my analysis. What do you think?

(BTC/USDT).- Bitcoin (BTC/USDT) .
- Current price testing resistance at $110,489.
- Descending trendline indicates potential bearish pressure.
- Key support levels: $107,466, $105,000, $102,693.
- Potential upside target: $112,500 if resistance breaks.
- Potential downside target: $100,000 if support fails.

Bitcoin Eyes $112K, Liquidity Magnet AheadCRYPTOCAP:BTC Eyeing Breakout?
Bitcoin is consolidating tightly between 107.7K and 108.3K after a strong bounce from local support.
Short-term support has formed near 107.7K, but there's still liquidity below ~106.5K that may get swept before the next move.
If BTC holds above 107.5K and breaks 108.3K cleanly, we could see a quick move toward the $110.6k – $112K liquidation zone, with ATH in sight.
According to HTF, we need a daily close above 110k to confirm it in the HTF.
The market remains bullish unless 106K fails.
Will the magnet zone pull us higher?
Like & follow for more sharp updates.
DYOR. NFA
CRYPTOCAP:BTC BITSTAMP:BTCUSD BINANCE:BTCUSDT

BTC-USDT Market Analysis for the Last 24 Hours
Hello, crypto enthusiast! 👋 Let’s see what has been happening with Bitcoin over the past 24 hours!
🔍 Price Action
Bitcoin dipped slightly during the day, sliding from ~108,970 USDT to a current price of about 108,166 USDT. That’s a decline of roughly 0.7 %—nothing too dramatic for the crypto market! 😉
📰 Hot News
• John Bollinger (renowned technical analyst) said that “Bitcoin is close to a breakout”; many analysts remain upbeat despite the small pullback.
• South Korea is seeing explosive crypto-market growth: total capitalization has topped $74.8 billion, and daily trading volume has reached $10.7 billion—higher than on the country’s two main stock exchanges!
• Fun fact: Korea’s well-known “kimchi premium” means crypto prices there can run about 10 % above global levels due to strong local demand. 🌶️
📊 Technical View
During the last 24 hours BTC traded between $107,393 and $109,048. Volumes were especially heavy from 21:00 to 22:00 on 7 July, when more than 100 million USDT changed hands.

BTC there was a limit seller yesterday 109700 BTC there was a limit seller yesterday 109700 . Today I'm looking at sales locally

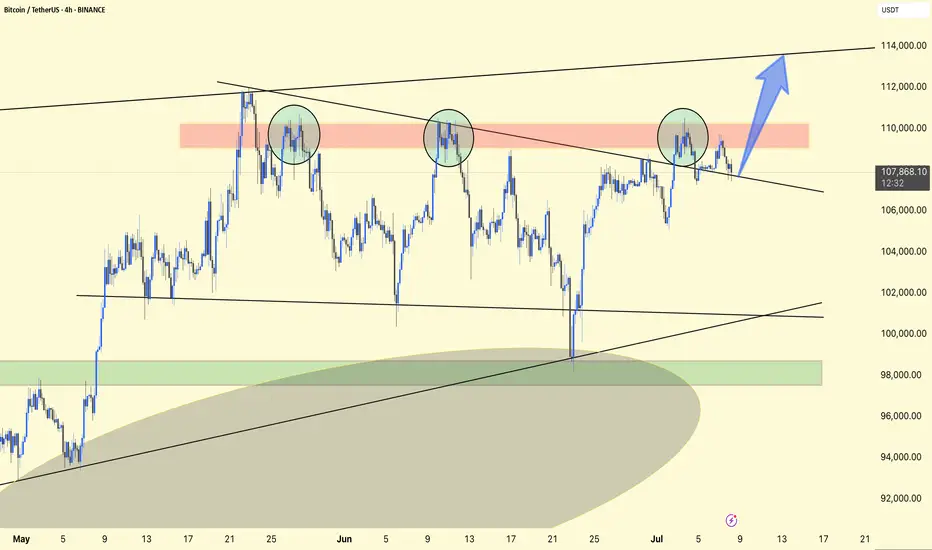
BTCUSDT 4H Analysis
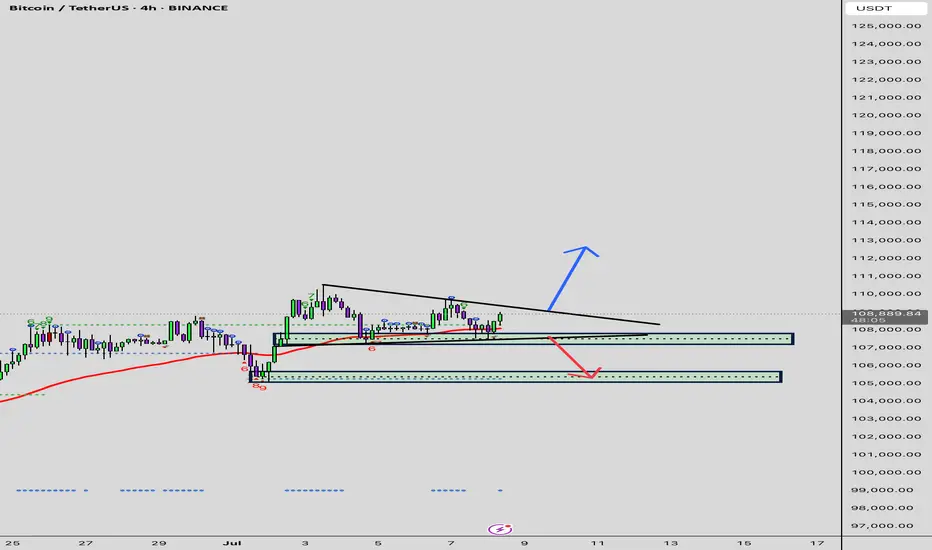
BTC is consolidating below the key resistance zone highlighted in red (~$109,000–$110,000).
The price continues to form higher lows, showing bullish pressure despite rejection in the red zone.
The structure resembles an ascending triangle, indicating a potential breakout.
Upside Target: ~$113,500–$114,000 if the price moves above ~$110,000 with strong volumes.
Support Zone: ~$106,000–$106,300 must hold to keep the bullish scenario intact.
If the support breaks, the price could retest ~$102,000–$103,000.
Small Insights: Repeated retests of resistance suggest that bulls are absorbing supply. A strong push above the red zone could trigger a short squeeze.
Stay alert!
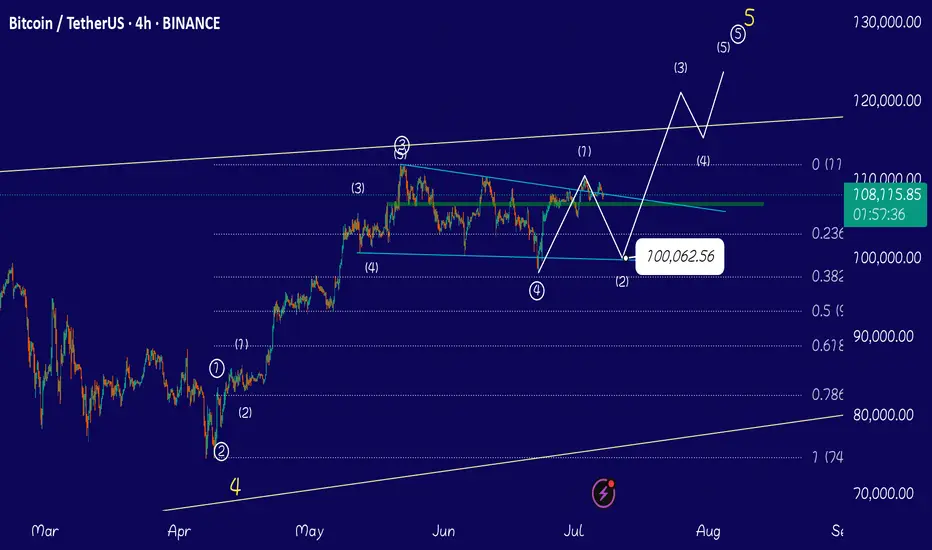
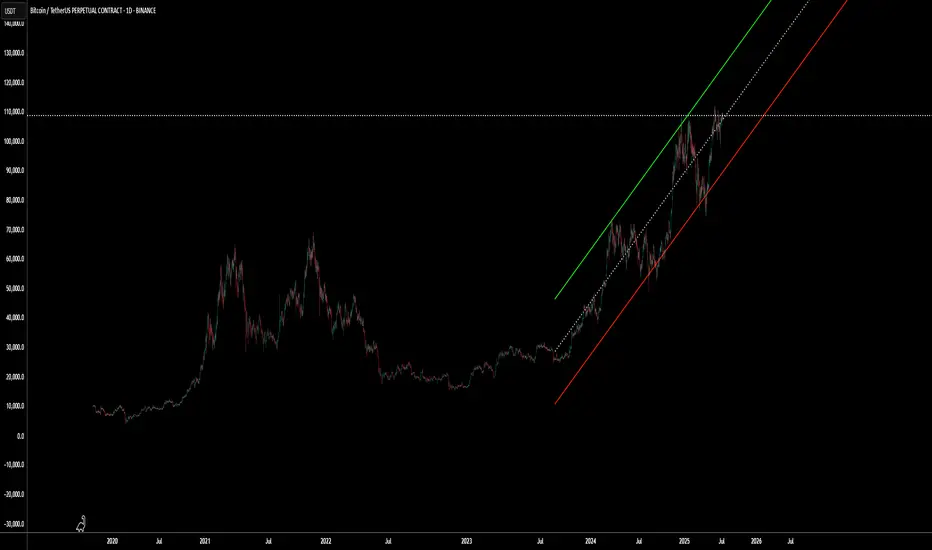
Wait for 100k ( read reasons)If you look at my chart you can see the truth, Elliott waves are well marked on the chart, we are now completing the micro wave 2 of the main wave 5, I expect the corrective micro wave 2 to correct the price to Fibonacci 0.78, which is exactly touching the lower descending line of the channel and includes the 100k price range. Wait for the micro wave 1 correction to complete and buy again in the 100k range. I will not open a short position and I advise you to wait for the price correction to 100k.