BTCDOWNUSDT trade ideas

My Long term BTC-USDTP PLANmy long term plan or the rest of the year leading into April im working on.. still needs a little more confirmation but today pull was very significant indeed

Can #BTC reach a new high?📊Can #BTC reach a new high?
🧠We cannot be too optimistic before we break through ATH, because the daily adjustment expectation still exists.
➡️We are currently in a heavy resistance area near 110,000. This is our third test. Regardless of whether we can successfully break through, don’t chase the rise here, because the cost-effectiveness is not high. If you want to go long, you should also wait patiently for the callback to occur before considering it. Or wait for the callback after breaking through ATH before considering it.
➡️If you want to participate in short trading, you can only participate in a small amount with ATH as a defensive point. Or wait for the rebound after breaking through the upward trend support line before participating.
🤜If you like my analysis, please like 💖 and share 💬
BITGET:BTCUSDT.P

BTCUSDT Forming Bullish WaveBTCUSDT is currently setting up a promising bullish wave pattern, showing signs of steady upward momentum that could deliver a healthy 10% to 20% gain in the near term. After a period of consolidation and healthy correction, Bitcoin’s price is starting to push above key resistance levels, indicating strong buying interest and renewed confidence among long-term investors and institutional traders alike. This setup has caught the attention of market participants looking to capitalize on Bitcoin’s next potential leg up.
Recent on-chain data and technical indicators show a robust foundation for this bullish wave pattern, with increasing trading volume supporting the upward move. Bitcoin continues to hold above crucial support zones, which adds further confidence for buyers aiming to ride the trend towards its next major psychological levels. The overall sentiment remains positive as Bitcoin’s dominance in the crypto market signals strength, helping to drive capital inflow from altcoins back into the king of crypto.
As we know, Bitcoin’s market behavior often sets the tone for the entire crypto ecosystem, so this bullish scenario could spill over into other major altcoins as well. Traders and investors should keep an eye on key resistance zones, potential breakout levels, and any sudden surges in volume that confirm the wave pattern is playing out as expected. Patience and disciplined risk management will be essential to maximizing profits during this phase.
✅ Show your support by hitting the like button and
✅ Leaving a comment below! (What is You opinion about this Coin)
Your feedback and engagement keep me inspired to share more insightful market analysis with you!

BTC in a Bearish 60 min movementBTC in a 60-minute bearish move
It appears that BTC has already completed the C leg of a 60-minute harmonic pattern near 109680
BTC is forming a larger corrective pattern rather than taking a true direction, thus increasing the chances of completing this pattern before moving up again.
Currently, the price is positioned to complete the D leg of the pattern near 105700
I am looking for short-term targets near 107240; 106275 and 105715
You may find more details in the chart!
Thank you and Good Luck!
PS: Please support with a like or comment if you find this analysis useful for your trading day

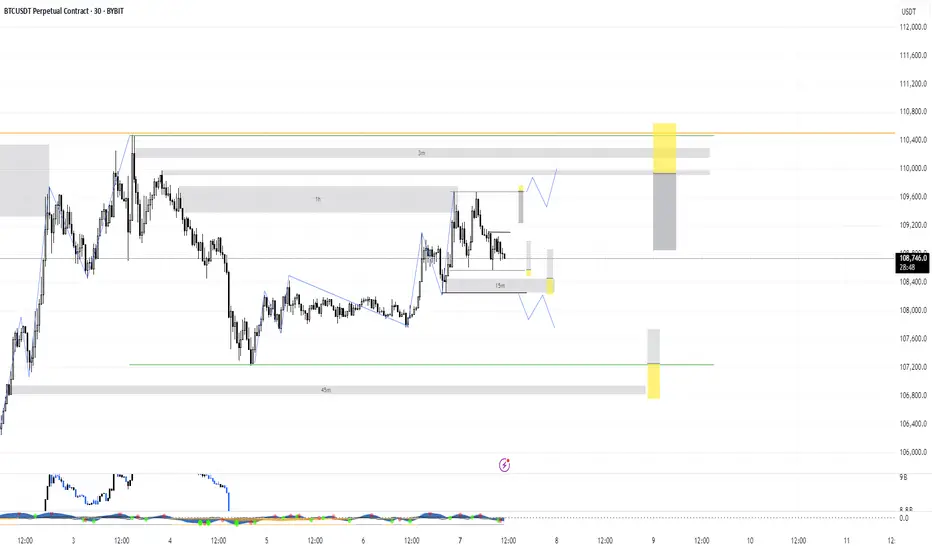
BTCUSDT | 30-min & 4H Outlook🔍 Structure & Price Action
BTC is trading within a rising wedge (blue lines) nearing apex — typical bearish setup.
Price is repeatedly getting rejected near macro trendline (~108.8K–109K).
30-min shows clean breakdown from lower wedge support, retesting the zone now.
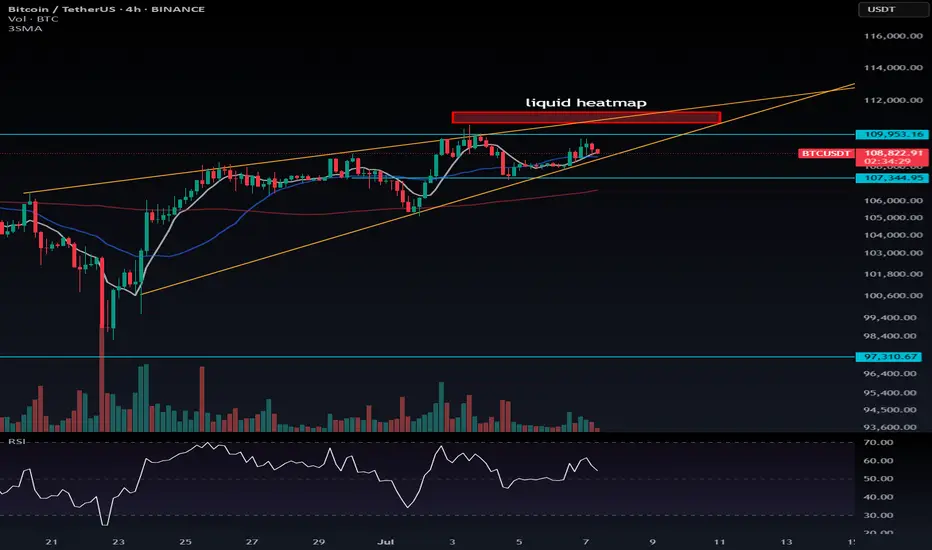
On 4H, BTC is still under key resistance zone between 109.6K–110.4K, previously rejected twice.
🔻 Bearish Signals
Multiple Sell signals on both timeframes.
Bearish divergence visible in RSI and MACD on 4H.
Volume spike on the breakdown → confirming sellers in control.
🔑 Key Levels
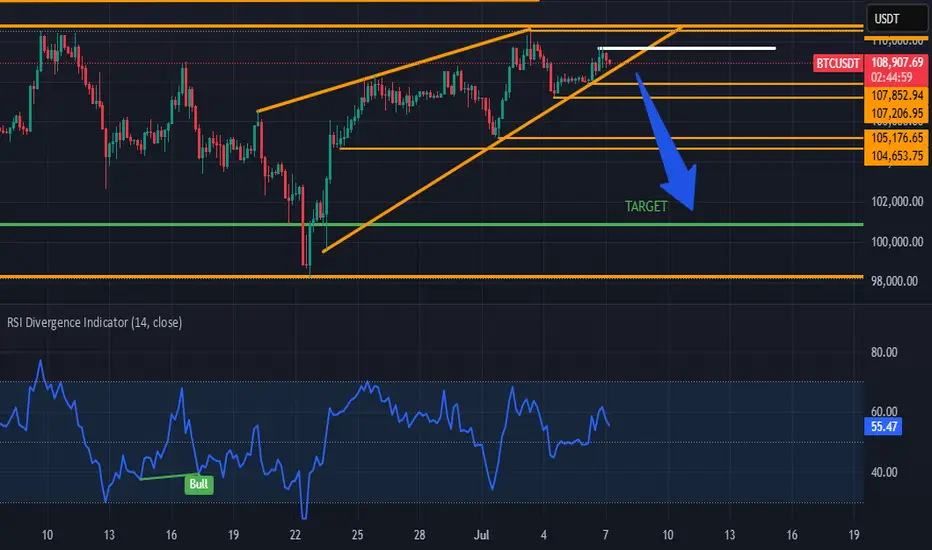
Support: 107.7K (current zone) → loss opens path to 106.6K, then 104.4K.
Resistance: 108.9K–109.4K = confluence of EMA cluster + macro TL + Fib zone.
📊 Indicators (4H)
RSI dropping from mid-zone (~48), no bullish momentum
DMI shows increasing ADX with -DI over +DI → trend strengthening bearish
TSI & Wave Trend both curling down
Stochastic in overbought, starting to reverse
🎯 Summary
Bias: Bearish below 108.6K
Invalidation: Bullish breakout above 109.6K + volume close
Setup: Watch for retest and rejection at ~108.4K–108.6K = clean short trigger
Next Targets: 107.2K → 106.6K → 104.5K

BTC Price Prediction Price breaks down from inside the channel and turns bullish from a point between 106500 (very high probability) and 102500 (low probability).
Volume Weighted Average Price
Classical Technical Analysis
Rising Wedge Formation
Elliot Wave - Correction Wave
Pitchfan
Harmonic - Potential Bullish Gartley
Smart Money Concept
ICT

BITCOIN CRASH INCOMING!!! (Brace Yourself Now???) I am breaking down MARKETSCOM:BITCOIN and the potential completion of the 4th wave on an leading diagonal which might work as an early warning of a crash towards $93k!
Wait for the confirmations, and play the market with a proper trading strategy that you have backtested enough to be able to say that you will be long-term profitable. That means make sure your trading system is good enough that you always have an edge and a great enough money management system to make sure that you are giving your edge enough space to play out in the long run and be robust against losing streaks!

Bitcoin sell short bigBitcoin is ready to fill the big gap and the biggest liquidity, the range of 25,000 and 19,000 can be a good time to buy Bitcoin.

Bitcoin is ready to fill the biggest gap and the largest liquidiBitcoin is ready to fill the big gap and the biggest liquidity, the range of 25,000 and 19,000 can be a good time to buy Bitcoin.
🤪🤪🤪

Bitcoin: The night before the plunge? →104,000?
Bitcoin fell under pressure from highs, with short-term bearishness but strong long-term fundamental support.
1. Market fundamentals
Institutional holdings continue to grow
BlackRock Bitcoin ETF (IBIT) exceeds $72 billion in size, dominating the market
MicroStrategy holdings increased to 597,000 BTC (about $63 billion), continuing to increase holdings on dips
Global Bitcoin ETF Net inflow of $4 billion in June shows strong demand for institutional allocation
Policy and regulatory progress
The U.S. Treasury Department plans to include Bitcoin in the "strategic reserve assets" to enhance its legal status
The SEC will make a ruling on spot ETF option transactions on July 15, which may bring new liquidity
The Trump administration plans to impose a 60% tariff on China, and market risk aversion may heat up again
On-chain data changes
A 14-year dormant address recently transferred 80,009 BTC (about $8.69 billion), triggering concerns about selling
The lightning network capacity exceeded 5,000 BTC, and Tether (USDT) completed the lightning network integration
II. Technical depth Degree analysis
(1) Medium-term trend structure (4-hour level)
Rising channel break: After the price peaked at $112,000, it continued to fall below the rising trend line support
Range oscillation formation: Currently, $98,000-110,700 constitutes the main trading range, and the middle track support is $104,000
Volume change: The recent decline is accompanied by an increase in trading volume, indicating that the short-term momentum is increasing
(2) Short-term trading signals (1-hour level)
Double top pattern confirmation: $110,700 was tested twice without breaking, forming a typical reversal structure
Moving average system short arrangement: EMA5/10/30 formed a death cross, suppressing price rebound
Key support level:
▶ First support: $106,500 (Fibonacci 38.2%)
▶ Second support: $104,000 (psychological barrier + previous low)
▶ Strong support: $98,000 (lower track of the range)
III. Trading strategy suggestions
1. Aggressive short position layout
Entry range: $109,000-109,500
Stop loss setting: $111,000 (above the previous high)
Target: $106,500→$104,000
Technical basis: downward trend line suppression + RSI top divergence
2. Steady retracement of short positions
Entry signal: 108,000-108,500 rebound encountered resistance
Stop loss setting: $110,000 integer barrier
Target: $104,000 (break down to see 98,000)
3. Long defense area
Key observation position: 104,000 US dollars (if there is a large volume to stop the decline, you can try long with a light position)
Breakthrough signal: Stabilizing 110,700 US dollars will restart the upward trend
IV. Multi-dimensional market outlook
Short-term (1-2 weeks):
Affected by technical suppression and whale movements, it is expected to maintain 104,000-110,700 range fluctuations
Focus on the effectiveness of 106,500 support, breaking down will accelerate the test of the lower track of the range
Medium-term (Q3 quarter):
Institutional continued holdings + Fed rate cut expectations constitute long-term support
If it breaks through 112,000 US dollars, it will open up to 120,000-125,000 upside space
Risk warning:
The SEC option trading ruling on July 15 may cause violent fluctuations
Global macroeconomic data (especially CPI) will affect market risk preferences
V. Professional trading suggestions
▶ Currently, the "rebound short" strategy is preferred, and stop loss is strictly set
▶ Long-term investors can arrange in batches in the range of 98000-104000
▶ Pay close attention to:
Daily ETF fund flows, changes in on-chain whale addresses (glassnode alert system), US CPI data (released on July 12)
Conclusion: Although the short-term technical side is bearish, the long-term fundamental support of Bitcoin remains solid. It is recommended that traders seize the opportunity of range fluctuations, operate flexibly at key support/resistance levels, and wait for new trend signals to be confirmed.

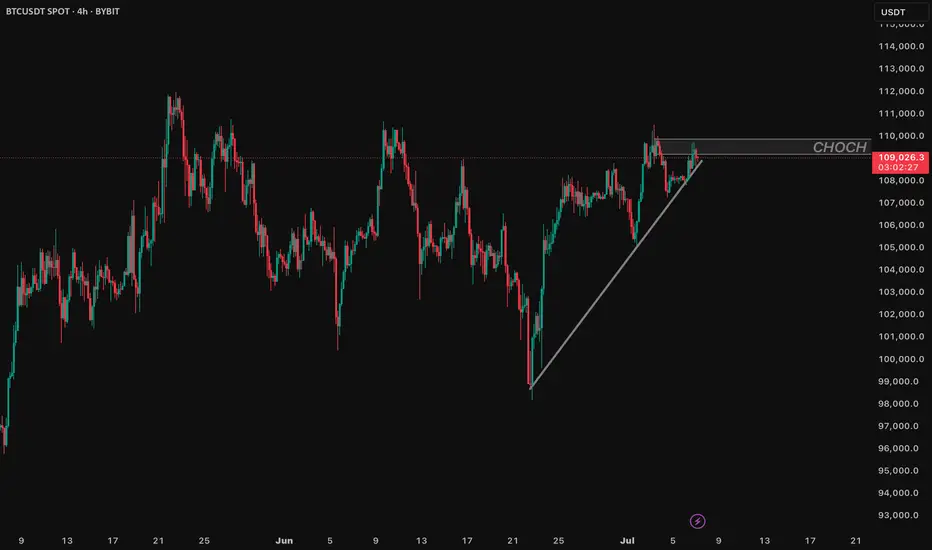
BTC up following H1 trend linePlan BTC today: 07 July 2025
Related Information:!!!
Bitcoin (BTC) trades slightly below $109,000 at the time of writing on Monday, following its highest weekly close on record. Institutional and corporate demand continues to serve as a key catalyst, with Metaplanet acquiring an additional 2,205 BTC on Monday, while US-listed spot Bitcoin Exchange Traded Funds (ETFs) saw over $769 million in net inflows last week.
As market participants assess the latest bullish indicators, focus now shifts to broader macroeconomic developments, including new trade-related headlines and reports suggesting that the administration of US President Donald Trump may extend the current tariff pause until August 1.
personal opinion:!!!
BTC moves sideways in the trend line, trend line support 108,300
Important price zone to consider :!!!
support zone : 108.300
Sustainable trading to beat the market

How to Trade Smart Money Concepts (SMC)\ How to Trade Smart Money Concepts (SMC)\
\ This article explores the foundation, key tools, and practical insights of Smart Money Concepts — and why it’s worth your attention.\
In today's fast-changing financial landscape, Smart Money Concepts (SMC) has become a popular strategy among modern traders. But what is SMC exactly, and how can it improve your trading decisions? This article breaks it down in a simple, professional way for traders at all levels.
---
\ What Are Smart Money Concepts?\
SMC is a trading approach based on the belief that large institutions ("smart money") like banks and hedge funds control most of the market's movements. These institutions often move the market in ways that confuse or trap retail traders. The goal of SMC is to understand and follow the footsteps of these big players.
Instead of relying on simple patterns or indicators, SMC focuses on:
\ - Market structure\
\ - Supply and demand zones\
\ - Liquidity pools\
By aligning your trades with the behavior of smart money, you can position yourself more strategically in the market.
---
\ Key SMC Concepts Explained\
\ Order Blocks\
Order blocks are zones on the chart where large institutions have placed significant buy or sell orders. These zones often lead to strong price reactions and act as hidden support or resistance levels. Order blocks are considered more precise than traditional supply and demand areas.
Example: ()
\ Fair Value Gap (FVG)\
A Fair Value Gap occurs when price moves sharply in one direction, leaving a gap or imbalance in the price action. These areas often get filled later and can act as magnets for price.
In a bearish move, the FVG is the gap between the low of the previous candle and the high of the next one. In a bullish move, it's the reverse.
Example: ()
\ Timeframe Consideration\
If you can’t monitor charts during the day, avoid relying on 5–30 minute setups. Consider 4H or daily timeframes for clearer signals and more manageable trading decisions.
\ Liquidity\
Liquidity refers to price zones where lots of pending orders exist. These are usually at obvious highs, lows, or trendlines. Smart money often targets these areas to trigger stop-losses and generate movement.
One common tool to identify liquidity is a "pivot point," which is a candle with a lower low or higher high than its neighbors.
Example: ()
\ Break of Structure (BOS)\
BOS occurs when price breaks above or below a previous high or low, signaling a possible trend continuation.
Example: ()
\ Change of Character (ChoCH)\
ChoCH happens when the market changes direction. For example, if price breaks a higher low in an uptrend, it may signal a reversal.
Example: ()
Combined with BOS: ()
---
\ How SMC Compares to Wyckoff\
The idea of "smart money" isn't new. Richard D. Wyckoff, a pioneer in technical analysis, laid the foundation for understanding market cycles driven by institutions. His price cycle theory includes four phases:
\ 1. Accumulation\
Smart money buys while the public is unaware.
\ 2. Markup\
Price rises as smart money pushes the market.
\ 3. Distribution\
Smart money sells into public buying.
\ 4. Markdown\
Price falls as the cycle completes.
SMC borrows from this logic but focuses more on structure and liquidity zones. Still, the core idea is the same: understand what big players are doing, and follow them.
\ For deeper insights into Wyckoff, explore additional resources focused on accumulation/distribution cycles.\
---
\ Summary\
Smart Money Concepts give traders a deeper look into market mechanics. By focusing on order blocks, fair value gaps, liquidity, and structure breaks, SMC helps identify high-probability trade setups based on institutional behavior.
It may seem complex at first, but once you understand the basics, SMC can become a powerful tool in your trading strategy. Whether you’re new or experienced, aligning with smart money can improve your edge in the market.

waiting for new ATH this week , btc💎 BTC PLAN UPDATE FOR THE BEGINNING OF THE WEEK (07/07)
NOTABLE BITCOIN NEWS: Focus on 4 key points today
1. Elon Musk – “America Party” to Support Bitcoin
Elon Musk has confirmed that his newly formed political party, the “America Party,” will support Bitcoin, stating that “fiat is hopeless.”
2. Cup-and-Handle Pattern Analysis: Targeting $230K
According to technical analysis by Cointelegraph, BTC is forming a “cup and handle” pattern on the monthly chart, which could lead to a target peak of $230,000 if a breakout continues.
3. BTC Price Holds Steady Around $109K Amid “Crypto Week” and Trade Tensions
Bitcoin is currently trading around $109,000, influenced by “Crypto Week” and concerns over U.S. tariffs.
4. Institutional Inflows Increase, But Market Demand Weakens
According to CoinDesk, institutional investors are still buying BTC, but not enough to offset declining demand in the spot market, negatively affecting short-term market sentiment.
⸻
TECHNICAL ANALYSIS PERSPECTIVE
The short-term trend remains bullish. However, the steep slope of the trend indicates buying pressure is still being contested and unstable.
BTC remains stuck at Fibonacci levels—pay close attention to the resistance zones at 112K and 115K. If these two resistance levels are broken, investors may get the answer to whether BTC can approach the 120K level.
In the short term, both gold and BTC are moving sideways, indicating that market liquidity and investor capital are unstable and being divided across multiple portfolios.
==> This analysis is for reference only. Wishing all investors successful trading!

Monday - Trade of the day Hello I took a week off from trading — life got a bit hectic 🌀. Looking back, I actually needed that break from the charts 🧠💆♂️.
But we’re back this week! Let’s see how many X’s we can cream off the market 💸🔥
Here are the immediate levels I’m watching 👀 — mainly some range deviations from both internal and external ranges.
If we break either side of the range, I’ll be looking to enter from the last supply or demand zone for a continuation 🚀📉📈
That said, I’ll stay mindful of any supply and demand zones that could get in the way ⚠️📊
Let’s get it 💪📅
BTC Forming Higher Highs & Lows | Watch the Wedge Breakout📈 BTC Forming Higher Highs & Lows | Watch the Wedge Breakout 📉
In the uptrend that started around $100K, Bitcoin is forming higher highs and higher lows on the 4H timeframe, which is in line with Dow Theory. Based on the orange lines I’ve drawn, it seems we are moving inside a rising wedge pattern.
🟠 Key Observations:
Breakout from either side of the wedge can trigger a trade, but I personally won’t enter based solely on the wedge.
If BTC breaks upwards, I’ll hold my existing long, not looking to short — because the mid and long-term trend is still bullish.
📌 New Trigger Level: The previously important level of $110,246.8 is now less relevant for me. The market has already rejected from $109,953.16, so that’s my new key level.
👉 I’ve placed a stop-buy order at $109,953.16 based on the 1H chart.
💣 Short Liquidation Zone (Updated):
Now ranges between $110,640 to $111,320
If you're looking to trade momentum:
RSI above 70 on 4H, or
Above 76.23 on 1H = potential trigger for long entries
👉 I'm planning to open a long position above $109,953.16 using a stop-buy order, with the help of the order book in the exchange.
⚠️ Currently, I don’t have a high-confidence stop-loss level — I’ll update as I see clearer price action.
🧠 Pro Tip:
Do everything you can to catch a BTC long position. If you understand risk management and position sizing, don’t be afraid of stop-losses — they’re part of the game.
If you're unsure what proper risk/money management is, go learn it now, or you will definitely get liquidated someday.
BTC IS ABOUT THE RETEST THE 100.000 RANGE AGAIN BTC is about to break out of a bearish wedge and according to the Fibonacci extension it will test the $100,000 range again! I can also analyze a bearish divergence on 1 hour chart. Good luck folks... What are your ideas on that one?
BTC analyses
Bitcoin has hit its own support level and choke point in the 4-hour timeframe, which could be a signal for further correction.
But dynamic support has held its own.
We will wait until the US market opens.
And enter when we see a break and see a signal.
Note: I am bullish on Bitcoin as long as it is above 183,200.
Bitcoin (BTC): Targeting $120K | Buyers Showing DominanceBitcoin is hovering still in between the old ATH area and the new, entering into a consolidation zone, which might be our breaking point.
Last week we saw the buyside dominance, which was backed by big institutions buy orders and short-term traders selling assets, giving us a sign of a potential bullish breakout—that's what we are looking for, a proper breakout from local resistance, which would then send the price towards our first target of $120K.
Swallow Academy

Are You Really Analyzing Or Just Defending your imagination? You might think you're analyzing every time you open a chart.
But what if you're just looking for reasons to justify a bad trade?
Real analysis is data-based. Justification is emotion-based.
Let’s figure out if you're really trading smart or just lying to yourself.
Hello✌
Spend 3 minutes ⏰ reading this educational material.
🎯 Analytical Insight on Bitcoin:
BINANCE:BTCUSDT is currently testing a strong resistance near the upper boundary of its parallel channel. A breakout to the upside looks likely soon. From this level, I expect at least a 5% gain, with a main target around $114,500. 📈🚀
Now , let's dive into the educational section,
🎯 Analysis or Mental Justification?
Many traders, once they’re in a position, stop looking for truth and start looking for confirmation.
Instead of reading what the chart actually says, they twist every line and indicator to make it look like their trade still makes sense even when it doesn’t.
🛠 TradingView Tools That Kill Self-Deception
TradingView is way more than just a place to slap on some EMAs and MACDs. If used right, it can literally stop you from fooling yourself:
Replay Tool – Use this to backtest without future data bias. It trains your brain to analyze based only on the present moment.
Multi-Timeframe Layouts – View your idea across multiple timeframes. Confirmation bias collapses fast when you see the same chart from different angles.
Volume Profile – This shows where real trading happens, not where you wish it would happen.
Community Scripts & Public Indicators – Looking at someone else's logic helps you catch your own blind spots.
Idea Journal & Posts – Publish your analysis and compare it with what actually happened. You’ll quickly see how often emotion was driving your trade.
😵💫 What Does Justification Even Look Like?
It’s when you’re deep in the red but instead of managing your loss, you draw a new trendline… or add a reversed Fibonacci… or tell yourself, “It’s just a correction.”
That’s not analysis. That’s emotional defense.
💡 Know the Real Difference
Analysis = data-driven, emotion-free.
Justification = emotion-driven, data-twisted.
🔂 Why Do You Keep Making the Same Mistake?
Because your brain loves to feel right even when it's wrong.
Instead of accepting reality, it tries to bend it.
So you dig for signals to support your bad position, not question it.
🧠 The Psychology Behind the Trap
What you’re feeling is cognitive dissonance. Two thoughts fighting in your head:
“This position is failing.”
“I don’t want to be wrong.”
So your brain builds fake reasons to stay in it. Welcome to the mental loop that kills portfolios.
🎯 How To Break the Cycle
Write down why you’re entering any trade before you open it.
Only trade what you can explain, not what you hope.
Decide your stop-loss level before you enter.
If you’re “hoping” for something to turn around, it probably won’t.
🪞Be Brutally Honest With Yourself
The real question isn’t “Can you analyze?”
It’s “Can you admit you were wrong when it matters?”
Every losing trade you hold onto out of ego is a reminder that you chose comfort over skill.
⚠️ What Makes a Pro Trader?
A pro doesn’t just win trades. They cut losses fast.
They don’t “marry” a position just because they drew a trendline.
They survive by respecting truth, not bending it.
🧪 Train Your Brain To See Reality
To break the habit of self-justification, you need to rewire your analysis process. Here's how:
Before analyzing a chart, review your previous trade honestly.
Ask: What made me enter? Strategy or emotion?
Replay the chart with TradingView’s tool. If you didn’t know the future, would you still take that trade?
Answer those questions and you'll start separating real analysis from self-defense.
👁 Look at the Chart Without Bias
If you’re holding a position while analyzing, you’re probably just looking for evidence to stay in.
Try this instead: Pick a timeframe where you have no position, and do a clean analysis.
No hope. No fear. No money on the line.
That’s when real analysis happens.
🔚 Final Note
Real analysis hurts because it forces you to face mistakes. But it's also the path to real consistency.
Next time you open a chart, ask yourself:
“Am I seeking the truth or just a reason to hold on?”
One moment of honesty can change your entire trading journey.
✨ Need a little love!
We put so much love and time into bringing you useful content & your support truly keeps us going. don’t be shy—drop a comment below. We’d love to hear from you! 💛
Big thanks , Mad Whale 🐋
📜Please remember to do your own research before making any investment decisions. Also, don’t forget to check the disclaimer at the bottom of each post for more details.

Bitcoin will Return all-time high Interestingly Bitcoin (BTC) has not been particularly impressive over the weekend, which has been a somewhat consistent theme of the cryptocurrency market so far in the year 2025. The premier cryptocurrency continues to hover around the $108,000 mark, showing signs of indecision amongst the investors.
Resistance zone 111K
Support zone 107K
The conversation has been about when the Bitcoin price will return to its all-time high. Interestingly, the latest on-chain data shows that investors are becoming increasingly confident in the long-term promise of the flagship cryptocurrency.
Hope you can understand all our chart Pattern According the Bitcoin analysis.
Thanks for your Support.
if you found this analysis share you Opinion in comments I'm Tankful from you.

#BTC Update #4 – July 7, 2025🟠 #BTC Update #4 – July 7, 2025
Bitcoin has been trading inside a supply zone , and its last impulsive move happened right into that area. While it tried to push higher again, I now see signs of rejection.
If this rejection holds, the first level I’m watching is $107,850 . Below that, there's a key support around $106,350 . Should this level break, we could see a deeper drop toward $102,650 , where an imbalance zone remains untested.
At the moment, short setups look more reasonable than longs but from a risk/reward perspective, I don’t see enough edge to take action yet. So for now, I’m not entering any position and will simply watch BTC’s next move .

BTC 4HWe are in a week where volatility is expected to increase in BTC. A movement like the one on the screen may occur. Definitely use stops during this period. We are in a period when it is very difficult to analyze the market. We have become a market that moves with a lot of news. The market will surprise investors before the bull comes. Therefore, pay more attention to your stops than ever.
