The Pattern That Could Launch Bitcoin, pt. 2There appears to be an IH&S pattern forming inside of the larger IH&S's right shoulder (see my previous post for the larger one). I've seen this happen a few times and then a break out upwards! Results may vary of course lol.
If it drops from here support could be at around $102k and then $100,500.
BTCDOWNUSDT trade ideas

BTCUSDT short-term analysishi traders
Let's have a look at BTC on 4h time frame.
RSI (14): Currently at 60.40, suggesting mild bullish momentum but not overbought.
RSI Moving Average: Around 50.92, confirming recent upward momentum.
MACD bullish cross suggest more upside in a short term.
Breakout Confirmation: Price has broken above a recent horizontal resistance (near $109,236), now acting as support.
Bullish Continuation Expected
Support & Resistance:
New Support: $109,236
Resistance to Break: Around $111,742
✅ Conclusion:
This is a bullish breakout trade based on horizontal support/resistance, favorable RSI, and a clear RR setup. The trader anticipates a pullback and continuation toward $111.7K, using a tight stop just below the breakout zone to minimize risk.

BTC Smart money Bullish don’t be fooled !**BITCOIN MICROSTRUCTURE ANALYSIS: Institutional Accumulation Through Order Flow Divergence**
The current BTCUSD market structure presents a compelling case study in institutional accumulation mechanics, utilizing sophisticated order flow analysis to identify smart money positioning ahead of retail market participants.
**Technical Infrastructure Analysis**
The convergence of multiple analytical frameworks reveals a coordinated accumulation pattern across various timeframes and exchanges. Volume Profile Analysis on the primary chart indicates substantial institutional interest between $108,000-$110,000, with the Point of Control (POC) establishing a robust foundation for directional bias determination.
**Order Flow Microstructure Dynamics**
The Bitfinex footprint data reveals critical microstructural imbalances that traditional technical analysis often overlooks. The current candle displays a **-4.52 delta** with price resilience at $109,480, indicating aggressive institutional absorption of retail selling pressure. This negative delta combined with price strength represents a classic **Wyckoff accumulation signature** - large participants are utilizing iceberg orders and hidden liquidity pools to build positions without triggering algorithmic momentum systems.
**Smart Money Positioning Mechanics**
Three key indicators confirm institutional accumulation:
1. **Cumulative Volume Delta (CVD) Divergence**: Both spot and perpetual markets showing negative CVD (-95.77K spot, -50.05K perp) while price maintains elevation, indicating off-exchange accumulation through dark pools and cross-trading networks.
1. **Open Interest Expansion**: The increase from 77.89K to 78.75K contracts with minimal funding rate pressure suggests fresh institutional capital rather than retail speculation.
1. **Volume Profile Concentration**: The heatmap reveals 105.85M in trading volume concentrated within the $108K-$110K range, representing systematic accumulation rather than random market activity.
**Institutional Arbitrage Mechanics**
The funding rate dynamics (0.001783 with periodic negative spikes to -0.000753) indicate sophisticated carry trade positioning. Institutions are likely utilizing the negative funding periods to establish leveraged long positions while simultaneously hedging through spot accumulation, creating a self-reinforcing feedback loop.
**Market Microstructure Implications**
This accumulation pattern typically precedes **Phase C markup** in Wyckoff methodology, where institutional players transition from absorption to active price discovery. The thin volume profile above $112,000 suggests minimal resistance once the breakout occurs, creating conditions for rapid price expansion toward the $113,600 target.
**Risk-Adjusted Positioning Strategy**
The confluence of volume profile analysis, order flow dynamics, and institutional positioning indicators supports a high-probability long bias with the following parameters:
- **Entry Zone**: $109,000-$109,200 (current accumulation range)
- **Risk Management**: Stop loss at $108,200 (below institutional POC)
- **Target Sequence**: $110,653 → $112,000 → $113,600
- **Confidence Level**: 90% (upgraded from initial 75% based on footprint confirmation)
**Forward-Looking Market Structure**
The sophisticated nature of this accumulation pattern suggests institutional preparation for a significant directional move. The combination of hidden liquidity absorption, funding rate arbitrage, and volume profile concentration creates optimal conditions for sustained upward momentum once the $110,000 psychological resistance is cleared.
This analysis exemplifies how advanced order flow techniques can provide substantial informational advantages over traditional technical analysis, particularly in identifying institutional positioning ahead of retail market recognition.
*Position sizing should remain within 3-5% of total portfolio allocation, with dynamic risk management protocols adjusted based on evolving market microstructure conditions.*
BTC BEARISH IDEAL HOT BTC bullish ideal, BTC buys where Sensational and i dont expect the sell to be les either me and my whole theam eat let get it with BTC
BITCOINBITCOIN , continues to see in flow of liquidity ,investors confidence is high ,institutional adoption could change the layer of demand and supply and set a new bench mark for trading highs and low trading on intraday.
feels good to see that my correction video came 100% correct, now the confirmation will be if 108.03-107.89k will hold support. This is a classic retest to broken 4hr descending trendline ,if we adopt it ,then we buying into 111k-113k-116k watch it critically.
On a second thought if price adopt the new structure we are selling in 100k-90k and below.
trading is logical probability ,keep that in mind that every key level can be broken, manage your risk, back test on your strategy and make sure you are winning.
there are many ways to win this market without big grammar.
have a blessed new week.

BITCOINBITCOIN , continues to see in flow of liquidity ,investors confidence is high ,institutional adoption could change the layer of demand and supply and set a new bench mark for trading highs and low trading on intraday.
feels good to see that my correction video came 100% correct, now the confirmation will be if 108.03-107.89k will hold support. This is a classic retest to broken 4hr descending trendline ,if we adopt it ,then 111k-113k-116k will be watched.
on a second thought if price adopt the new structure we are selling in 100k-90k and below.
trading is logical probability ,keep that in mind that every key level can be broken, manage your risk, back test on your strategy and make sure you are winning.
there are many ways to win this market without big grammar.
have a blessed new week.

Bitcoin pump back to $110450 todayStop: $108326
50% Tp at $109,550
25% tp at $110,450
Exit at $111,950
DTT Strategy

Down for BitcoinHi traders,
Last week Bitcoin finished the correction down and went up again.
But this does not look like an impulse wave.
At the moment there's a small correction up so we could see another move down.
Let's see what the market does and react.
Trade idea: Wait for a change in orderflow to bearish and a correction up on a lower timeframe to trade shorts.
If you want to learn more about trading FVG's with wave analysis, please make sure to follow me.
This shared post is only my point of view on what could be the next move in this pair based on my analysis.
Don't be emotional, just trade your plan!
Eduwave

$BTC/USDT daily chart $121K next.CRYPTOCAP:BTC just broke out of a descending wedge on the daily chart, a strong bullish signal.
It’s now holding well above key support and the 50-day moving average, showing buyers are in control.
If BTC stays above $106,400, we could see a move toward $121K next.
DYRO, NFA


Possible buy for BTCUSDT Price is approaching our demand zone
Let's keep an eye 👀
If price will respect our zone.
BINANCE:BTCUSD
Sunday blessings


BTCUSDT Possible Move IntradayHello Traders,
BTCUSD we are likely to sweep 30m high then come back to consilidated area before further move, we shall wait and take the decision after proper confirmation.
Thanks, BINANCE:BTCUSDT.P BINANCE:BTCUSDT.P
minters.

BTCUSDT LongsHello Traders,
Though we are at weekend but as far BINANCE:BTCUSDT.P intraday look, 30M charts showing some bullish momentum to 109600 today.
Thanks,
Minters

BTCUSDT: Trend in 2H time frameThe color levels are very accurate levels of support and resistance in different time frames.
A strong move requires a correction to major support and we have to wait for their reaction in these areas.
So, Please pay special attention to the very accurate trend, colored levels, and you must know that SETUP is very sensitive.
BEST,
MT

BITCOINBITCOIN ,we are seeing some liquidity and a break of our 4hr supply roof ,if we return to retest in the same zone 108k-107.99k , we might take long position .first target 111k 113k and 116k.
take profit is key, trading is logical probability. If you dont take profit and secure it, the market will turn back and take both your capital and profit because its probability.

BTC/USDT – Breakout Brewing? Eyes on 110K+ Timeframe: 4H | Exchange: Binance | Date: July 🧠 What’s Happening?
Bitcoin just fired out of a bullish wedge with strong volume and is marching inside a clean rising channel.
All eyes now on the golden Fibonacci zone — and beyond!
🎯 Key Levels
📍 Immediate Resistance:
→ $109,940 – Holding at the 0.5 Fib
→ $110,580 – $111,491: Golden Pocket (0.618–0.786 Fib)
→ $112,652: Full Fib Extension + Channel Top
📍 Support Zone:
→ $108,200 – $107,800: Must hold for bulls
→ Below $107.5K = momentum shift ⚠️
🔍 Technical Signals Lighting Up
✅ Bullish breakout from descending wedge
✅ Strong volume confirms breakout intent
✅ RSI at 57+, trending upward
✅ MACD crossing bullish
✅ Stochastic RSI curling from oversold
✅ ADX increasing – trend gaining strength
🚀 Trade Setup (Idea Only!)
Above $110K = bullish continuation
Next stops: $111.5K – $112.6K
Hold $108K = bullish structure intact
Below $107.5K = reevaluate bias
🧨 Summary:
Bulls have the momentum — but can they punch through the golden zone?
$110K+ is the battleground. Break it, and we’re off to $112K+.
💬 What’s your bias? Bulls or bears? Drop a chart or comment below 👇
🔔 Follow for daily setups & sharp market commentary!

BTC Roadmap to 220KApril 9, 2025 marked a historic shift in the Bitcoin market structure. On that day, institutional giants and sovereign funds aggressively stepped in, buying back BTC in large volumes as price retraced to its previous all-time high (ATH) zone around $69K. This wasn't just a typical dip buy — it was a coordinated accumulation event that triggered the fastest 30-day rally in Bitcoin history, pushing the price above $90K, then $100K, and now consolidating just under $110K.
BTC is currently hovering near $110K — testing it for the fourth time over the past two months. This level has evolved into a major macro flip zone, where previous all-time resistance is attempting to become new long-term support.As of now nee just one ignite candle to break major resistance above 110K then will enter to price discovery zone.
HINT:
The current Bitcoin production cost (mining break-even) sits around $100K due to:
Post-halving mining difficulty
Higher energy costs
Institutional-scale mining operations
This implies miners and institutions need BTC > $100K to remain profitable, aligning them on the same side: supporting price, not dumping.
#BTC #Bitcoin #BTCUSDT #CryptoAnalysis #BitcoinBreakout #PriceDiscovery #InstitutionalBuy #CryptoTradeSetup #BTCMacro #BTCBullRun #CryptoTA #BitcoinHalving #CryptoSupercycle #TradingView

BITCOINBITCOIN ,the structure broke back out of the descending trendline on 4hr ,be patient if it comes for retest go long and hope that 110-111k is broken and target 116k-118k.

TradeCityPro | Bitcoin Daily Analysis #120👋 Welcome to TradeCity Pro!
Let’s dive into the Bitcoin analysis and key crypto indices. As usual, in this analysis I want to review the futures triggers for the New York session.
⏳ 1-Hour Timeframe
In the 1-hour timeframe, as you can see, Bitcoin has finally broken out of the range it formed yesterday and is now moving upward.
✔️ If this upward move continues, we can open a long position in these zones by getting confirmation in the lower timeframes. The main long trigger is still activated after breaking 110256.
💥 The RSI oscillator entered the Overbuy zone in the previous candle. We need to see how the price reacts to this move and what impact this oscillator will have on the price.
⚡️ In my opinion, this RSI move won't have much impact. Although the price is moving upward, the main trend has not yet formed, so there's no real momentum in the market, and RSI is basically useless for now.
✨ If this upward move turns out to be fake, we can enter a short position with the 107853 trigger.
👑 BTC.D Analysis
Let’s look at Bitcoin Dominance. Yesterday, dominance had an upward move and broke its ascending trendline but failed to stabilize above 65.52, resulting in a fake breakout and a move downward.
☘️ The fake breakout trigger for the trendline was the 65.38 zone, which was activated, and now the price is heading downward. If this move continues, the next target will be 65.04.
📅 Total2 Analysis
Alongside Bitcoin’s upward move, this index also activated the 1.14 trigger and is moving up, now reaching 1.15.
💫 If the move continues, the next entry trigger is at 1.17, which is still quite far from the current price.
📅 USDT.D Analysis
Looking at Tether Dominance, the 4.82 trigger was activated, and dominance is now moving down, having reached 4.78.
📈 If it stabilizes below 4.78, we can confirm the continuation of the downtrend in dominance, which could push it down to 4.72.
❌ Disclaimer ❌
Trading futures is highly risky and dangerous. If you're not an expert, these triggers may not be suitable for you. You should first learn risk and capital management. You can also use the educational content from this channel.
Finally, these triggers reflect my personal opinions on price action, and the market may move completely against this analysis. So, do your own research before opening any position.

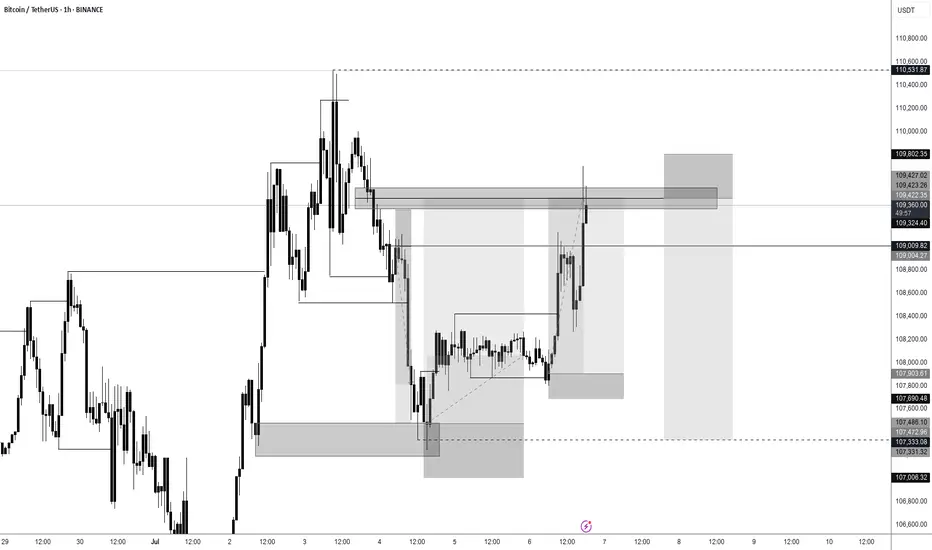
BTC - LONG UPDATEI'm taking profit on the long here, nice weekend pump.
For me low 109s is the inflection point, I rather take profit here and start the week fresh.
See previous BTC post for a more zoomed out version and higher timeframe levels, nothing has changed.

Bitcoin (BTC) 4H Chart – May see new ATH SOON !!Bitcoin is currently moving tightly within a broad symmetrical wedge structure. Despite multiple fakeouts and low-conviction moves, the price has managed to stay range-bound and is holding above key support, a sign of underlying strength.
Chart Structure:
Price has broken out of the downtrend resistance but is yet to confirm momentum.
The structure suggests a larger move is imminent, with bulls gradually gaining control.
Key Levels:
Immediate Resistance: $108,700
Major Resistances Ahead: $111,862 → $116,818 → $122,341
Immediate Support: $105,189
Major Support Below: $97,205
Potential Setup:
A confirmed breakout above $108,700 with volume could initiate a rally toward the next resistance zones.
Bulls must hold the $105,000 area to avoid another deep pullback into the lower structure.
Bias:
Cautiously bullish — market is waiting for a catalyst to trigger follow-through.
Stay patient, and watch for confirmation through price and volume.
DYOR. Not financial advice.

BTC - Are you the one who is long?If yes! Book, Looks like a LIQ hump trap here! Wait for 105k smooth, or let it fall to retrace up to 109,860 to initiate!
