BTCUSDT LongsHello Traders,
Though we are at weekend but as far BINANCE:BTCUSDT.P intraday look, 30M charts showing some bullish momentum to 109600 today.
Thanks,
Minters
BTCDOWNUSDT trade ideas

BTCUSDT: Trend in 2H time frameThe color levels are very accurate levels of support and resistance in different time frames.
A strong move requires a correction to major support and we have to wait for their reaction in these areas.
So, Please pay special attention to the very accurate trend, colored levels, and you must know that SETUP is very sensitive.
BEST,
MT

BITCOINBITCOIN ,we are seeing some liquidity and a break of our 4hr supply roof ,if we return to retest in the same zone 108k-107.99k , we might take long position .first target 111k 113k and 116k.
take profit is key, trading is logical probability. If you dont take profit and secure it, the market will turn back and take both your capital and profit because its probability.

BTC/USDT – Breakout Brewing? Eyes on 110K+ Timeframe: 4H | Exchange: Binance | Date: July 🧠 What’s Happening?
Bitcoin just fired out of a bullish wedge with strong volume and is marching inside a clean rising channel.
All eyes now on the golden Fibonacci zone — and beyond!
🎯 Key Levels
📍 Immediate Resistance:
→ $109,940 – Holding at the 0.5 Fib
→ $110,580 – $111,491: Golden Pocket (0.618–0.786 Fib)
→ $112,652: Full Fib Extension + Channel Top
📍 Support Zone:
→ $108,200 – $107,800: Must hold for bulls
→ Below $107.5K = momentum shift ⚠️
🔍 Technical Signals Lighting Up
✅ Bullish breakout from descending wedge
✅ Strong volume confirms breakout intent
✅ RSI at 57+, trending upward
✅ MACD crossing bullish
✅ Stochastic RSI curling from oversold
✅ ADX increasing – trend gaining strength
🚀 Trade Setup (Idea Only!)
Above $110K = bullish continuation
Next stops: $111.5K – $112.6K
Hold $108K = bullish structure intact
Below $107.5K = reevaluate bias
🧨 Summary:
Bulls have the momentum — but can they punch through the golden zone?
$110K+ is the battleground. Break it, and we’re off to $112K+.
💬 What’s your bias? Bulls or bears? Drop a chart or comment below 👇
🔔 Follow for daily setups & sharp market commentary!

BTC Roadmap to 220KApril 9, 2025 marked a historic shift in the Bitcoin market structure. On that day, institutional giants and sovereign funds aggressively stepped in, buying back BTC in large volumes as price retraced to its previous all-time high (ATH) zone around $69K. This wasn't just a typical dip buy — it was a coordinated accumulation event that triggered the fastest 30-day rally in Bitcoin history, pushing the price above $90K, then $100K, and now consolidating just under $110K.
BTC is currently hovering near $110K — testing it for the fourth time over the past two months. This level has evolved into a major macro flip zone, where previous all-time resistance is attempting to become new long-term support.As of now nee just one ignite candle to break major resistance above 110K then will enter to price discovery zone.
HINT:
The current Bitcoin production cost (mining break-even) sits around $100K due to:
Post-halving mining difficulty
Higher energy costs
Institutional-scale mining operations
This implies miners and institutions need BTC > $100K to remain profitable, aligning them on the same side: supporting price, not dumping.
#BTC #Bitcoin #BTCUSDT #CryptoAnalysis #BitcoinBreakout #PriceDiscovery #InstitutionalBuy #CryptoTradeSetup #BTCMacro #BTCBullRun #CryptoTA #BitcoinHalving #CryptoSupercycle #TradingView

BITCOINBITCOIN ,the structure broke back out of the descending trendline on 4hr ,be patient if it comes for retest go long and hope that 110-111k is broken and target 116k-118k.

TradeCityPro | Bitcoin Daily Analysis #120👋 Welcome to TradeCity Pro!
Let’s dive into the Bitcoin analysis and key crypto indices. As usual, in this analysis I want to review the futures triggers for the New York session.
⏳ 1-Hour Timeframe
In the 1-hour timeframe, as you can see, Bitcoin has finally broken out of the range it formed yesterday and is now moving upward.
✔️ If this upward move continues, we can open a long position in these zones by getting confirmation in the lower timeframes. The main long trigger is still activated after breaking 110256.
💥 The RSI oscillator entered the Overbuy zone in the previous candle. We need to see how the price reacts to this move and what impact this oscillator will have on the price.
⚡️ In my opinion, this RSI move won't have much impact. Although the price is moving upward, the main trend has not yet formed, so there's no real momentum in the market, and RSI is basically useless for now.
✨ If this upward move turns out to be fake, we can enter a short position with the 107853 trigger.
👑 BTC.D Analysis
Let’s look at Bitcoin Dominance. Yesterday, dominance had an upward move and broke its ascending trendline but failed to stabilize above 65.52, resulting in a fake breakout and a move downward.
☘️ The fake breakout trigger for the trendline was the 65.38 zone, which was activated, and now the price is heading downward. If this move continues, the next target will be 65.04.
📅 Total2 Analysis
Alongside Bitcoin’s upward move, this index also activated the 1.14 trigger and is moving up, now reaching 1.15.
💫 If the move continues, the next entry trigger is at 1.17, which is still quite far from the current price.
📅 USDT.D Analysis
Looking at Tether Dominance, the 4.82 trigger was activated, and dominance is now moving down, having reached 4.78.
📈 If it stabilizes below 4.78, we can confirm the continuation of the downtrend in dominance, which could push it down to 4.72.
❌ Disclaimer ❌
Trading futures is highly risky and dangerous. If you're not an expert, these triggers may not be suitable for you. You should first learn risk and capital management. You can also use the educational content from this channel.
Finally, these triggers reflect my personal opinions on price action, and the market may move completely against this analysis. So, do your own research before opening any position.

BTC - LONG UPDATEI'm taking profit on the long here, nice weekend pump.
For me low 109s is the inflection point, I rather take profit here and start the week fresh.
See previous BTC post for a more zoomed out version and higher timeframe levels, nothing has changed.

Bitcoin (BTC) 4H Chart – May see new ATH SOON !!Bitcoin is currently moving tightly within a broad symmetrical wedge structure. Despite multiple fakeouts and low-conviction moves, the price has managed to stay range-bound and is holding above key support, a sign of underlying strength.
Chart Structure:
Price has broken out of the downtrend resistance but is yet to confirm momentum.
The structure suggests a larger move is imminent, with bulls gradually gaining control.
Key Levels:
Immediate Resistance: $108,700
Major Resistances Ahead: $111,862 → $116,818 → $122,341
Immediate Support: $105,189
Major Support Below: $97,205
Potential Setup:
A confirmed breakout above $108,700 with volume could initiate a rally toward the next resistance zones.
Bulls must hold the $105,000 area to avoid another deep pullback into the lower structure.
Bias:
Cautiously bullish — market is waiting for a catalyst to trigger follow-through.
Stay patient, and watch for confirmation through price and volume.
DYOR. Not financial advice.

BTC - Are you the one who is long?If yes! Book, Looks like a LIQ hump trap here! Wait for 105k smooth, or let it fall to retrace up to 109,860 to initiate!

BTC: 650 Point Long Trade To 108,650$ (Date: Sat 05 Jul 25)High potential signal as my all signals. Don't miss this opportunity. At least open a trade in demo just to test.
Details:
Entry: Now - 108,100 $
Target Price: 108,650 $
Stop loss: 107,700 $
Trade Ideas:
There is a flag pattern here after a good down trend. So here is possibility for a small pull back till my target price.
Trade Signal:
I provide trade signals here so follow my account and you can check my previous analysis regarding BITCOIN. So don't miss trade opportunity so follow must.
BINANCE:BTCUSDT BINANCE:BTCUSDT.P BYBIT:BTCUSDT.P

BTC - Bulls Getting Ready!!Hello TradingView Family / Fellow Traders. This is Richard, also known as theSignalyst.
📈BTC has been bullish trading within the flat rising wedge marked in blue and it is currently retesting the lower bound of the wedge.
Moreover, the orange zone is a strong demand.
🏹 Thus, the highlighted blue circle is a strong area to look for buy setups as it is the intersection of demand and lower blue trendline acting as a non-horizontal support.
📚 As per my trading style:
As #BTC approaches the blue circle zone, I will be looking for bullish reversal setups (like a double bottom pattern, trendline break , and so on...)
📚 Always follow your trading plan regarding entry, risk management, and trade management.
Good luck!
All Strategies Are Good; If Managed Properly!
~Rich

BTC - Channel is Broken, Now What?
We are currently retesting the upper trend line of the channel I gave in this analysis, the most bullish scenario is that it breaks upwards and BTC stages a determined rally. If you cannot catch an entry during this rally, do not worry, we can retest the upper part of the trend again or go to manipulation areas such as green bubbles.

BitcoinHello everyone, I have a opinion about bitcoin chart I analyzed bitcoin chart at monthly timeframe and it obviously related to Elliot waves and I combined it with price action and I extract some good information about Price Road of bitcoin so in my opinion bitcoin going to decrease and I show that on chart how bitcoin price will be behave.
Have a good trade

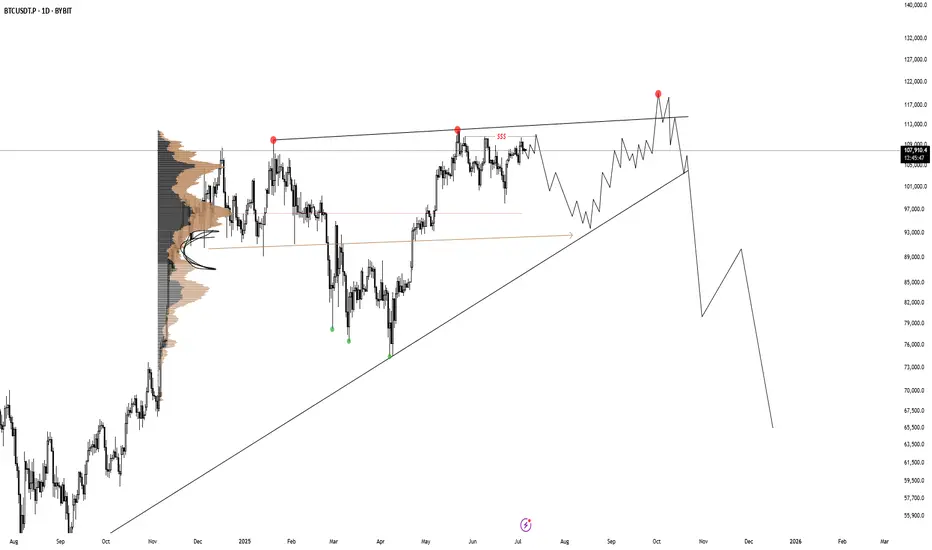
BTC HTF Distribution V2This is still the main scenario I'm looking for until it's invalidated. A build up like this, followed by a fake breakout out of this rising wedge as 3rd tap would be perfect.
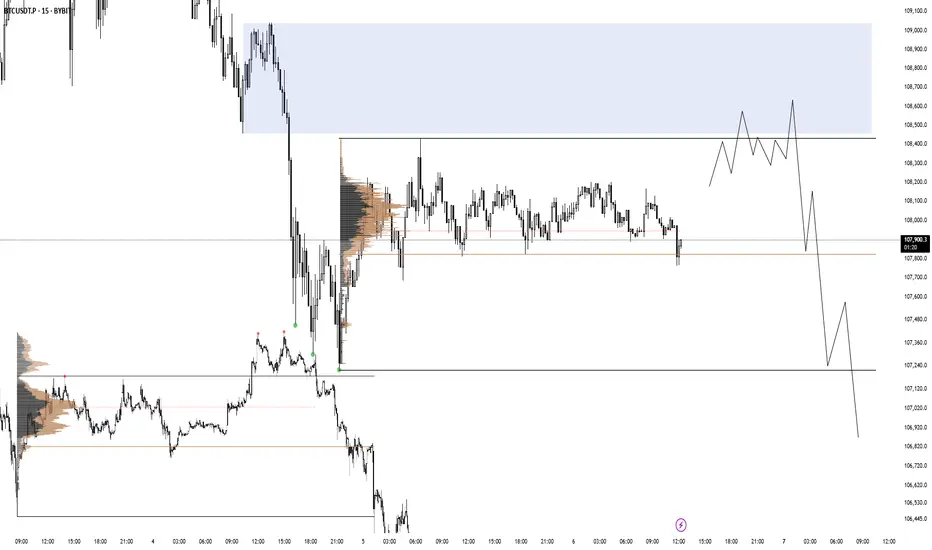
BTC 06.07.25There is a range imbalance with no price action in discount after BTC accumulated on friday afternoon. I am looking for a valid distribution like in the picture on the left.
BTC/USDT.P ShortMy Trade Thesis & Rationale:
Here is my thinking on this short setup. I believe this is a high-confluence opportunity where the price action aligns perfectly with what I'm seeing in the underlying market dynamics.
1. The Big Picture (Daily/4H Context):
Price is currently operating at a major historical resistance zone ($110k+). This level has acted as a "ceiling" multiple times, making it a high-probability area for sellers to step in.
I've noticed that momentum on the 4-hour chart has clearly stalled, which to me signals buyer exhaustion after the last run-up.
2. The Tactical Setup (1H/15M Price Action):
After stalling at the highs, the price formed a clear distribution range on the 1-hour chart—a sign that sellers were likely absorbing the remaining buying pressure.
✅ THE TRIGGER: My entry is based on a decisive, high-volume breakdown below the key support of this range at $107,300. This breakdown was followed by what I see as a weak, low-volume retest, confirming buyer weakness and offering a prime entry.
3. My Logic:
🎯 TARGET: I've set my take profit at $106,800 because it's located within a dense pool of long liquidations. I believe these levels often act as a strong magnet for price.
❌ INVALIDATION: My stop loss at $107,550 is placed just above the broken structure. If the price reclaims this level, my bearish breakdown thesis would be proven wrong, and it's my signal to get out.

bitcoin long trade setup ALL trading ideas have entry point + stop loss + take profit + Risk level.
hello Traders, here is the full analysis for this pair, let me know in the comment section below if you have any questions, the entry will be taken only if all rules of the strategies will be satisfied. I suggest you keep this pair on your watchlist and see if the rules of your strategy are satisfied. Please also refer to the Important Risk Notice linked below.
Disclaimer

BTCUSDTIt seems that the price of $110,000 is a strong resistance for Bitcoin, and as long as the price is below $110,000, its trend is bearish, and we can consider the targets of $107,000 and $105,000 for it.

"Bitcoin to $110,000? Here's What the Charts Are Saying!"📈 Is Bitcoin Going to $110,000?
In this video, we analyze Bitcoin’s current price action and key resistance levels to understand whether BTC is gearing up for a breakout to $110K. Using technical indicators, market sentiment, and on-chain data, we break it down in simple terms so anyone can follow.

Bullish?This range looks like it wants to break to the upside. Maybe one more drop to 107.6K as a fakeout — but that remains to be seen.

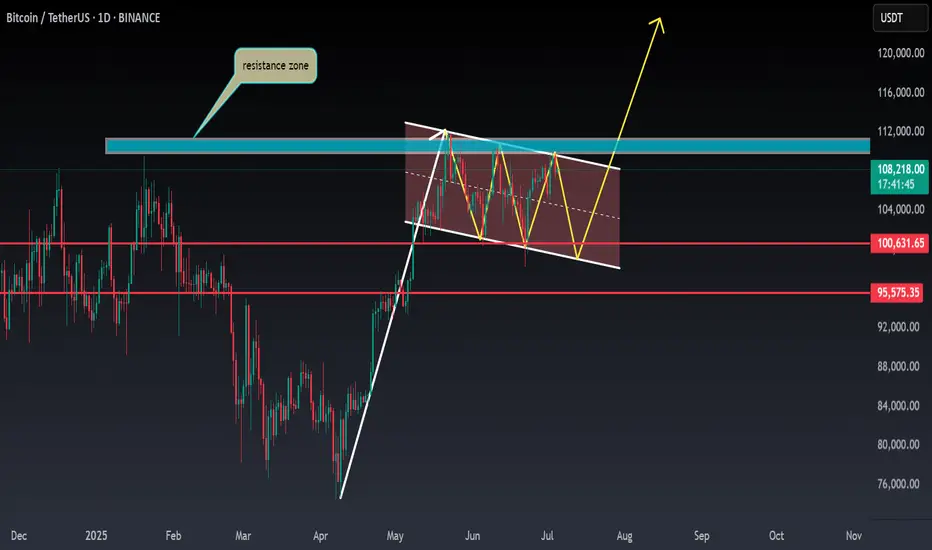
BTC ANALYSIS🌸#BTC Analysis : Bullish Trend 🚀🚀
🚀As we can see that there is a formation of Flag & Pole Pattern in #BTC in daily time frame. Right now we can see that #BTC again retest from the resistance zone and we can see a bounce back from its support zone 💪
🔖 Current Price: $1,08,050
⏳ Target Price: $1,20,000
⁉️ What to do?
- We can trade according to the #BTC chart and make some profits. Keep your eyes on chart price action, observe trading volume. Always observe market sentiments and update yourself everyday.🔰🔰
#BTC #Cryptocurrency #Breakout #TechnicalAnalysis #DYOR
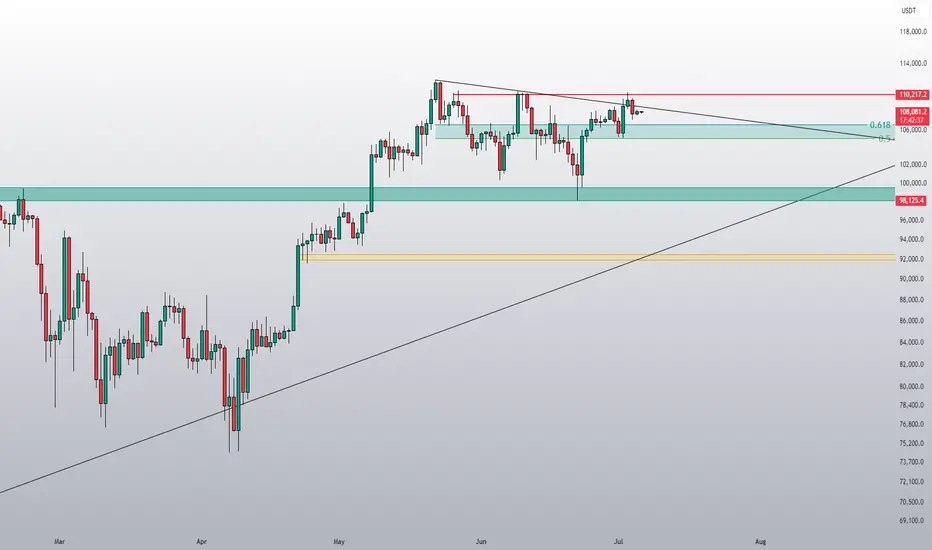
The calm before the stormBTC has been rejected at resistance for now, which was to be expected. More importantly, the price is currently trading above the golden pocket of the overall correction. This suggests the correction might be over and that we could eventually break to new ATHs.