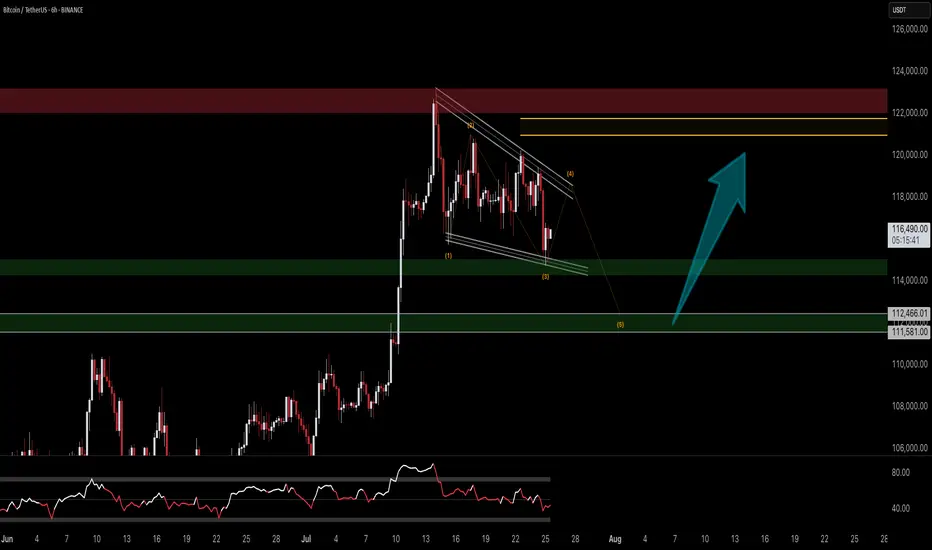
BTC NEW VOLUME TREND 122KThis is a small time frame update, where BTC can try to target 22K again in the coming time frames. Since the last 15H breakdown volume, BTC can enter new uptrend volume
From the box level, there is a good chance for a new uptrend.
BTCDOWNUSDT trade ideas

Btcusd outlook
Price tapped into our area and showed strong reaction.
Now watching how it behaves around 118.4k and 120.7k.
If bulls stay in control, 122k could be next.
Let’s see how it unfolds. 🔍📈

BTC Retested and Ready for the Next Leg Up?This CRYPTOCAP:BTC weekly chart shows a clean pattern of breakout → retest → rally.
The 50 EMA has been acting like a strong dynamic support throughout the uptrend, keeping the structure intact. Every time price broke out of a consolidation or resistance zone, it came back, retested it, and then continued moving higher.
Most recently, BTC broke above a key resistance, pulled back to retest it, and now it looks like the breakout has held. This is a classic bullish continuation setup, and historically, it’s led to strong follow-through moves.
As long as BTC stays above the 50 EMA and holds support, the bullish structure remains intact.
Thanks for reading! Stay sharp and trade safe.

I’m just trying my luck with this and it doesn’t look too great The only only way way I could find find out if they they are are in in a a little little while I was was if if I could get them them in in a a week week and and I I could could find find a couple couple days days in the next month month or two two days days and and I I can can I have have them them out out in a a week and and I have a lot more time
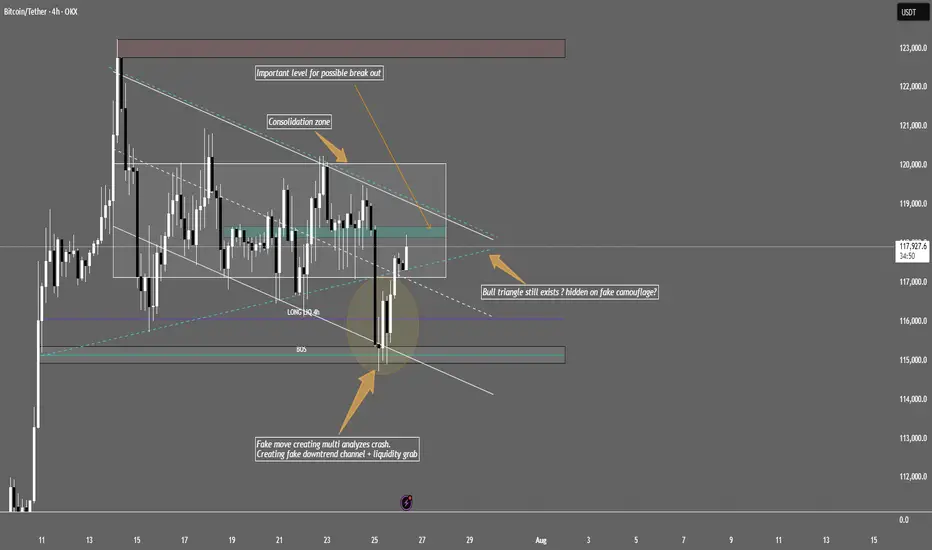
BTC/USDT Bull triangle still exists ? Hidden on fake camouflage?Bitcoin is moving sideways in a tight consolidation range between $117,000–$120,000 . Institutional players are accumulating positions here based on recent on-chain whale inflows, positive funding, and OI increase.
Key points with real chart zones:
The big drop down was likely a "fake out": Price wicked down to ~$115,000, triggering stop losses below this support, letting smart money buy cheaper.
Strong bounce back:
After the sweep, price quickly reclaimed the range, returning above ~$117,300–$118,000 , indicating strong buyer presence.
Bullish triangle is still valid:
Structure holds as long as price trades inside/bounces between $117,000 (lower zone/fake-out base) and $120,000 (upper resistance/consolidation top). Watch for volume spikes around $118,000–$120,000 as signs of institutional accumulation or breakout intent.
If price breaks above the range:
If we see a proper H1/H4 close above $120,000, expect a strong move to the next resistance: $123,000–$124,000 zone.
If price breaks down and holds below:
Sustained price action below $117,000, especially after another fake-out, could lead to a drop toward previous demand/stop zones at $115,000, and if that fails, further down to $110,000–$113,000.
Bottom line:
BTC sits in a “make-or-break” zone between $117,000–$120,000. Break out above $120k opens the path to $124k+. Loss of $117k/115k support risks further downside. Order flow and on-chain favor bulls for now, but always use stops – low volatility ranges can quickly resolve with liquidity grabs.
Tip:
Don’t chase every breakout or drop. Watch closely how price reacts near $120,000 (upside) and $117,000/$115,000 (downside). It is crucial to follow macroeconomic news, especially FED updates – trade safely and always do your own research!
This is not financial advice!
BTC/USDT 5H – Demand Zone Bounce Targeting $123KBTC/USDT 5H Analysis:
Price is consolidating above a demand zone ($121,031), with a final target around $123,280.


Potential head and shoulders pattern appears on Bitcoin’s globalHey everyone!
I've been on TradingView for a while, but this is my first post — so go easy on me 😄
I'll keep it short and straight to the point.
---
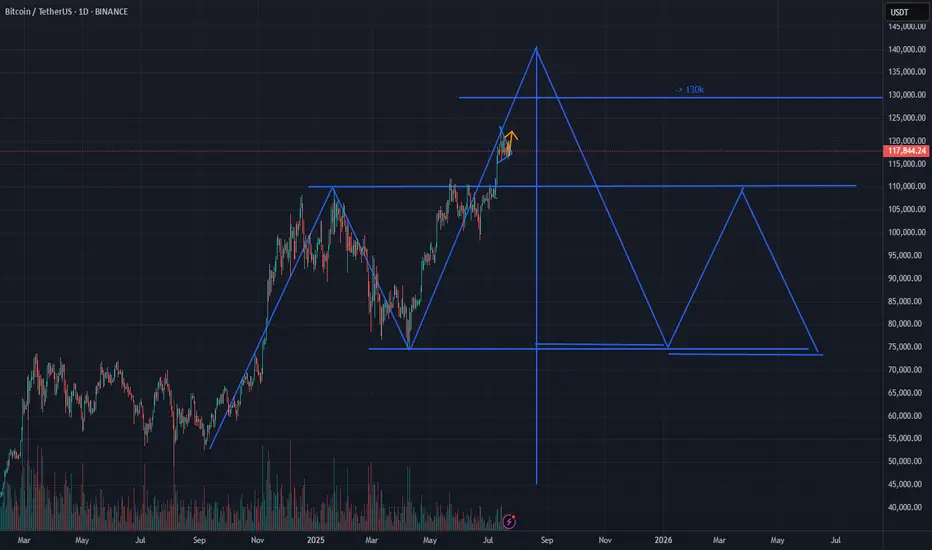
A head and shoulders pattern is forming on the global Bitcoin chart
The pattern is not yet fully formed, and it is difficult to draw any conclusions, but what has already formed may indicate the implementation of this pattern, which we may see in the near future, which means that an upward movement is possible, before the head is formed
Current price: $118k
With this pattern, there is a low probability of a price breakout to $103.4k
The head of the pattern may be at $124k or $129k, provided there is no strong positive news background from the US government regarding Bitcoin
This analysis is based on the technical pattern and also incorporates AI to provide more accurate results.
---
I'd be happy to hear your thoughts, feedback, or any constructive criticism in the comments!
HolderStat┆BTCUSD consolidatedBINANCE:BTCUSDT is consolidating between $129K and $137K. Breakout above $137K could lead to new highs. Key support remains at $125K.

targetRemember, day trading is risky and most traders lose money. You should never trade with money you can’t afford to lose. Prove profitability in a simulator before trading with real money.
❗❗My results are not typical. We do not track the typical results of past or current customers. As a provider of trading tools and educational courses, we do not have access to the personal trading accounts or brokerage statements of our customers. As a result, we have no reason to believe our customers perform better or

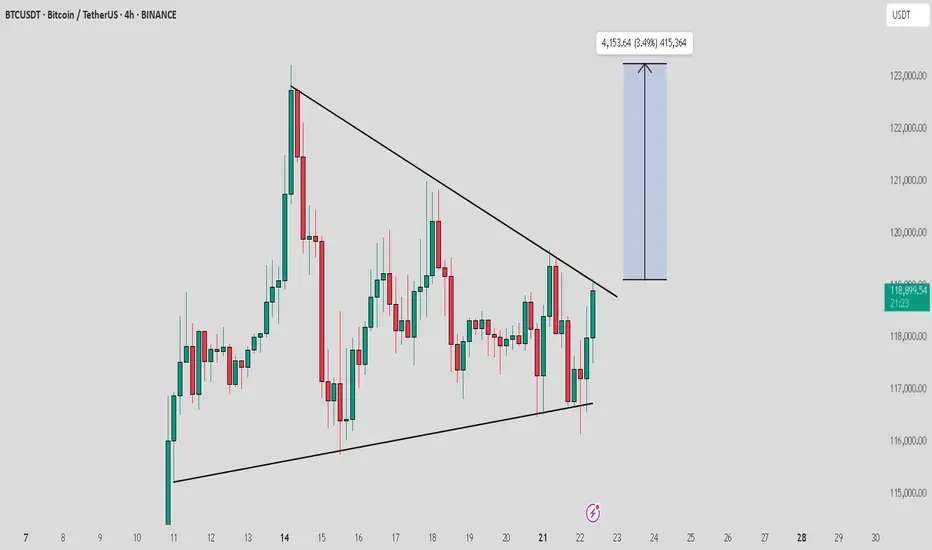
BTC / USDT near to breakout from trendline resistanceBTC is testing its trendline resistance after a steady buildup. A successful breakout could trigger a strong move toward the $122,000–$125,000 range. Worth watching closely in the coming sessions.
BTC- New ATH?BTCUSDT – Potential Reversal from CME Gap Support
Bitcoin is currently trading around a key demand zone aligned with a CME gap between ~$115,272 and $114,000. Price recently swept local lows with increased volatility and is showing signs of absorption just above the 0.382 Fibonacci retracement ($113,660), which adds confluence to the area.
If BTC continues to hold above this zone and shows volume confirmation, I expect a strong bullish reaction. This move could initiate a rally toward the previous high and potentially lead to a breakout to new all-time highs (ATH), as outlined in the red projected path.
Key levels- LQ, Fibbo 0.382, CME gap - futures

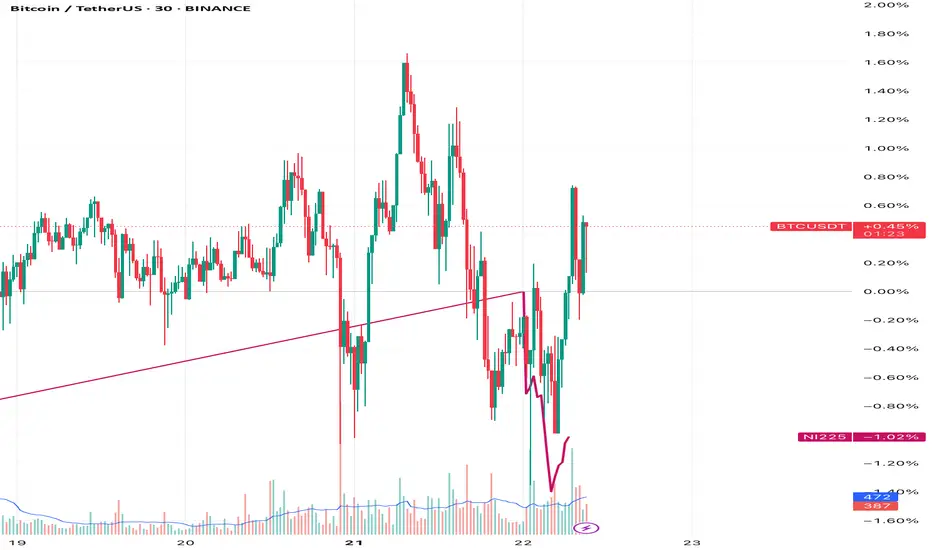
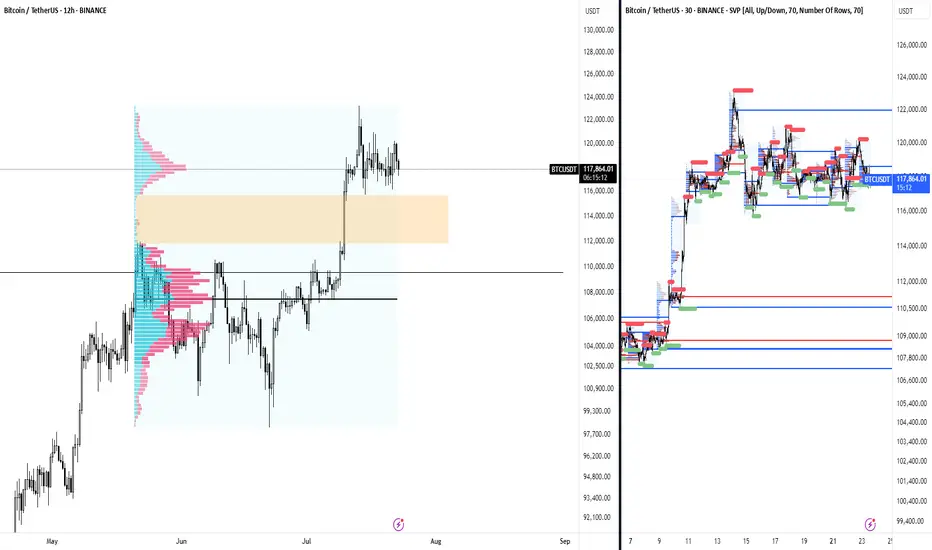
BTC update - July 25 2025After hitting 123,000 zone, Bitcoin has started a downward correction. For the past ten days BTC was mainly showing sideways movement until it crossed below the important support zone of 115,000.
As shown on BTC's chart (on the left), we can expect BTC to continue dropping towards 113,000 zone where there's a midterm trendline and also a fib level. Whether weak or strong, an upward reaction is expected when BTC reaches down there.
BTC CME chart (on the right) also shows there is an unfilled gap located in the 114,380 - 115,635 zone which is most probably going to get filled soon. please note that at the moment BTC CME futures price is about 1,000 dollars more than that of BTC so it is probably safe to assume that 114,000 level on CME Futures chart is equivalent to 113,000 level on BTC's chart.

Short-term BITCOIN analysisShor-term
In my opinion, Bitcoin could make a move towards $113,000-115,000 and then start moving upwards. In any case, according to previous analysis and apart from short-term fluctuations, it could touch the target of $140,000-150,000.
Good luck
NEoWave Chart

Bitcoin - August 25This technical analysis is for informational and educational purposes only. It does not constitute financial advice. Remember to always research and consult with a professional before making investment decisions. Good luck! 📈💼🚀
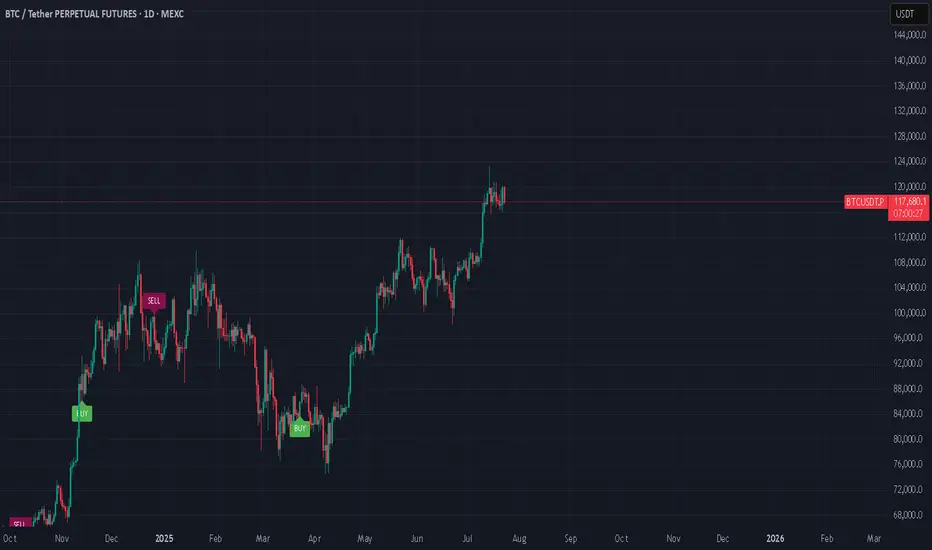
BTC possible failed range breakout - Aggressive Move The BTC ATH rally began post cash close and had very thin volume on the break out before setting this range on the higher time frames. Normally, a range after ATHs are made I would be extremely bullish and I am.
Aside from the failed breakouts at the highs, the attempts paired with nuances such as the crypto week impulses, the day of signing GENIUS and new regulatory acts being drafted now, the attempts to break those ATHs were nudged off.
Sometimes come failed moves come fast moves, and so I have to be prepared that BTC will trade between these thin areas on the volume profile from 111k to 115k. 113k being the most noticeable node in the entire profile.
Similar to my analysis on the break to ATHs, I would expect this move to be aggressive and remind us of a 2020 cycle style flush in Altcoins. Kind of already seeing it with the performance of alts today preempting the failed move up on BTC at range highs.
I will NOT be shorting anything in crypto, these are just areas that I am heavily interested in buying. Currently flat perps and will wait for BTC to make its mind up.
BTCUSD NEW OUTLOOKBTCUSD market Continuously running in both sides from last couple of days now market will be touch the support zone you have to great chance to go long from
SOPPORT ZONE if you want
TRADE AT YOUR OWN RISK
REGARD ALBERT

Tariffs incoming...July 23: Markets are booming.
August 1st: Tariffs.
I'm just saying, it might be a nice discount...
#market #finance #tariff #trump #crypto #forex #stocks #economy #trading
demand and supply strategybuy opportunity setup on BTC
the buyers are taking control in the market and i believe its making a way for a buy opportunity
apply risk management and be safe

Guys. Thoughts?Just having a conversation with a trading jedi master and then they taught them to set a buy stop with heavy risk above the lower high at the top of the market cycle in the sell side of a previously resolved block after exceeding the statistical high of the dealers range for the day. Just for some more insight, this all happened while venus was in retrograde. Hopefully that paints a clear enough picture. Don't hesitate to ask questions.
Signing off, yours faithfully,
ChartCharmer.

BITCOIN's Situation (1h) !!!The price is within an ascending triangle, which could be encouraging. However, since crypto doesn't always follow patterns, it might break down from below and correct to around $115K!
Best regards CobraVanguard.💚

Bitcoin - Up trend go on Bitcoin - Up trend go on
as we mentioned before our long plan from range low is go on
soon that weoul be a time to close it by parts

Bitcoin Bearish Outlook | Rejection from Key Resistance – TargetBitcoin has recently tested a strong structural resistance zone and showed clear signs of rejection, marked by bearish candlestick formations and declining bullish momentum.
This reaction suggests a potential short-term correction, especially as price begins to move away from the resistance with increased bearish pressure.
The next area of interest lies around the Fair Value Gap (FVG) formed in the range of [insert your FVG zone, which could act as a magnetic target for price in the coming sessions.
Should the price continue its downward move and break below minor support levels, this FVG zone becomes a probable destination.
