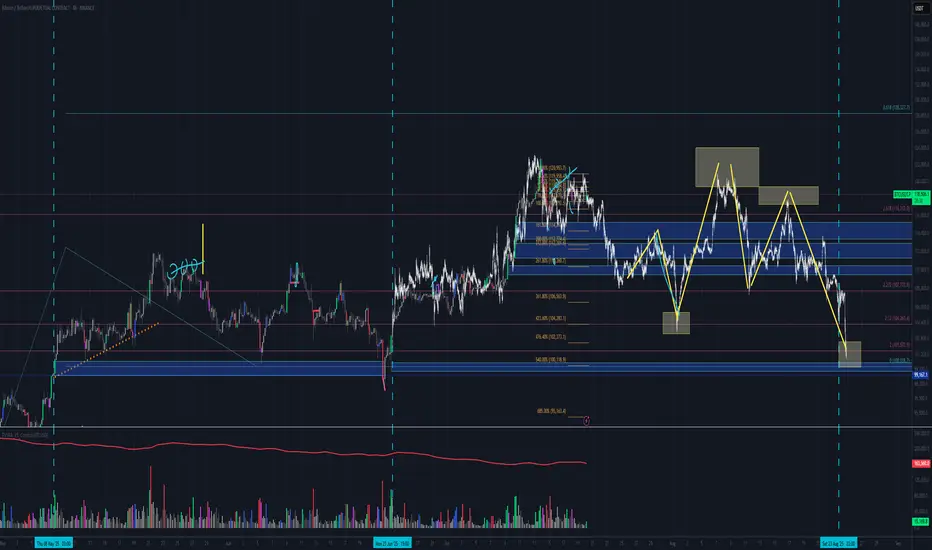
BTC - Trap, Tap, and Blast Off!BTC has been overall bullish, trading within the rising blue channel (1). After reaching a local high, it entered a short-term correction, forming a falling red channel (2).
👀All eyes are now on the key demand zone (3), which aligns with the lower bound of both the red channel and the rising blue structure.
🔎As long as this confluence holds, we anticipate a potential bullish impulse in August.
A retest of the $111,500–$112,000 zone could serve as the trigger for the next leg toward $128,000. Let’s see if BTC is gearing up for another breakout or if a deeper correction is in play.
🔔 Disclaimer: This analysis is for educational and informational purposes only. It does not constitute financial advice or a recommendation to buy or sell any asset. Always do your own research and manage your risk accordingly.
📚 Always follow your trading plan => including entry, risk management, and trade execution.
Good luck!
All strategies are good, if managed properly.
~ Richard Nasr
BTCDOWNUSDT trade ideas

Pattern detection bitcoinusing hourly btc analysis we can breakdown this move and its time cycles
pvsra volume threshold breaks indicating price instability allows us to break down these moves starting point
present
past pattern repeating
barpattern-overlay
BTCUSD BUY PLAN FROM 4H DEMAND ZONEBTCUSD BUY PLAN FROM 4H DEMAND ZONE
Hence the trend is bullish we can plan for buys from demand zone.

BTCUSDT Smart Zone Entry + Take Profit MapThe BTCUSDT chart on both the 1H and 4H timeframes shows a clear consolidation above a high-timeframe support zone with early signs of bullish continuation. This setup outlines a well-defined "Buy Zone," backed by recent demand re-tests, with Take Profit (TP) levels mapped out based on prior highs and price inefficiencies.
Buy Zone (Demand Zone):
The shaded area on the 1H/4H chart marks a critical support zone between ~$117,800 and $119,300. This range aligns with past consolidation, a 4H EMA cluster, and prior bullish reactions. Entries within this zone offer a high reward-to-risk setup.
Support Level:
$117,800, the base of the demand zone, is the final line of support. A clean break and close below this level would invalidate the current long bias.
Take Profit Levels (TPs):
TP1 (~$122,000): Previous local resistance and recent high.
TP2 (~$123,300): Upper wick high and liquidity zone.
TP3 (~$124,500): Untapped zone from early July, likely liquidity pool.
Supporting Indicators:
RSI: Recovering from mid-range, showing hidden bullish divergence on lower timeframes.
QQE MOD: Flipping from bearish to bullish momentum.
ATR: Declining volatility post-drop indicates possible accumulation before breakout.
After a sharp pullback, BTC is stabilizing above a demand zone and forming a potential base. As long as price remains above ~$117,800, there's confluence for a continuation higher, with the outlined TP levels offering natural exit points for partial or full profits.

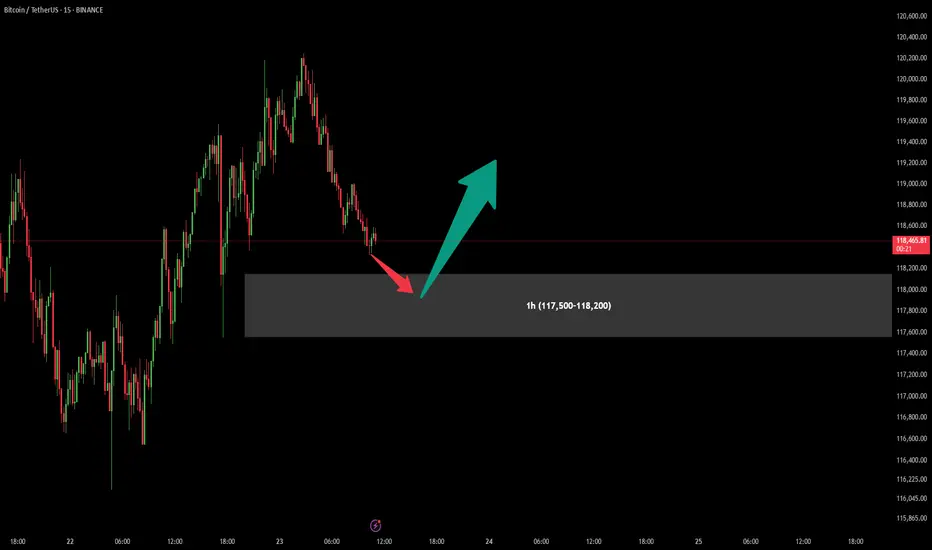
BitCoin BUY OfferAfter previous signal which have given us a good profit (more than 1:10 Risk to Reward), There is another chance for one more Buy position in specified are (117,500-118,200).
Attention : In my chart areas Stop Loss would be under the area (Over the area in Sell positions) and first Take Profit sets for at least R:R = 1:1
Let's see what will happen...
A slight pullback to around 112,000 is expected before a bullishThere is a double top on the daily timeframe. It could pull back to the previous support level that I mentioned in the chart. Moreover, there is a healthy trendline support that can help BTC price bounce.

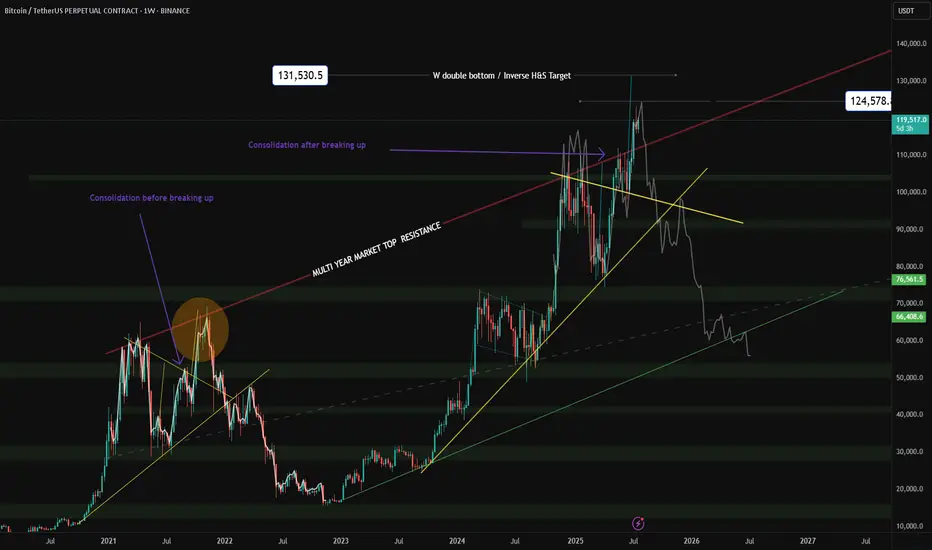
Bitcoin · $137,000 Next Target Followed by $155,000There won't be a correction for Bitcoin. Not now, not yet. The reasons why I already explained in several earlier publications that predicted the current scenario. The bullish breakout that is from the long-term consolidation range. That's the reason, that's the reason why Bitcoin will not go lower without first going higher.
Since Bitcoin consolidated for 7 months below $110,000, it will continue climbing until it reaches higher.
The next target is $137,000. At this point a correction can develop and if it does, we don't expect this correction to last long. The correction can be strong, deep, surprising, but it cannot be long in duration. That is because Bitcoin is headed toward $155,000 and that's the main level for this bullish wave. Until this target is achieved, nothing can stop the future of finance, Bitcoin is moving ahead.
The proof is in the altcoins market. "The altcoins follow Bitcoin." In the current situation, Bitcoin is consolidating while the altcoins grow. If Bitcoin were to crash, the altcoins wouldn't move one dollar higher. In fact, they would be crashing even stronger and faster.
Bitcoin would need to just falter for one day for the altcoins to crash to new lows. What is happening now? Bitcoin can shake; Bitcoin drops; Bitcoin consolidates, and the altcoins continue to grow. That's the proof that the next main—major—move is an advance for Bitcoin. Never SHORT Bitcoin when the market is bullish and strong.
Bitcoin is a growing phenomenon, it is very young. Just think of the US Dollar or Gold. How old are these instruments? How old are market securities and stocks? Some corporations are hundreds of years old. Countries? Thousands of years and still living... Bitcoin can have a life span of 80 years, 140 years, 200 years, 500... who knows. It is a question market. But there is no doubt that it is young. When you are young, you cannot stop your own growth. Bitcoin is already growing and will continue to do so. I will not be surprised when I see Bitcoin trading at $1,000,000+. It might take several years, but several years back Bitcoin was trading at $5k. What's the price now?
$120,000. Trading near resistance is bullish. No corrections. No drops. No retrace.
Thank you for reading.
Namaste.

This time it's not different. Still The same macro structure. This time it's not different. we are in the last phase of the bull market cycle.
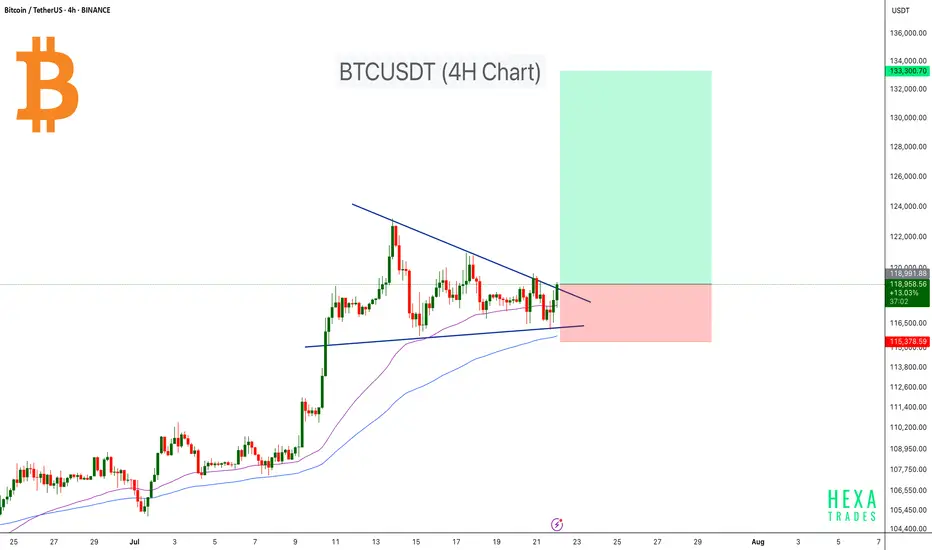
Bitcoin Ready for the Next Leg Higher!Bitcoin is currently consolidating within a symmetrical triangle on the 4-hour timeframe, showing signs of a potential breakout. After a strong rally earlier in July, BTC has entered a compression phase, forming lower highs and higher lows — a classic setup for a volatility breakout.
Price is moving near the apex of the triangle, suggesting that a decisive move is imminent. The 50 EMA and 100 EMA are both acting as dynamic support, helping bulls maintain control of the structure. A breakout above the descending trendline could initiate a sharp move toward the $130K–$133K target zone.
Cheers
Hexa
BINANCE:BTCUSDT
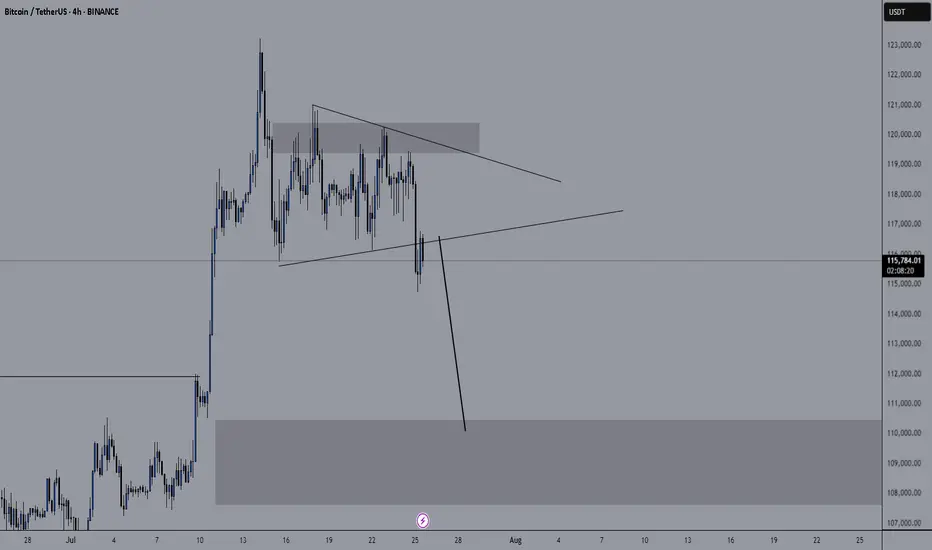
Consider a sales transaction.Hello friends
You can open a sell trade on the 4-hour time frame, but this is a risky trade.
You can open a trade with half a percent risk.
On the higher time frame, the trend is still up.
BTCUSDT It’s coming soon in 2 or 4 weeksRegardless of the positive comments coming from various media and news, the market flow is already moving as it has been set.
After 2 to 4 weeks, a strong and rapid crash comes.
Nasdaq and S&P also fall together.
GOOD LUCK!!
The stock market is highly volatile. Please be very careful with your investments.

BTCUSDT: Trend in daily time frameThe color levels are very accurate levels of support and resistance in different time frames.
A strong move requires a correction to major support and we have to wait for their reaction in these areas.
So, Please pay special attention to the very accurate trend, colored levels, and you must know that SETUP is very sensitive.
BEST,
MT


Crypto Market: What You MUST Know Today!⚠️ Crypto Market: What You MUST Know Today!
📌 Risk Management is 🔑
As we said yesterday, in a market like this, risk management, break-even planning, and timely profit-taking are essential. Every position should come with a clear and structured plan.
📰 Major Fundamental Updates
🔻 Bitcoin has dropped below $117,000 today.
👉 Main reason: Profit-taking after recent gains.
💸 Over $131 million has been withdrawn from Bitcoin ETFs in recent days, adding selling pressure to the market.
🎤 Jerome Powell is scheduled to speak today. The market is nervous he might hint that interest rates will stay high. Investors are on hold.
⚖️ Key crypto regulation bills in the US are facing setbacks. Legal uncertainty is keeping investors cautious.
💰 Capital is rotating from BTC into altcoins. Solana is up 🚀, while Ethereum and Ripple are slightly down.
📉 Technical indicators like RSI and MACD show overbought conditions. The market is correcting now, and the uptrend is weakening.
🏛️ A crypto policy report from the White House is expected today. Many are waiting for clarity before taking big steps.
📊 US inflation remains high → The Fed is unlikely to cut rates soon. Crypto markets need looser monetary policy to thrive.
💥 A large number of leveraged long positions are concentrated around $115,000. If BTC falls further, liquidations may cause additional selling pressure.
♦️ BTC Technical View
The weekly chart shows both buying and selling pressure.
Strong buy wicks indicate active buyers around the $114K–$116K zone.
If price breaks below this level sharply, expect a deeper drop.
If the price approaches this zone slowly, buyers (both takers and makers) may step in to defend it — potentially triggering the next leg up.
⚠️ Important Note
❌ No short positions in our strategy.
Even if price drops, our plan is: “No problem, we missed it 😄”
Our approach = No shorting at these levels. Stay disciplined. 💪
♦️ BTC Dominance (BTC.D)
📉 After a sharp drop, a bounce to 62.15–63.63 is possible.
Once this correction completes, we’ll watch for altcoins that are still ranging and getting ready to break out.
📈 If BTC starts printing green candles with rising volume:
➡️ Focus on altcoins in your watchlist near breakout levels.
📌 Two Main Scenarios:
• ✅ BTC breaks $120K and dominance drops → Early signs of altseason
• ❌ BTC drops and dominance rises → Altcoins likely to drop further
♦️ USDT Dominance (USDT.D)
🔁 Yesterday’s session didn’t break above 4.14 → No bullish confirmation for BTC or alts yet.
📈 If 4.26 breaks upward → Expect more correction across the market.
📉 If 4.14 breaks downward → We may stay in our positions with more confidence.
✅ What to Watch For Today
📊 Jerome Powell’s speech
📰 White House crypto policy report
📉 USDT.D movement at 4.14 / 4.26
🔍 BTC price action near the $114K–$116K zone
🚀 Altcoins approaching breakout levels
🚀 If you found this helpful:
👉 Tap the rocket to support
🔔 Follow for clear, no-hype market updates
💬 Drop your thoughts in the comments!

BTC AI Prediction Dashboard - 6h Price Path (22.07.25)
Prediction made using Crypticorn AI Prediction Dashboard
Link in bio
BTCUSDT Forecast:
Crypticorn AI Prediction Dashboard Projects 6h Price Path (Forward-Only)
Forecast timestamp: ~10:15 UTC
Timeframe: 15m
Prediction horizon: 6 hours
Model output:
Central estimate (blue line): -118,624
Represents the AI’s best estimate of BTC’s near-term price direction.
80% confidence band (light blue): 118,260 – 118,867
The light blue zone marks the 80% confidence range — the most likely area for price to close
40% confidence band (dark blue): 117,702 – 119,570
The dark blue zone shows the narrower 40% confidence range, where price is expected to stay with higher concentration
Volume on signal bar: 120.84
This chart shows a short-term Bitcoin price forecast using AI-generated confidence zones.
Candlesticks reflect actual BTC/USDT price action in 15-minute intervals.
This helps visualize expected volatility and potential price zones in the short term.

Game Over. Bear market incomingYou can hate all you want. Historically I'm right. Bull run ends in July.
Save this and come back to it.

Bitcoin New ATH? A Classic Setup for ExpansionWe've just witnessed a textbook price action sequence unfold. After a period of what I've marked as 'accumulation' (that red box), where price consolidated, we saw exactly what we were looking for: the 'liquidity' below that range (the grey box) has been swept. That yellow bar clearly indicates the 'manipulation' phase, pushing below the perceived support to trap early longs and trigger stop-losses. This move has successfully taken out the easily accessible liquidity.
Now, with that essential 'clean-up' complete and the order books likely reset, the path of least resistance appears to be upwards. Furthermore, if you look down at the RSI, it's currently sitting in a relatively oversold or at least low position, providing additional confluence for a potential bullish move.
My current thesis is that we are now primed for an 'expansion' phase (the green box). The target here, based on this setup, is a retest of the All-Time Highs (ATH) and potentially beyond. We've seen this pattern play out before: accumulation, a liquidity grab/manipulation phase, and then a strong push higher. As always, manage your risk, but the charts are certainly hinting at significant upside potential from here.

Is it time for BTC big reverse?According to oscillators and volumes, we can expect BTC to soon undergo a significant correction:
- RSI peaks are declining, forming a divergence. A divergence is also observed on the weekly timeframe.
- MACD also shows a divergence.
- Falling volumes amid rising prices.
Horizontal lines mark two levels with minimum volumes in the profile. Such volume drops usually characterize support levels, which can be used as targets for shorting.

BTC # 15-minute BTC/USDT chart This 15-minute BTC/USDT chart shows a key breakout structure:
Ascending trendline (red) supported price before a breakout.
Horizontal line marks a previous resistance turned support post-breakout.
Vertical red line represents the breakout height.
50% retracement level of the breakout move is highlighted — a critical area for potential price reaction.
Price is currently pulling back after a recent high near $120,400, trading around $119,059, nearing the breakout support zone.
This setup suggests a possible bullish retest scenario if support holds near the 50% level
thanking you

Teach me to fish, don’t hand me the catch.
---
🎯 **“Teach me to fish, don’t hand me the catch.”**
That’s the mantra behind what we do.
We’re not here to hand you quick wins—we’re here to equip you with the tools, mindset, and precision to master the art of **technical analysis**.
📚 **Follow Us** as we unlock proven strategies, crafted through years of experience and sharpened by real market conditions.
💼 **What You'll Get:**
- High-performance analysis techniques
- Visual case studies from our **actual trades**
- Clear examples from the insurance sector and beyond
- A blueprint to recognize and seize winning setups with confidence
💥 Whether you're new or seasoned, this isn't textbook theory.
This is **applied strategy**, built for clarity and verified by results.
---

BTC CAN HIT 125K AFTER SHORT CORRECTIONHello friends, Bitcoin has made an incredible climb, carefully looking at the chart and also based on Elliott wave theory, it is clear that Bitcoin is completing submicro wave 4 of micro wave 5, wave 4 is usually an extended wave that covers a large time period with up and down fluctuations, I think the end of submicro wave 4 will be in the 110k-112k range in the four-hour timeframe. I think Bitcoin will break the 25k range in the coming days.

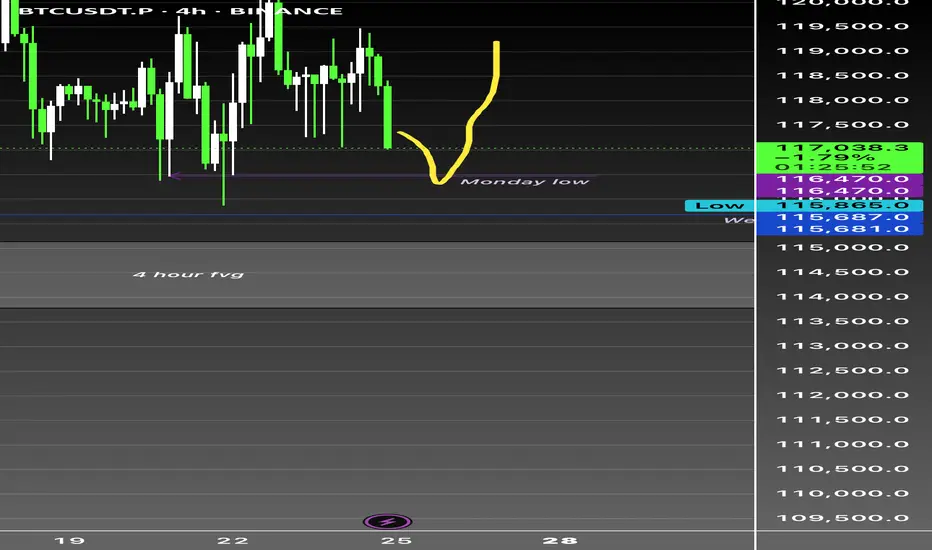
Btc bullish as long as weekly holds CRYPTOCAP:BTC 4H Analysis - Current: $117,150 (-0.97%)
Range-bound between $115,687 week low and $120K+ resistance. Monday low at $116,500 serving as immediate support - critical inflection point.
4H Fair Value Gap clearly defined - institutional liquidity zone demanding respect. Market structure showing inducement above $120K highs with potential liquidity sweep of Monday lows to trigger directional move.
Order blocks forming around $116.5K-$117K zone. Break below $116,500 targets $115,687. Reclaim of $118,500 needed for bullish continuation.
Higher timeframes remain constructive despite 4H consolidation.
#Bitcoin #BTC #SMC