Bitcoin Trading Update: Consolidation, Patterns, and What's NextHey Fellow Traders! 👋
Bitcoin (BTC) has been on a wild ride after hitting its all-time high (ATH)! 📈 Since then, it’s been consolidating, generating liquidity, and setting the stage for the next big move. Meanwhile, altcoins are absolutely booming, stealing the spotlight! 💥 As we kick off the week, let’s dive into what’s happening with BTC and what to watch for.
📊 Technical Analysis Breakdown
Here’s what I’m seeing on the charts:
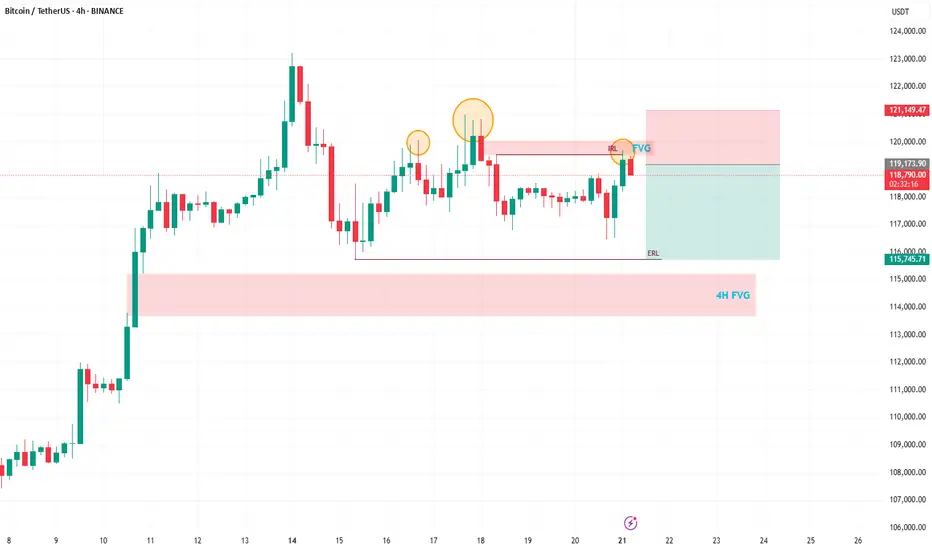
Head and Shoulders Pattern: A clear head and shoulders has formed on BTC, signaling a potential bearish move. 🐻
Daily Timeframe Order Blocks: These are in play, showing key levels of support and resistance.
Filled Fair Value Gap (FVG): A recent FVG on the daily chart has been filled, but there’s still a beautiful 4H FVG waiting to be tested below.
Liquidity Sweep: After the ATH, BTC needs to clear the liquidity from the past few days before it can push for new highs.
🔍 What’s Next for BTC?
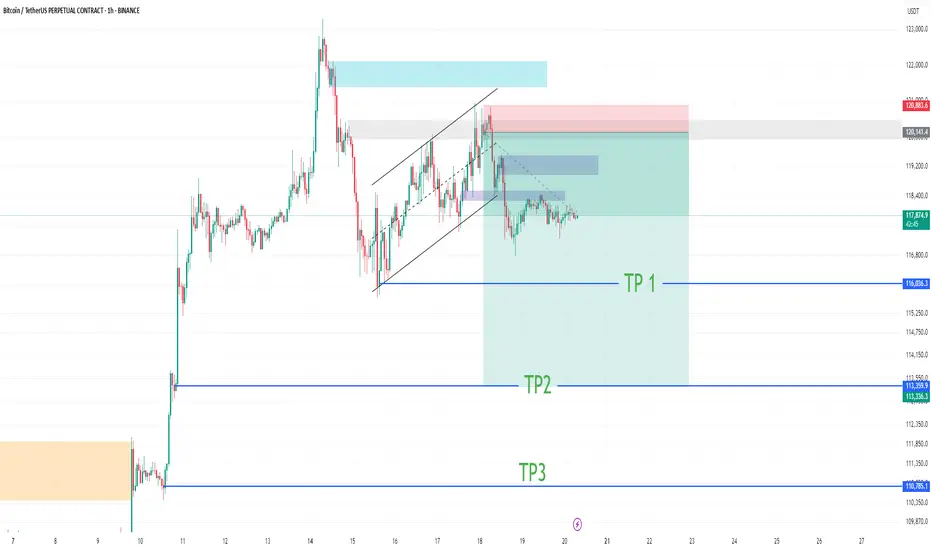
I’m expecting a bearish reaction in the near term, with BTC targeting the sell-side liquidity around $115,800. This move should also fill the 4H FVG, setting the stage for a potential bounce and another shot at the ATH. 🚪 Keep an eye on these levels, as they’ll be critical for the next big move!
🔔 Stay in the Loop!
Let’s keep the conversation going! 💬 Follow for more updates, like if you found this helpful, and drop a comment with your thoughts or what you’re seeing in the markets. Are you trading BTC or riding the altcoin wave? Let’s hear it! 👇
Happy trading, and let’s make this week count! 💪
#Crypto #Bitcoin #Trading #TechnicalAnalysis
BTCDOWNUSDT trade ideas
Unmasking the 5-0 Harmonic Pattern
---
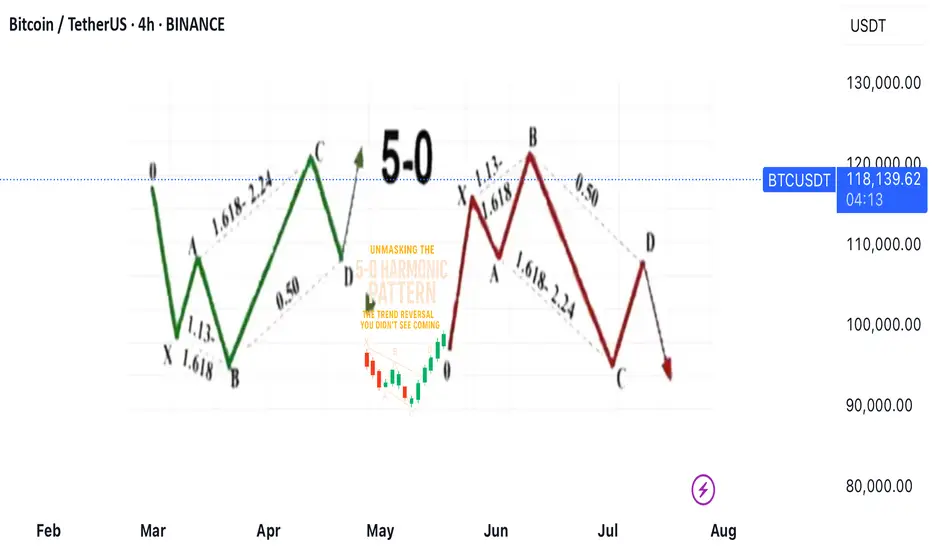
🎯 **Unmasking the 5-0 Harmonic Pattern: The Trend Reversal You Didn't See Coming**
Discovered by the visionary Scott Carney and unveiled in _Harmonic Trading, Volume Two_, the **5-0 pattern** isn't just another blip on a trader’s radar—it’s a siren of market reversal.
📈 **Why It Stands Out**
- Unlike the familiar Bat or Gartley structures, the 5-0 pattern is fueled by **precise Fibonacci ratios**, making its reversal zone deadly accurate.
- Centered around the pivotal **Point B**, this model doesn’t just hint at change—it defines it.
🌀 **The Anatomy of a Flip**
- Often marking the **first true pullback in a major trend reversal**, the 5-0 isn’t a lagging indicator—it’s your early warning system.
- The **AB leg?** That’s no ordinary wave—it’s usually the final gasp of a fading trend, setting the stage for powerful new momentum.
💥 **Bottom Line**
This isn’t just technical analysis—it’s strategic foresight. The 5-0 pattern reveals where the market **hesitates... and where you strike**.
---
_"To truly learn, we must see it in action.
So let’s pull back the curtain and share a powerful example from our **past insurance market trades**—a deal that blended precision, timing, and strategy.
In comments
It's an Evacuation Through Green Candles💥 "One Last Leap of Faith?" - What Bitcoin Might Be Hiding Before September
The world’s on fire: Israel, Iran, Strait of Hormuz, oil, elections, the dollar, rates, black swan whispers.
And someone’s out here saying Bitcoin might still go up?
Yes. We are. Not because we believe - but because we see.
📉 Everyone’s afraid. The whales aren’t.
When the crowd goes into survival mode, the real game begins.
Whales aren’t exiting - they’re accumulating.
ETFs aren’t pausing - they’re inflowing.
The technical setup isn’t breaking - it’s compressing like a spring.
$104,000. Coil building.
If we break out - targets at $132K–$140K are absolutely in play.
👉 But that’s not the point.
The point is why this is happening while the world is burning.
🧠 The idea: Bitcoin isn’t a safe haven. It’s a distribution machine.
Gold is for panic.
Bitcoin is for structure.
Institutions don’t ask “is it scary?” - they ask “where’s liquidity?”
Everything is aligning for one last upside move.
Until September. After that - chaos is back on the table.
💣 The Global Playbook:
Now (Summer) - Consolidation, ETF flows, geopolitical fear - Strategic entries, low exposure
Breakout - FOMO panic, retail rushes in - Profit-taking via options
September–Fall - Macro/geopolitical shock - Already in cash or hedged
📌 Bottom Line
Yes, Bitcoin might pump. Not because the world is fine - but because someone needs to exit beautifully.
If you're reading this - you're early enough to think.
Markets don’t reward justice. They reward positioning.
🛠 What to do right now:
Watch the $104,000 level - it's the pivot
Breakout = final upside push to $132K–140K
Keep your eyes on September - reversal zone
Think in scenarios: entry, exit, protection
Follow EXCAVO - we don’t guess, we read the game
I've been talking about this scenario for a long time


BTC Consolidates Below 119,300 Over the Weekend💎 BTC WEEKEND PLAN UPDATE (26/07)
NOTABLE BTC NEWS
The cryptocurrency market is attempting to stabilize after a wave of sell-offs during Friday’s Asian session, when Bitcoin (BTC) dropped to an intraday low of $114,723. A recovery trend is gradually strengthening, with BTC trading at $115,868 at the time of writing, indicating that buying interest at lower levels may increase in upcoming sessions.
TECHNICAL ANALYSIS PERSPECTIVE
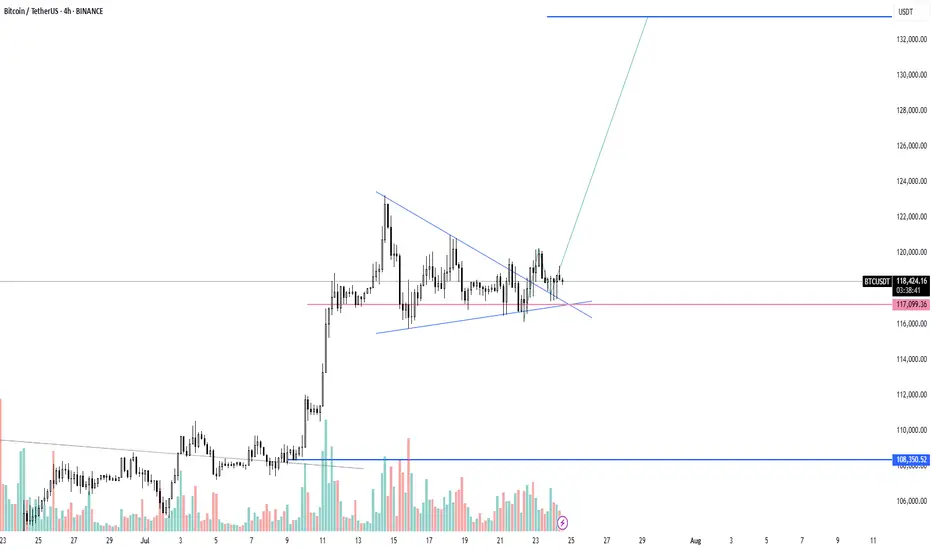
Symmetrical Triangle Pattern
BTC is currently fluctuating within a symmetrical triangle pattern, with converging upper and lower trendlines. This pattern typically signals a strong consolidation phase before a decisive breakout.
Scenario unfolded as planned:
• The price failed to break the resistance zone around $120,000 (previously forecasted as a likely failed breakout zone).
• BTC then dropped sharply to the support zone around $115,000, touching the lower trendline and the potential breakout zone.
• At this level, the price rebounded as expected, indicating strong buying pressure at support.
MA lines supporting the trend:
• The price is currently moving around the 200-day MA (red line), showing that the dynamic support is working effectively.
• The 50-day MA (yellow line) is acting as short-term resistance. If broken, it could support the recovery momentum.
Two potential upcoming scenarios:
🔼 If BTC breaks above the $119,500 – $120,000 zone with strong volume, it may continue to test higher levels around $123,000 – $125,000.
🔽 Conversely, if it faces strong rejection around $119K and turns downward, BTC may retest the support zone at $114,000 – $115,000 once again.
Stay tuned to the channel for the latest and continuous updates on XAUUSD, CURRENCIES, and BTC.

$BTC Macro UpdateBitcoin Macro Outlook BINANCE:BTCUSDT.P
Weekly
Bias & momentum remain bullish. Price is pressing toward new ATHs despite last week’s pullback.
Next macro target: ~$133,550 (extension of the current DeCode V-Range: 111,959.5 – 77,111.0).
A weekly close back inside that range (<111,968.0) = Failed Auction → serious red flag for reversal.
Daily
Clean rejection off the 21-Day Rolling VWAP + bounce at the structural HL V-Level (116,862.4).
A strong bullish engulfing today would set the tone for follow-through this week.
10-Hour
Structure is still bullish. Multiple Failed Auctions from ~116,960.0 are driving price toward the ATH.
Intraday
Choppy and hugging range lows → harder read. That behavior near balance edges triggers AMT Rule #5: “If time/volume builds at the edge of balance, price is likely to push through.”
Auction Market Theory – Quick Reminders
Price : advertises opportunity
Time : regulates opportunity
Volume : tells you if the auction is succeeding or failing
Rule #5 (above) is in play right now. Stay patient, wait for confirmation, and don’t FOMO.

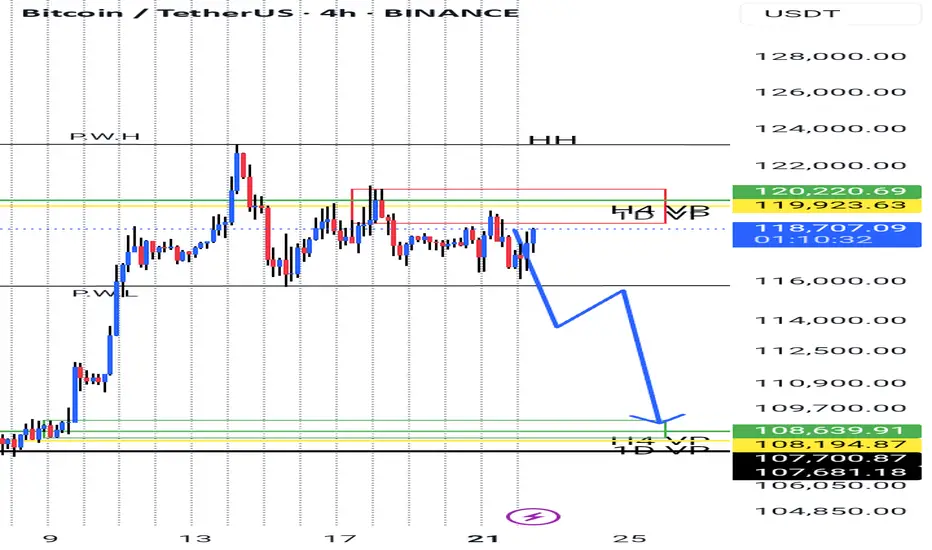
EXPECTATION THAT BTC WILL FALL IS VERY HIGHThe area im looking to sell BINANCE:BTCUSDT.P from is a very strong resistance that would be very difficult for mr BITCOIN to pass through, so therefore, im expecting BTC to reject from there and fall to the down side. Sell BTC

The combination of the Leo New Moon and the Gann Square support Astrologically, we have two important events, the first is the new moon in Leo, which will cause a new movement in the market and give new life to the market. The second is the opposition of the Sun and Pluto, which caused a power struggle between buyers and sellers and at some point there were several stop hunts, but now it seems that the price above 118 thousand is stabilizing and could start a new rally upwards.

BTCUSDTBTCUSDT needs some more correction before we continue the same trend.
Disclosure: We are part of a Trade Nation's influencer program and receive a monthly fee for using their Tradingview charts in our analysis.
[SeoVereign] BITCOIN BULLISH Outlook – July 26, 2025The previous idea did touch the average TP price, but showed a rather disappointing rebound, so I will once again attempt to capture the starting point of the rebound. It is still considered that one more upward wave remains.
Accordingly, the TP is suggested at 118,057 USDT.
As always, I will carefully observe how the chart develops over time and update this idea with further explanations by organically integrating its specific interpretations and underlying rationale.
Thank you.

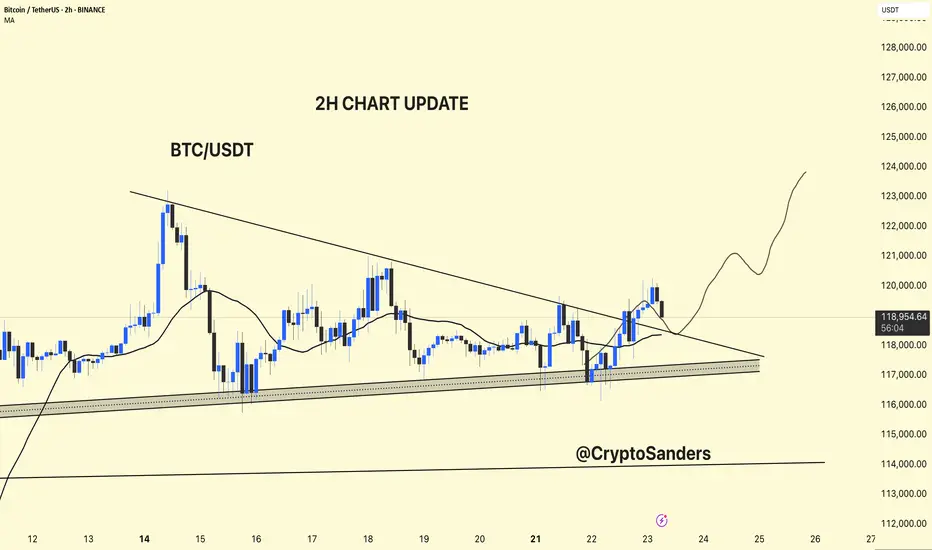
BTC/USDT – 2H Chart Update!!BTC/USDT – 2H Chart Update
Breakout Confirmed:
BTC has broken above the descending trendline but is currently facing resistance at around $ 119,500.
Support Zone:
Strong ascending support between $ 117,000 and $ 118,000 remains intact.
Moving Average:
Price is currently testing the 2H MA (~$118.3). Holding above this could confirm bullish continuation.
Outlook:
If BTC holds above $ 118,000, a move toward $ 123,000–$ 125,000 is likely.
Failure to hold may retest $117K support.
Bias: Short-term bullish unless price breaks below ascending trendline.
Thanks for your support!
DYOR. NFA
Bitcoin Wave Analysis – 22 July 2025
- Bitcoin reversed from support level 116065.00
- Likely to rise to resistance level 122775.00
Bitcoin cryptocurrency recently reversed up from the key support level 116065.00, which also stopped the earlier minor correction 2 at the start of June.
The support level 116065.00 was further strengthened by the support trendline of the daily up channel from June and the 38.2% Fibonacci correction of the upward impulse from July.
Given the strong daily uptrend, Bitcoin cryptocurrency can be expected to rise further to the next resistance level 122775.00 (which stopped the previous impulse wave 1).

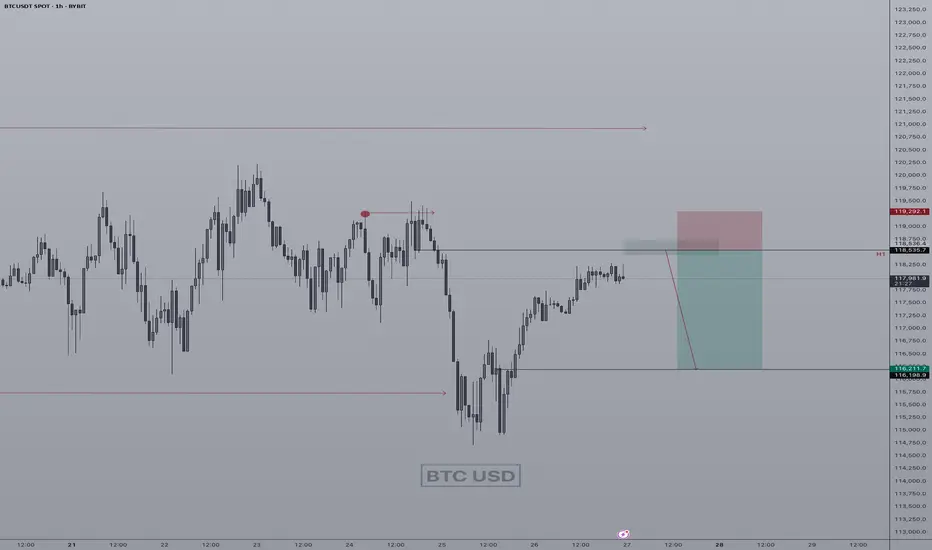
BTC - LTF Breakout? Here is an update to our last post:
After monitoring for a breakout we are seeing early signs of just that.
We saw a rejection from yesterday's test but this morning have broken above our white dotted line with the first breakout candle. Now with this 4H candle we could be seeing the confirmation breakout. After wicking down the bulls have pushed price back up where the candle is holding support above the white dotted trendline.
Technically this current 4H candle would be considered a bearish candle, but due to the circumstances it could easily be negated.
If price does fall in the next 4H period and we do not see another close above the white dotted line, then this would be considered a fakeout and we would most likely see much lower prices. However, what we want to see is price push above this current candles 4H high which would negate the bearish candle and most likely start the rally towards our yellow line target.

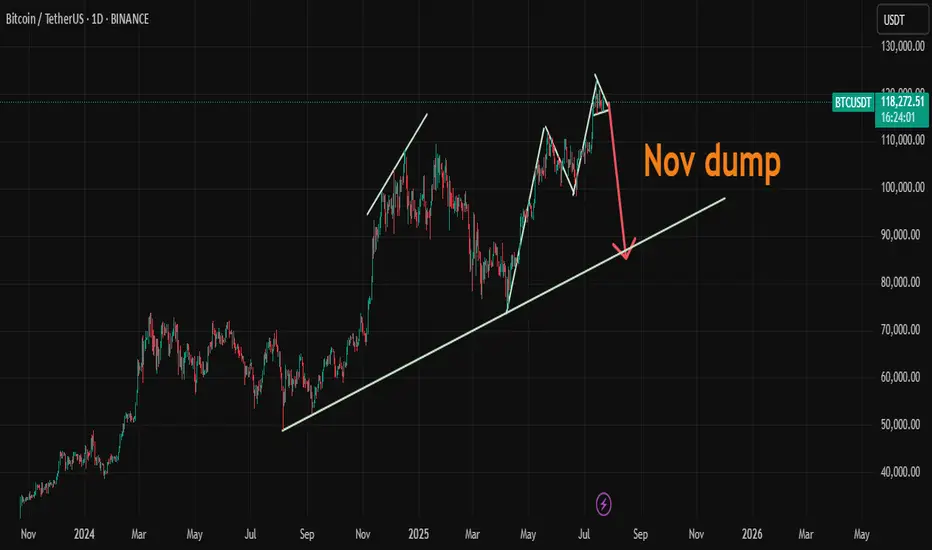
BTC/USDTHello friends, I hope you are well. We should probably expect a slight increase in Bitcoin after the big drop in the financial market, which will most likely start in November. What is your opinion?
BTC - LTF Pattern IdentifiedIn our previous posts we were outlining the levels for a potential BTC pullback, but after some price development in this region it may be signaling a different story.
Since our high of $123k we have been forming a downwards sloping trendline of sell pressure (dotted white line). At the same time we have seen bulls continue to buy up the dips in our green box.
This has put price in some sort of symmetrical triangle that is currently testing the upper resistance level for a breakout.
If this breakout is successful then the first target would be $122.8k followed by a potential extended move up to around $130k.
If price fails to breakout and we drop below the LTF accumulation zone then the lower levels outline in the previous posts are still valid. For now monitor for a breakout to the upside.

BTC SELL SHORT IDEA H1quick momentum short,to create weekly low manipulation for any masjor move, right now focus is on the sell move, following sub struture ltf trend pull back
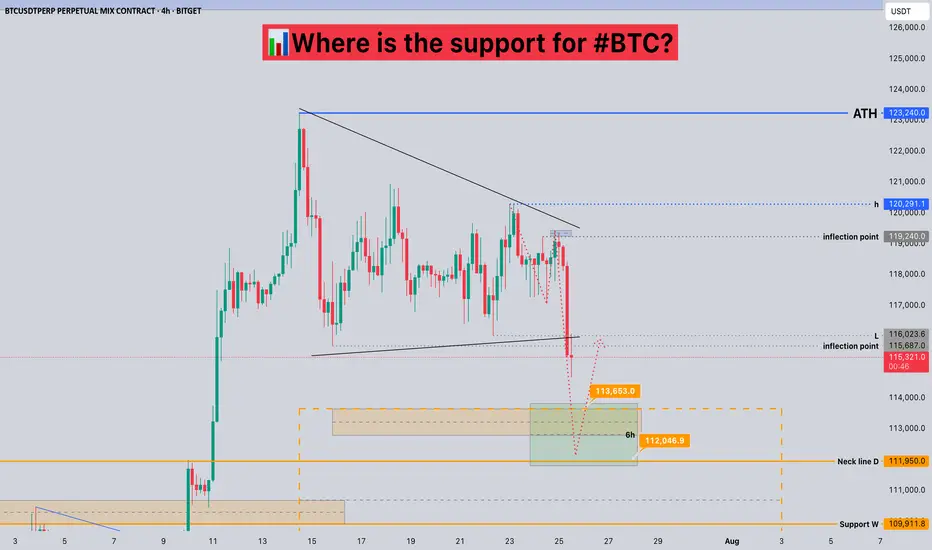
Where is the support for #BTC?📊Where is the support for #BTC?
🧠From a structural perspective, we did not stabilize after breaking through the inflection point of 119240, but broke down quickly. According to the current structure, the short-term support area is 112000-113700.
➡️From a morphological perspective, we failed to successfully break through the h point, but chose to break down, so we need to be vigilant about further pullbacks!
🤜If you like my analysis, please like 💖 and share 💬
BITGET:BTCUSDT.P
BTC - shake out!BTC Correction 📉
After observing the recent price action, it now seems clear that the inevitable correction is taking the stage.
I revisited the chart and drew potential bullish trendlines for a bull pennant on the 12h timeframe, but even those appear to be breaking down, confirming that we're currently experiencing a clear shakeout/correction.
I'm now expecting at least a full fill of the CME gap, and potentially even a drop toward $112,000.
Keep in mind that the CME price often lags behind spot prices on other exchanges, so in order to properly fill the gap down to $114,000 , a dip toward the $112,000 zone remains a very realistic scenario.
Take note that a lot of new retail investors are coming in recently by all the sounds of a ‘’possible altseason’’ around the corner, especially during the summer holidays when they have more time on their hands to look deeper into this.
all this in combination with a lot of long positions around and beneath the price range of 114k and 116k I expect a shake out and liquidity grab.
The only bullish short-term possibility that remains would be if this turns out to be a massive fakeout from the pennant structure, but I find that unlikely.
Personally, I’m watching for signs of a bottom sometime next week before looking for new upward momentum.
The BTC.D began a dive towards 60%, still: BTC remains dominant, which strongly impacts altcoins.
That’s why I’m currently staying cautious and holding off on entering new trades till we see clear support.
Let’s reach the summit together!
📝 Note
I'm currently building a portfolio of crypto analyses here on TradingView. Your feedback, tips, or validation are greatly appreciated, especially as I continue developing this skill further!

BTCUSDT-LONG IDEABTCUSDT is in accumulation forming a triangle if it break this triangle then it will be heading toward top end of the pole buy using a buy stop Stop loss and take profit is mentioned in the chart

BTC Triangle Consolidation: Ready for TakeoffBTC is gearing up for its next move following a triangle consolidation
BTC Target Confluence Zone at \$130K–\$134K – Caution on Alts inHello everyone,
With U.S. stock indices at all-time highs, interest rate cuts on the horizon, and recent stablecoin-related news, Bitcoin is capitalizing on this period of mild euphoria.
Since June 27th, we've also finally seen the beginning of a mini altcoin bull run, with ETH leading the charge by gaining strength against both the USD and BTC.
After several false starts—what some might call mini alt seasons—it's important to remain cautious with altcoins, especially for latecomers who might be entering too late in the cycle.
I’d like to highlight a realistic confluence zone of three technical targets in the \$130K to \$134K range for Bitcoin:
---
1 – Daily Target via 1.618 Fibonacci Extension**
This Fib is drawn from the January 21st, 2024 ATH (\$109.5K) to the April 9th, 2025 low (\$74.5K).
The 1.618 extension lands at **\$131.3K**.
Currently, we’re consolidating around the 1.27 Fib level, which validates this setup.
1 - H4 Target via 2.618 Fibonacci Extension**
This Fib is drawn from the May 23rd, 2025 high (\$111K) to the June 22nd, 2025 low (\$98.2K).
The 2.618 extension points to **\$134K**.
Price has been stalling at the 1.618 extension over the past couple of days, further confirming this Fib level.
3 – Daily Target at the Top of a Broadening Ascending Channel**
The upper resistance of this channel—currently above price—varies depending on the momentum of the next move. Interestingly, it aligns with the Fib extensions above, creating a strong confluence area.
These are, of course, theoretical targets. But during **price discovery**, Fibonacci extensions remain one of the few tools professionals and algorithms rely on to set take-profit levels.
Moonboys calling for a massive altseason might change their tune quickly if BTC gets violently rejected at this confluence zone. Without protection, alts could easily crater—**leaving some portfolios with a second hole**…
To cover all angles, I’ll state the obvious: on the daily and weekly charts, BTC has been steadily grinding within a bullish ascending channel—marked by long, frustrating retracements.
This has allowed the market to build solid strength for what could become a euphoric end to the cycle. BTC might even break out above the channel like it’s textbook.
However, upside breakouts from rising channels are often punished later with sharp reversals in the opposite direction—and that “opposite” could take us all the way back to **\$90K**. A move like that would likely erase the entirety of the altcoin rally in just a few candles.
(And maybe finally fill my forgotten buy orders in the basement 😉)
BTC will survive no matter what, but I’m more concerned about **collateral damage**—and having enough **dry powder** for lowball buy orders, if that fits your strategy.
**RSI**: Nothing to report. No bearish divergence on the D1 or H4.
This is a **short-term bullish outlook** with **realistic targets**, but it’s also a reminder: take some profits while you can—before the market takes them for you (again).
Have a great week
Please, like, dislike, comment and give your idea
Chart on BTC/USDT Spot on Binance 1day candle TF

BTC ShortI think Bitcoin will experience a small correction and then return to the uptrend.
Maybe Bitcoin will achieve the third target.
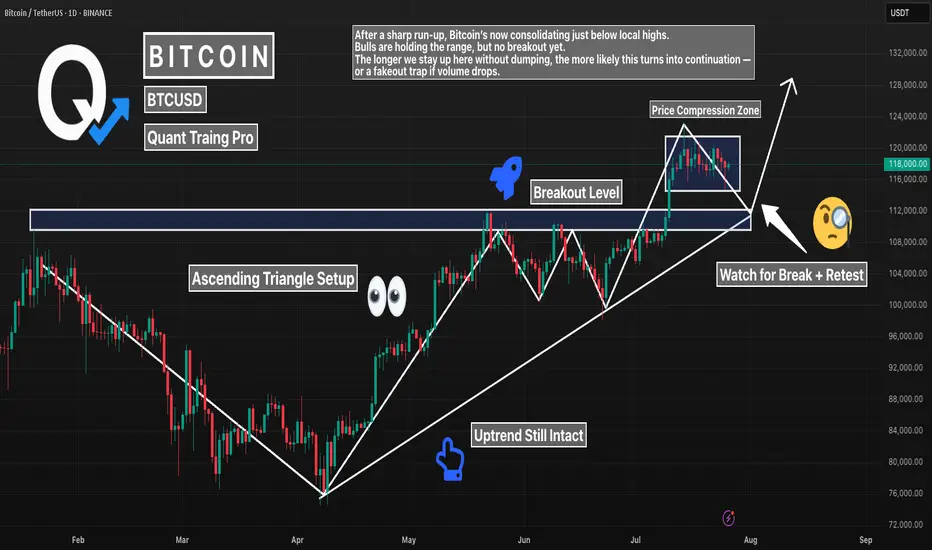
BTC 1D – Major Break of Structure. Now What?Bitcoin just broke major structure — flipping a key resistance level into support. After months of building higher lows, we finally saw price close above the previous swing high, confirming a bullish break of structure (BOS).
Now, BTC is coiling above that zone, forming an ascending triangle and refusing to give up ground. That’s a strong sign — but confirmation still matters.
What to watch:
– Break + retest of current range for continuation
– Or false breakout if volume fades and price sweeps below the level
Structure has shifted bullish. Now it’s all about follow-through.
#BTC #Bitcoin #BreakOfStructure #BOS #CryptoTrading #PriceAction #TechnicalAnalysis #QuantTradingPro