$BTC Breakout Coming?CRYPTOCAP:BTC is coiling up inside a symmetrical triangle on the 2H chart.
A breakout looks close if it clears resistance; we could see a 7.5% move toward the $127K–$128K zone.
Watch for volume confirmation.
DYOR, NFA
BTCDOWNUSDT trade ideas

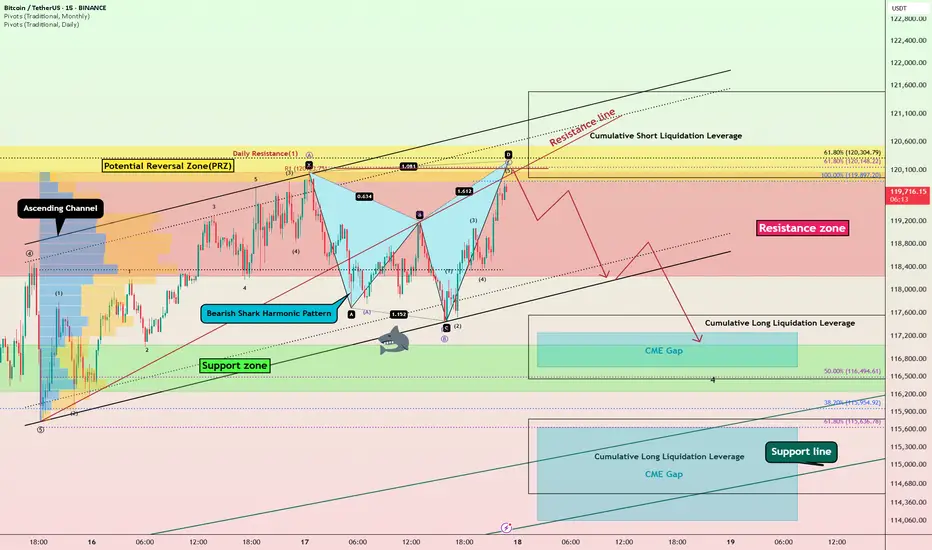
Bitcoin Bearish Shark Detected – CME Gap Below $115K in Sight?Today's analysis is on the 15-minute timeframe , following the previous analysis I shared with you on the 1-hour timeframe .
Bitcoin ( BINANCE:BTCUSDT ) is currently trading in the Resistance zone($120,100-$118,240) near the Potential Reversal Zone(PRZ) and Cumulative Short Liquidation Leverage($121,490-$119,965) .
From a technical perspective , it looks like Bitcoin is completing the Bearish Shark Harmonic Pattern on the 15-minute timeframe .
From an Elliott wave theory perspective, it looks like Bitcoin is completing the microwave 5 of wave C of the Zigzag Correction(ABC/5-3-5) .
I expect Bitcoin to start falling from the top of the ascending channel and at least decline to the lower line of the descending channel, and if the ascending channel breaks this time, we should wait for the CME Gap($117,255-$116,675)/CME Gap($115,060-$114,947) to fill.
Cumulative Long Liquidation Leverage: $117,556-$116,465
Cumulative Long Liquidation Leverage: $115,773-$114,513
Do you think Bitcoin can create a new ATH again?
Note: Stop Loss(SL)= $121,620
Please respect each other's ideas and express them politely if you agree or disagree.
Bitcoin Analyze (BTCUSDT), 15-minute time frame.
Be sure to follow the updated ideas.
Do not forget to put a Stop loss for your positions (For every position you want to open).
Please follow your strategy and updates; this is just my Idea, and I will gladly see your ideas in this post.
Please do not forget the ✅' like '✅ button 🙏😊 & Share it with your friends; thanks, and Trade safe.
TradeCityPro | Bitcoin Daily Analysis #129👋 Welcome to TradeCity Pro!
Let’s take a look at the Bitcoin analysis and key crypto indices. As usual, in this analysis, I’ll review the futures triggers for the New York session.
⏳ 1-hour timeframe
Yesterday, Bitcoin faced a sharp drop after being rejected from the 122733 top and fell down to the 116829 level.
⚡️ Currently, the price has reached an important support area that I’ve marked for you, and at the same time, the RSI has entered the Oversold zone.
✅ Considering the main trend of the market is bullish, this RSI entry into Oversold could be a very good entry point for a long position, as it may indicate the end of the correction.
✨ If the price holds above the 116829 zone, we can enter a long position, and it’s worth opening a position at this level. Further entries can be taken with breakouts of 118494 and 122733.
👑 BTC.D Analysis
Let’s go to Bitcoin dominance. It has continued its downward movement and after breaking 64.44, it’s now moving down toward 64.18.
📊 If this level breaks, we’ll get confirmation of the continuation toward 63.96. In that case, long positions on altcoins would be very suitable.
📅 Total2 Analysis
Total2 is also undergoing a correction like Bitcoin and has settled below the 1.3 level.
⭐ If the correction continues, the next level to watch is 1.26. For long positions, you can enter after breakouts of 1.3 and 1.33.
📅 USDT.D Analysis
Now to Tether Dominance. After bouncing from the 4.22 bottom, it has returned to the box between 4.36 and 4.44.
🔑 If 4.36 breaks, the next bearish leg could start. On the other hand, if 4.44 breaks, we’ll get the first signal of a trend reversal.

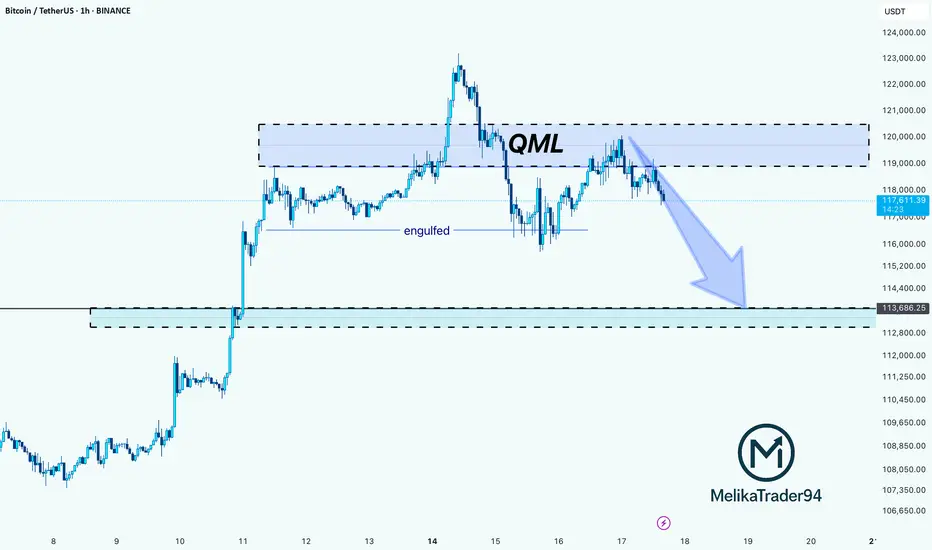
BTC Rejection from QML Zone: Towards on 113,600 SupportHello guys!
This chart shows a QML (Quasimodo Level) setup in play on Bitcoin. After price created a new high and engulfed the previous structure, it returned to the QML zone (around $119K–$121K) and reacted exactly as expected: strong rejection.
The sharp selloff from the QML area confirms a bearish shift in structure, and now the momentum is tilted to the downside.
The next key level to watch is the 113,600 demand zone, where the price may either bounce or consolidate.
As long as the price stays below the QML zone, bears have control.
You should consider that the main trend is bullish, and the stop loss may be hit, so please manage your risk!
BTCUSDT Short Swing TradeBINANCE:BTCUSDT Short Swing Trade, with my back testing of this strategy, it hits multiple possible take profits, manage your position accordingly.
This is good trade, don't overload your risk like greedy, be disciplined trader.
I manage trade on daily basis.
Use proper risk management
Looks like good trade.
Lets monitor.
Use proper risk management.
Disclaimer: only idea, not advice

Bitcoin’s Battle at Resistance Watch These Critical Levels.Bitcoin is currently forming an AMD (Accumulation–Manipulation–Distribution) pattern.
The market recently dipped due to manipulation, only to push back up and break through a key resistance level, moving toward the inversion zone. However, it now faces additional resistance from a descending trendline.
If the market decisively breaks above this trendline and successfully retests it, there is potential for further upward movement.
Keep a close watch on these critical levels for confirmation.
Do Your Own Research (DYOR)

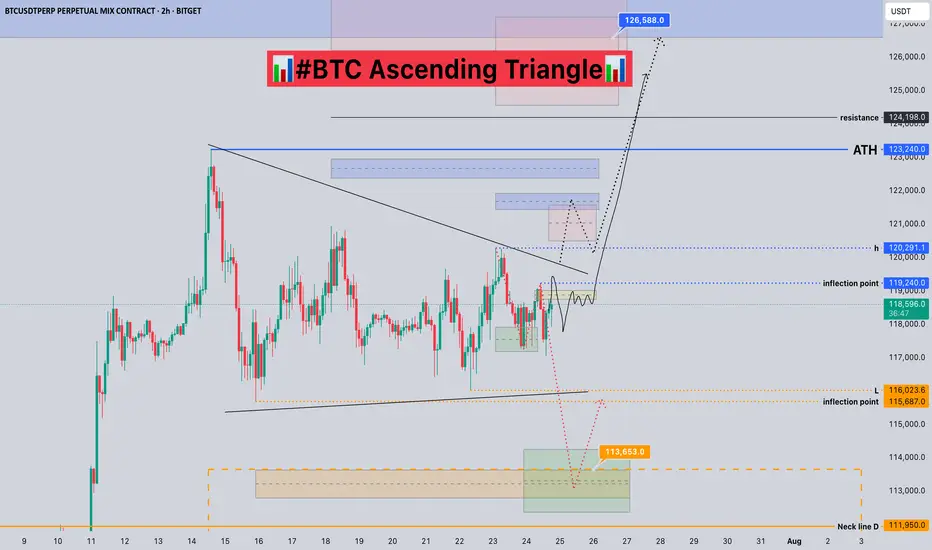
#BTC Ascending Triangle📊#BTC Ascending Triangle✔️
🧠From a structural point of view, we are still in a long-term bullish trend, and the short-term short structure of the small cycle is difficult to change the trend force of the large cycle. And we have been sideways here for a long time, digesting the selling pressure here, and it seems difficult to pull back. And the 15m level has built a bullish head and shoulders structure, so please be cautious about shorting!
➡️From a morphological point of view, the price is gradually compressed and formed into an ascending triangle. Generally, we will use this model to continue the original trend force.
⚠️Note that if we fall below the inflection point of 115687, it means a short structure at the 4h level. We need to be alert to further pullbacks. At that time, if we want to participate in long transactions, we need to find a lower support level to participate, such as around 112000.
Let's take a look👀
🤜If you like my analysis, please like💖 and share💬 BITGET:BTCUSDT.P
BTCUSDT BUY LONGBTCUSDT BUY LONG FROM DAILY BISI
- Market will fully Bullesh In Every TF with Bullrun with Already Starts
- In Daily TF our Long From Daily BISI
- In LTF after Valid MSS with Valid OBI and Mostly After Run On Stop
- Then our entry for Long time of Holding i think its going to over night holding and book profit Partially / Target is Nearly Liquidity pool
Hold and Enjoyyyyyyyyyyyyyy
~ KGB Priyabrta Behera ~
ICT Trader & Advance Mapping SMC Trader
BTCUSDT #056 ( Is it clear Road map ? )Hello dear traders.
Good days . First of all thanks for your comment and support.
-----------------------------------------------------------------------------------------------
On long term Gann Square, BTCUSDT stuck below 0.382 Gann Box price level.
With refer to all Daily bullish Gann Square ( Blue Square) of bitcoin, it is expected to fill up at least 0.75 Daily Gann Square up to 97 percent which will be 135-150 k for this bullish cycle .
Safe trades and good luck.

BITCOIN Ready to Pump - 1H Buy Setup Active!💚 BTC/USDT Bullish Breakout Setup ! Entry Activated!
👨💻 Dear traders,
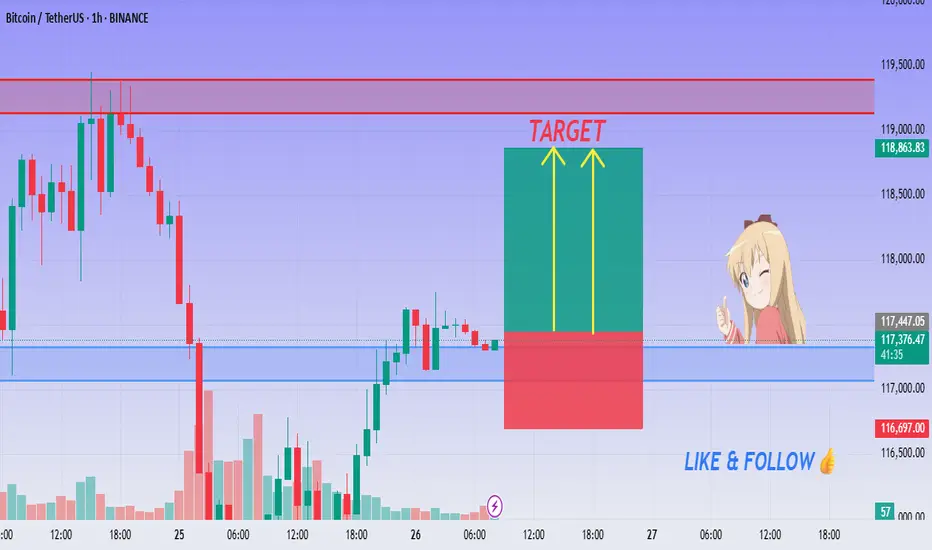
BTC/USDT is showing a sharp rebound from a temporary base structure near $116,500, forming strong bullish momentum on the 1H timeframe. The breakout above local resistance signals the possibility of an impulsive move toward higher levels.
Bias – Bullish (Intraday)
🎯 Target 1 – $118,800
🎯 Target 2 – $119,200
🎯 Final Target – $119,500
🛑 Stop Loss – $116,500
📊 Reasoning:
– Clean bounce from previous structure support
– Bullish engulfing confirms short-term reversal
– Green zone = reward area, red = safe SL zone
– Two yellow arrows project upside momentum
– Strong volume spike during reversal
– R:R favors long scalpers and intraday swing
⚡ Stay disciplined. Let price confirm the zone and follow the momentum!
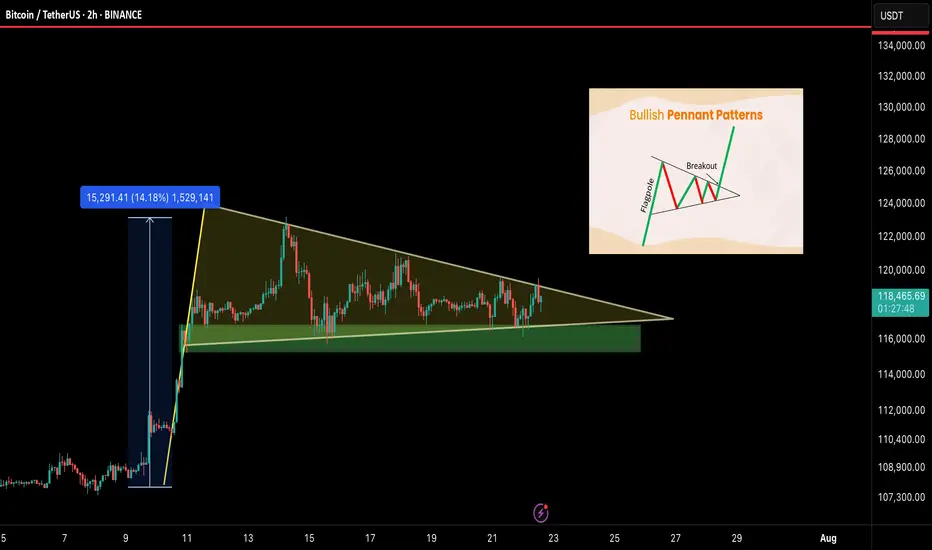
BTC/USDT – Bullish Pennant Setting Up for the Next Leg!Bitcoin is currently forming a bullish pennant — a classic continuation pattern — right after a strong 14% impulse move. This type of structure often leads to a breakout followed by another powerful rally. And it’s coiling up nicely.
🧠 Technical Breakdown:
🟢 Bullish pennant formation in progress
🔽 Support zone: $115.5K – $116.5K
📏 Flagpole projection targets $135K+ on breakout
⚠️ Currently consolidating with lower volatility — breakout could be near
🔍 What to Watch For:
Clean breakout above pennant = breakout confirmation
Daily close below $115K = invalidation zone
Volume spike will likely signal the next move
📢 Final Take:
BTC is showing healthy consolidation after a strong move, and this pennant could launch us toward $135K and beyond. Keep your eyes on the breakout and manage risk wisely.
💬 Share your thoughts below & smash that ❤️ if you’re watching this move!
Bitcoin (BTC): Bullish Start of Week | Aiming For $150KChoppy weekends resulted in a bullish Monday. Once again, we are seeing strong buyside dominance at the start of the week, which is indicating a potential new ATH that we might be going for.
Now as the price is at the $119-120K zone, we are most likely going for a retest today of the current ATH, where we are going to look for some kind of breakout and upward movement.
Markets are on fire, so stay informed and do not FOMO—there will always be plenty of opportunities to gain something from markets, but to lose all it takes is just one stupid decision, so don't FOMO.
Swallow Academy

BTC Weekly Recap & Outlook 20/07/2025📈 BTC Weekly Recap & Outlook
Market Context:
Price continued its bullish momentum, fueled by institutional demand and supportive U.S. policy outlook.
We captured solid profits by following the game plan I shared earlier (see linked chart below).
🔍 Technical Analysis
✅ BTC made a strong bullish move, breaking into new all-time highs.
📊 The daily RSI entered overbought territory, which signaled the potential for a short-term retracement or consolidation.
Currently, price is ranging, and RSI is cooling off. That tells me the market is likely building energy for the next leg up — but not before a significant liquidity run.
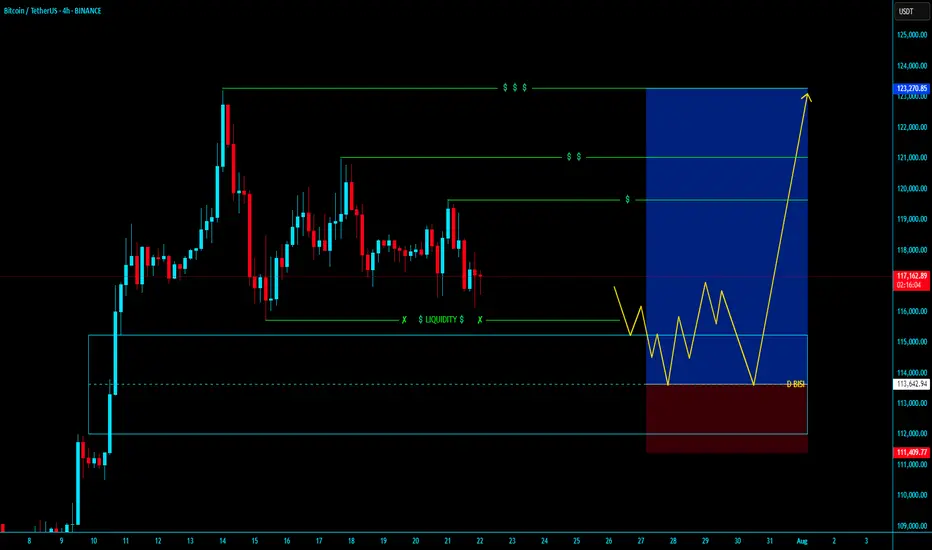
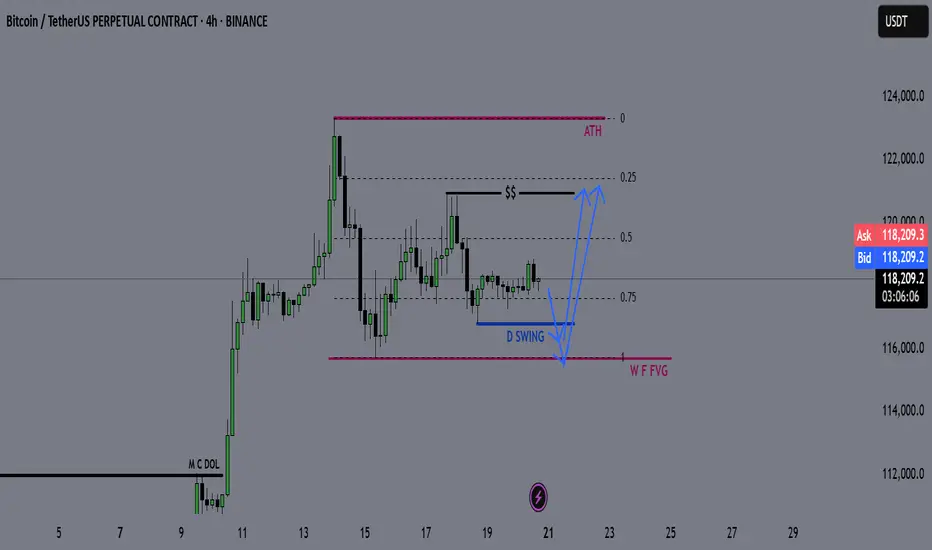
🎯 Game Plan
I'm watching for one of two potential setups:
1️⃣ Liquidity Sweep to the Downside
- A run of the daily swing low
- Into the most discounted range (0.75 Fib zone)
OR
2️⃣ Tap into the Weekly FVG Zone (marked with the purple line)
Either move would create the liquidity and energy needed to fuel a breakout above the equal highs (EQHs) marked by the black line.
🚀 Target
First Target: EQHs (Black Line)
Second Target: Price Discovery (new ATHs)
💬 Let me know your thoughts or drop your own chart ideas below!
📌 Follow for Weekly Recaps & Game Plans
If you found this useful, make sure to follow for weekly BTC updates, market outlooks, and detailed trade plans based on structure and liquidity.
Bitcoin (BTC): OrderBook is Hinting To $115K Bounce | Thoughts?Bitcoin has recently broken the $116K local neckline zone and reached the $115K area, which has been at our attention due to huge orders sitting there.
What we are thinking is that this zone will be a good bounce area, which should lower the price to $120K.
Either way, this zone is important, so keep an eye on it!
Swallow Academy

127k after small fall to 112k . buy altcoins in 112k
Hello. Wait for a small correction to the 112k range. There is still wave 5 left to end this bullish move, which I think will make a new record in the 127k range.

BTC-----Buy around 117600, target 118000-119000 areaTechnical analysis of BTC contract on July 24:
Today, the large-cycle daily level closed with a small negative line yesterday, the K-line pattern was single negative and single positive, the price was at a high level, and the attached indicator was dead cross running, but note that the overall trend has entered the range of fluctuations, and there is no continuation of price increases and decreases. In this case, we should pay attention to the rhythm of washing the plate, which is a very common trend rule, and it is also the trend that many trading friends are most likely to lose money. If you can't find the rhythm and are not calm enough, then the result is back and forth stop loss; the short-cycle hourly chart fell yesterday without breaking the low US market and the price consolidated in the early morning. The Asian morning rose continuously. The current attached indicator is golden cross running, and the price is above the moving average, so today's trend is still rising during the day and then retreating under pressure. It is likely to remain in the range of fluctuations, with a high point near the 121000 area and a low point of 115700 area.
Today's BTC short-term contract trading strategy:
More in the 117600 area, stop loss in the 117000 area, target 118000-119000 area;

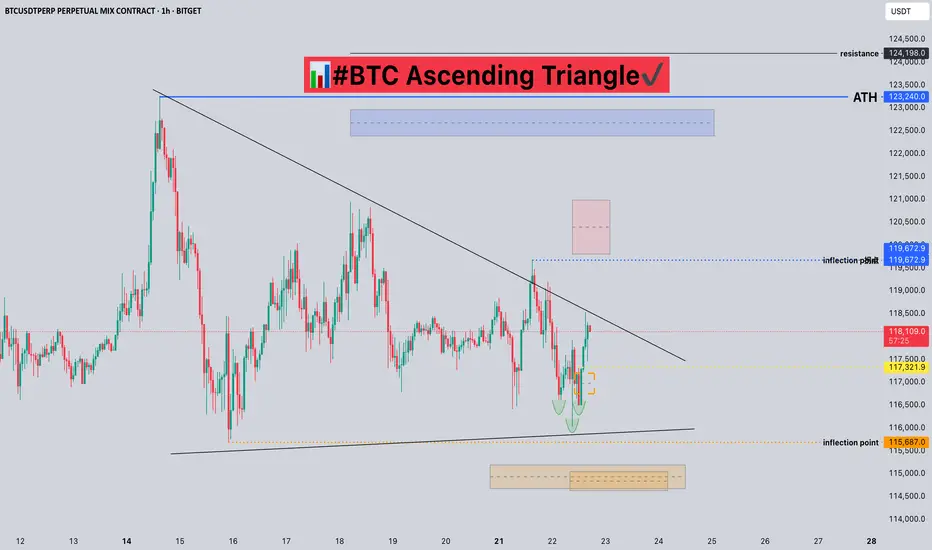
#BTC Ascending Triangle📊#BTC Ascending Triangle📊
🧠From a structural perspective, we are still in a sideways consolidation phase. We have already built a short structure. If we want to continue to rise, we need to break through the blue turning point 119240 and stabilize before we can usher in a big surge.
➡️From a morphological perspective, an ascending triangle is forming. After breaking through h, it is confirmed that the upward breakthrough will occur. The subsequent pullback is worth our participation.
⚠️If we fall below the low point near 116000, we cannot blindly go short, because the sideways consolidation time is too long. After the selling pressure is exhausted, the lows that appear are all opportunities for us to participate in long transactions.
🤜If you like my analysis, please like 💖 and share 💬 BITGET:BTCUSDT.P
Bitcoin Bullish Structure Holds: Focus on Support Entries & Brea__________________________________________________________________________________
Technical Overview – Summary Points
__________________________________________________________________________________
Momentum: Uptrend synchronization on all timeframes (MTFTI Strong Up). Risk On / Risk Off Indicator: strong buy on larger TF, neutral intraday.
Supports/resistances: Main HTF supports well below current price (115,736–117,000, 111,980). Key resistances to break: 120,998.7 and 122,318.
Volumes: Normal to moderate, no climax, no distribution detected.
Multi-TF behaviour: No behavioural excess, no sell signal, intraday phases are consolidative just below resistance, which is normal.
__________________________________________________________________________________
Strategic Summary
__________________________________________________________________________________
Overall bias: Strong bullish, no end-of-trend alert. Buying retracement towards the Pivot Lows is preferred.
Opportunities: Entries on dips to 115,700–117,000 (2H/4H); breakout above 120,250/122,300.
Risk zones: Return below 115,700 or 111,980 = structural alert. Increased vigilance for macro releases (ECB/PMI/Jobless Claims).
Macro drivers: Fed in focus (no move expected), volatility risk around July 29–30 (FOMC).
Action plan: Entry on retracement, dynamic management. Stop-loss under 115,736 then 111,980. Partial exits on excess or confirmed breakout.
__________________________________________________________________________________
Multi-Timeframe Analysis
__________________________________________________________________________________
1D: Resistances 122,318, 120,998.7; supports 115,736.9, 105,100.2. Risk On / Risk Off Indicator: strong buy, all synchronized bullish, no exhaustion. Daily bias: robust uptrend.
12H/6H/4H: Bullish confluence. Strong momentum, stable volume, validated supports. No ISPD excess, sectoral strength intact.
2H/1H: Consolidation below resistance; healthy structure. Supports to be favored for swing/intraday positioning. Minor intraday hesitation, no reversal.
30min/15min: Behavioural neutrality, lateral movement. Volume normal to mildly elevated, no overheating. Structural risk absent.
Additional indicators:
Risk On / Risk Off Indicator: Strong buy up to 2H; neutral on short TF.
ISPD DIV: Neutral, healthy market, no excess detected.
Volume: No climax or distribution, multi-TF structural support.
Cross-timeframe synthesis: Multi-timeframe bullish alignment, no structural weakness. Opportunities on retracement, breakout plays above all-time highs.
__________________________________________________________________________________
Synthesis & Strategic Bias
__________________________________________________________________________________
BTC trend and momentum remain aligned, sector leadership (Risk On / Risk Off Indicator) intact.
Strong HTF support, major resistances must break for extension.
External risk: macroeconomic catalysts (Fed, ECB, US PMI).
Premium opportunities on dips to supports, dynamic management essential around macro events.
Final bias: as long as supports and indicator alignment hold, bull run continues. Partial exit at resistance; stops below validated pivots.
BTC Consolidates Below Key Resistance – Is a Breakout Imminent?Bitcoin is currently consolidating beneath the major psychological resistance near $120,000. The medium-term trend remains bullish, supported by a series of higher highs and higher lows. However, recent candlesticks with long upper wicks reflect hesitation among buyers at elevated levels, pointing to potential exhaustion in short-term momentum.
Despite this, there are no clear signs of bearish divergence or strong reversal patterns. The sideways range between $112,000–$120,000 likely represents a healthy consolidation phase after a strong rally. If the price maintains support around $113,000 and breaks above $120,000 with convincing volume, the next leg higher could follow swiftly.
For now, buyers remain in control, provided BTC holds key structural supports. A breakout confirmation is crucial for bullish continuation.

BTCUSD 16.07.2025 ~+ General gloom over USD (pressure on Powell, tariffs, BB Bill)
* Mostly technical trade
BTC should have one more leg upAccording to Elliot waves BTC should have one more impulse leg up to complete final wave of this cycle. Both daily and weekly RSI charts show bearish divergence, suggesting momentum is weakening even as price attempts to climb. A drop below $110000 would invalidate the current wave count and suggest a shift in market structure.
. Need to watch out reactions at target levels 136-150.

BTCUSD | Long | Volume Confirmation (Jul 25, 2025)BTCUSD | Long | Breakout Momentum & Volume Confirmation (Jul 25, 2025)
1️⃣ Quick Insight:
Bitcoin is showing strong bullish momentum after breaking out of its triangle pattern with volume. The move looks set to continue, and we may see higher levels if momentum holds.
2️⃣ Trade Parameters:
Bias: Long
Stop Loss: $109k (risk-adjusted "invisible" stop)
TP1: $121k (partial take profit)
TP2: $131k (final target if momentum extends)
3️⃣ Key Notes:
Short-term, price could test $96k before reaching higher targets.
Longer-term outlook points to potential upside between $112k–$120k if structure holds.
Watching reaction closely around the $109k area as it will determine if the uptrend stays intact.
I expect the pump phase to potentially wrap up around October 20, 2025.
S&P 500 is also at key levels, and its direction could influence Bitcoin’s momentum.
💬 What are your targets for Bitcoin? 140k? 180k? 240k? Drop your thoughts below!
"Please LIKE 👍, FOLLOW ✅, SHARE 🙌 and COMMENT ✍ if you enjoy this idea! Also share your ideas and charts in the comments section below! This is best way to keep it relevant, support us, keep the content here free and allow the idea to reach as many people as possible."
Disclaimer: This is not financial advice. Always do your own research. This content may include enhancements made using AI.

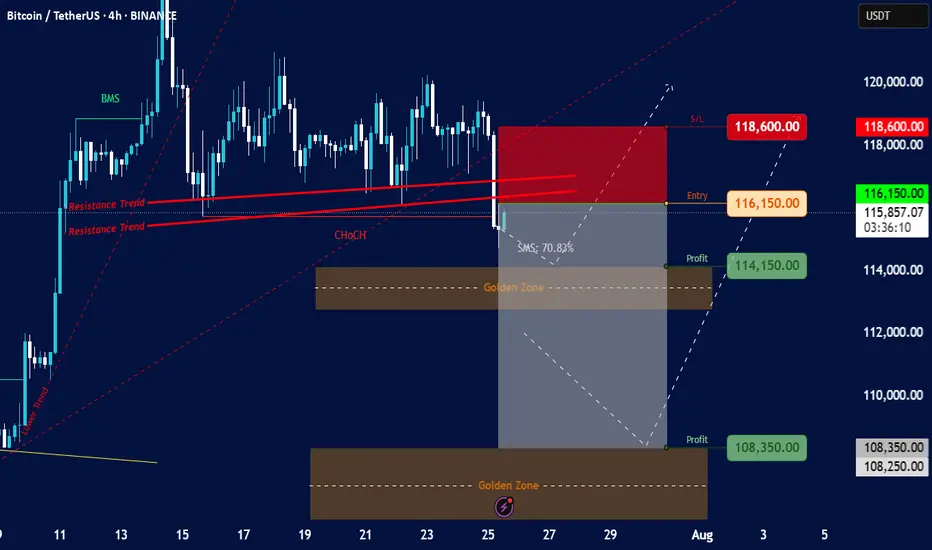
Bitcoin/TetherUS (BTC/USDT) on a 4-hour timeframeOverall Trend & Price Action:
Prior Uptrend: The chart shows a clear uptrend leading up to around July 15th, marked by an "Order Trend" line (dashed green).
Break of Market Structure (BMS): A "BMS" (Break of Market Structure) label is visible, suggesting a significant shift in market dynamics, likely indicating the end of the previous uptrend or a strong pullback.
Consolidation/Distribution: After the initial uptrend, the price appears to have entered a period of consolidation or potential distribution between approximately $115,000 and $120,000.
Resistance Trends: Several "Resistance Trend" lines (red) are drawn, indicating areas where the price has faced selling pressure. A recent breakdown below these resistance lines is evident.
Change of Character (ChoCH): A "ChoCH" label is present, which often signifies a change in the prevailing market sentiment or trend, confirming the shift away from the strong bullish momentum.
Current Price & Trading Setup:
Current Price: The current price is around $115,849.44.
Proposed Entry: The chart suggests an "Entry" point at $116,150.00. This is positioned just above the current price and within a potential retest zone of the broken resistance.
Stop Loss (S/L): The "S/L" is set at $118,600.00, indicating a risk management level if the trade goes against the intended direction.
Profit Targets (Profit):
First Profit Target: $114,150.00, located just above the first "Golden Zone."
Second Profit Target: $108,350.00, situated within the second "Golden Zone."
Golden Zones: Two "Golden Zones" (brown shaded areas) are identified, which are typically areas of significant support/demand or Fibonacci retracement levels where price is expected to react. The current setup seems to target these zones for profit-taking.
SMS: 70.83%: This "SMS" value (likely referring to "Smart Money Score" or a similar metric) of 70.83% suggests a strong bearish bias or conviction in the current setup.
Interpretation & Potential Strategy:
The analysis suggests a bearish trading setup for BTC/USDT.
The presence of BMS, ChoCH, and the breakdown below resistance trends indicate a potential shift from bullish to bearish sentiment or a significant correction.
The proposed short entry at $116,150.00 aims to capitalize on further downward movement.
The profit targets align with identified "Golden Zones," suggesting that these are anticipated areas of support where the bearish momentum might temporarily stall or reverse.
The significant "SMS" value reinforces the bearish outlook.
Risks & Considerations:
Reversal from Golden Zones: While profit targets are set at Golden Zones, these are also potential areas for price reversals if strong buying interest emerges.
False Breakout/Breakdown: The market can always surprise, and a re-entry above the stop-loss level would invalidate the current bearish setup.
Market Volatility: Cryptocurrency markets are highly volatile, and rapid price movements can occur.
News Events: Unforeseen news or macroeconomic events could significantly impact price action.