Structural and Technical Analysis of Crypto + BTC + Altcoins + TStructural and Technical Analysis of Crypto + BTC + Altcoins + Totals + Dominance
🔔 Follow me & smash that rocket 🚀 if you find this useful! Let's ride the next wave together!
🕒 Timeframe: 4H
🧠 Strategy: Customized Dow Theory + Structural
---
🟡 A critical moment for the market:
Many coins, including top 10 alts, are currently sitting on major key levels. Yes, you can go long — but only IF volume supports the move.
📈 That means we must keep an eye on:
TOTAL, TOTAL2, TOTAL3
BTC.D, USDT.D
---
💎 Bullish Trigger Conditions:
✅ BTC.D must show strong red candles (dominance falling)
✅ USDT.D must break below 4.22-4.23 (money flowing out of stablecoins)
✅ TOTAL must break 3.85T
✅ TOTAL2 must break 1.48T
✅ TOTAL3 must break 1.05T
🔴 If all these confirm, it could be a great trigger to enter alt positions.
---
🔍 BTC Outlook
As previously mentioned:
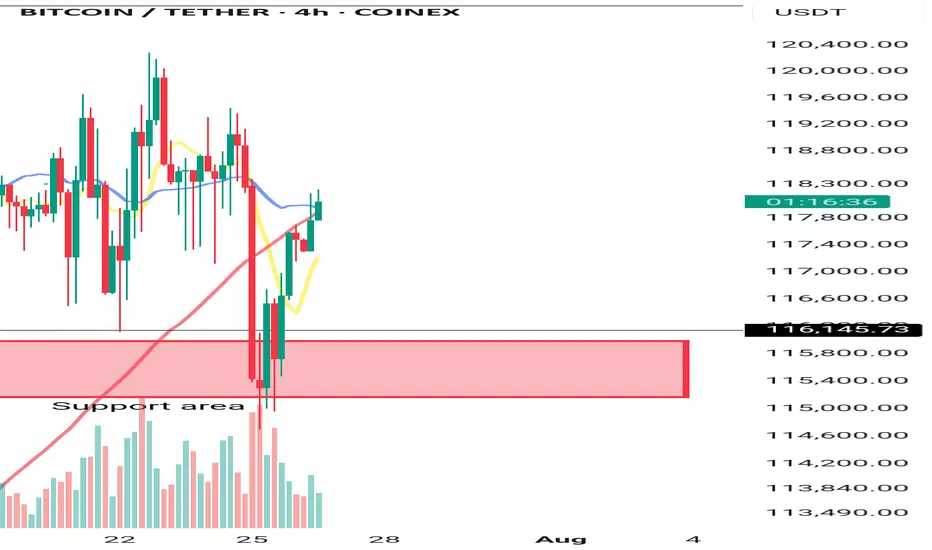
🟥 If sellers want BTC below $115K, they need to break it fast and sharp — slow breakdowns won’t work due to buyer activity.
🟨 Bullish trend requires a break above $120K.
📊 Most likely scenario? Ranging between $115K - $120K
⚠️ BTC Dominance plays a key role here. If dominance drops while BTC ranges, alts could explode.
---
💸 USDT.D Critical Level:
A clean breakdown of 4.23 on USDT.D = 🚀 Funds rotating into alts
---
✅ Coins To Watch (Long Setup Only IF Above Conditions Hold):
♦️BNB
enter:741.00
Sl: 786.13
♦️ETH
enter:3750
Sl: 3480
♦️SUI
enter:4.10
Sl:3.40
♦️XRP
enter:3.25
Sl:2.92
♦️LINK
enter: 18.60
Sl: 17.4
♦️AAVE
enter:295
Sl:276
♦️ADA
enter:0.8405
Sl: 0.7628
♦️SOL
enter: 192.40
Sl:177
♦️DOGE
enter:0.249
Sl:0.220
🔁 Note: First SUI trigger was 3.80 — next key level is 4.10.
---
⚠️ Important Notes:
Today is Saturday, expect low volume
Manage risk ⚠️ and avoid aggressive Martingale strategies
High chance of fake breakouts
Levels being tested might just be lower highs in a bearish structure
❗️Even for bearish continuation, volume increase is key
---
🟢 If you liked this post, don’t forget to Follow & Hit the 🚀 Rocket to stay updated on live setups and strategic insights!
BTCDOWNUSDT trade ideas
BTCUSD SHORTI've spotted a potential short-term bearish move in Bitcoin. Taking a closer look at the 4-hour chart, it seems like we're on the brink of a short-term reversal that could align perfectly with the higher time frame trend. Let's see how this plays out

BTCUSDT Forming Bullish WaveBTCUSDT is currently forming a bullish wave pattern, signaling a potential continuation of its upward momentum. This technical setup suggests a series of higher highs and higher lows, indicative of strong buyer demand and consistent market optimism. With volume remaining robust, the foundation for a significant breakout is solid. If the pattern plays out, analysts expect a 09% to 10% gain in the mid to long term, which could be fueled by renewed institutional interest and global adoption.
Bitcoin has historically responded well to bullish wave formations, often leading to aggressive rallies once key resistance levels are breached. As the largest cryptocurrency by market cap, BTCUSDT not only reflects investor sentiment in Bitcoin itself but also often sets the tone for the broader crypto market. The current price action shows consolidation with positive volume spikes, which further supports the bullish thesis and provides a potential launchpad for another major leg upward.
With increasing attention on macroeconomic shifts, regulatory developments, and halving cycles, Bitcoin continues to position itself as a hedge against traditional market uncertainties. The bullish wave pattern now forming could signal that Bitcoin is entering a new phase of growth, especially as global interest in decentralized finance, ETFs, and blockchain innovation surges.
Traders and long-term investors alike should closely monitor this structure. A breakout with volume confirmation could offer an excellent entry point, backed by strong technicals and a solid fundamental backdrop. The combination of a bullish pattern and broader adoption trends makes BTCUSDT one of the most watched assets in the market right now.
✅ Show your support by hitting the like button and
✅ Leaving a comment below! (What is You opinion about this Coin)
Your feedback and engagement keep me inspired to share more insightful market analysis with you!

#BTC Update #9 – July 22, 2025#BTC Update #9 – July 22, 2025
As previously noted, Bitcoin is currently trading within both a horizontal range (box) and a tightening triangle formation. Although there was a drop last night, price didn’t pierce the lower boundary of the box and is now showing an upward reaction.
As long as BTC holds above this box, there’s no major risk. Bitcoin has already completed the 0.382 Fibonacci retracement from its previous impulsive move. If that correction is sufficient, the next upside target is $127,900.
However, one key point to watch: Bitcoin failed to break its previous high in its last three attempts — a clear sign of price compression and market indecision.
📌 No need to rush into Long or Short positions. It’s best to wait for a confirmed breakout before acting, as premature entries could carry elevated risk.

BTCUSDTBitcoin, in case of protection of the long zone, will go to the final breakout to this peak. My vision of the situation and possible risks of short positions from the current ones. The scenario changes when the 0.5 zone is broken

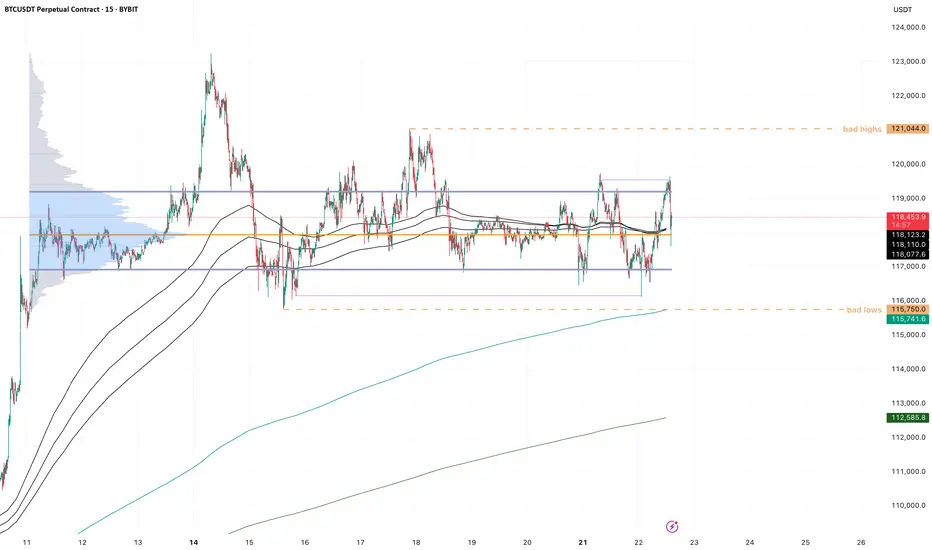
#BTC Update #8 – July 21, 2025#BTC Update #8 – July 21, 2025
Bitcoin isn’t moving in a textbook symmetrical triangle, but it’s trading in a similar, tight range, mostly bouncing around the highlighted box area in the chart. It’s attempting a new impulsive leg, but $120,000 remains a key resistance level, having rejected price several times already.
As long as $116,500 holds, there's no major risk for Long bias. However, considering the triangle-like structure, the short-term upside is limited to about 2% for now.
A breakout above the upper edge of this structure, particularly if $123,200 is broken with strong volume — would justify a Long position. Until then, I don’t plan on entering any trades.
The last corrective move has completed, and my next major upside target is $127,900. If further correction occurs, watch for potential support around $115,000, $113,000, and the strong base at $112,000 — though I don’t expect price to fall that low.

Local Top Confirmed, Short-Term Bearish Pressure BuildingBTC/USDT 1H – Local Top Confirmed, Short-Term Bearish Pressure Building
📍 Timeframe: 1 Hour
📍 Exchange: MEXC
📍 Pair: BTC/USDT
📍 Bias: Short-term bearish, watching for support re-test near 116k
Market Context:
BTC broke out aggressively earlier in the week, pushing above the 120k psychological level before forming a local top near 122k. Since then, we’ve seen:
A strong rejection wick at the top
Lower highs forming
A bearish engulfing candle marking the shift in momentum
Technical Observations:
Bearish Signs:
MACD histogram rolling over, showing fading bullish momentum
QQE MOD flipping red, indicating a shift toward bearish control
RSI crossing below 50 and trending downward — loss of bullish strength
A clean rejection off recent highs, creating a double top feel
Volume on the recent sell candle is higher than average, suggesting strength in the move down
Support Zones to Watch:
116.5k: Prior breakout zone and most recent demand zone
114.8k – 115.2k: Volume consolidation area; if broken, may invite sharper downside
112k: Key structure zone from previous sideways range
Potential Scenarios:
Bearish Continuation (more likely short term):
Break below 116.5k could lead to fast drop to 114.8k support
RSI and MACD momentum align with this move
Look for breakdown confirmation with volume spike + close under structure
Bullish Reversal (less likely unless invalidation):
Hold above 116.5k + reclaim of 118.2k with strength
RSI must turn up above 50 and MACD histogram flip blue
Could target re-test of 120k–121k if bullish momentum returns
Trading Approach:
Short-term traders may look for pullbacks to short under 118k with 116.5k as the first target
Swing traders should be cautious and wait for confirmation at 116k–115k zone before considering long re-entries
Avoid chasing breakouts — let the market confirm direction first
Conclusion:
BTC on the 1H chart shows signs of exhaustion after a strong run. The market is leaning toward a correction phase. Watch the key support levels — they will dictate whether this is a short-term dip or the start of a deeper move.

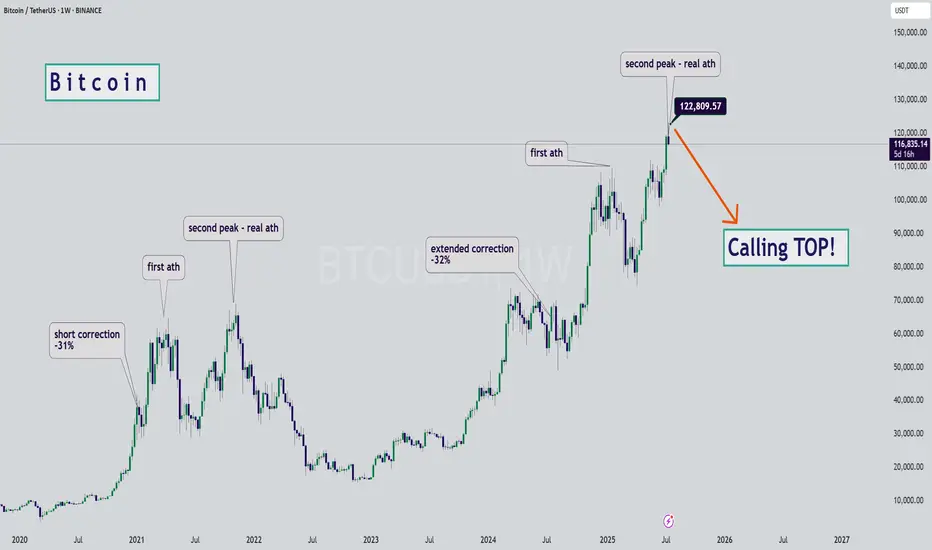
BTC - Calling the Start of the Bearish SeasonHello Watchers ☕
This was my previous Bitcoin update where I had a target of $116K, and also then closed all open positions at $122K:
I'm calling the top here mainly because of the way the chart looks, it really is classic Wyckoff if you look at the duration of the current bullish cycle, which has lasted a whole 973 Days with a 564% increase. What goes up, must come down!
Just for interest sake, the previous bullish cycle ran for 600 days with a 700% increase.
BTC - Sideways forever?!Compressing really hard here on BTC, look at:
- volume range becoming very concentrated, clean pingpong between VAL and VAH
- H4 trend compressing to almost a single point
- you can see from the purple lines that only internal liquidity is being taken on both sides
imo this sets us up for a potential fake out setup. There is so much liquidity on both sides in this small range, that on a very clean sfp of one side, the other side would have to rush out which pushes price quickly to the other side. We saw a little bit of that already with the sweep during the asia session today.
Of course the sfp needs to be valid, wait for a reclaim setup, there is always the chance the breakout/breakdown is valid, you don't want to be on the wrong side of that either.
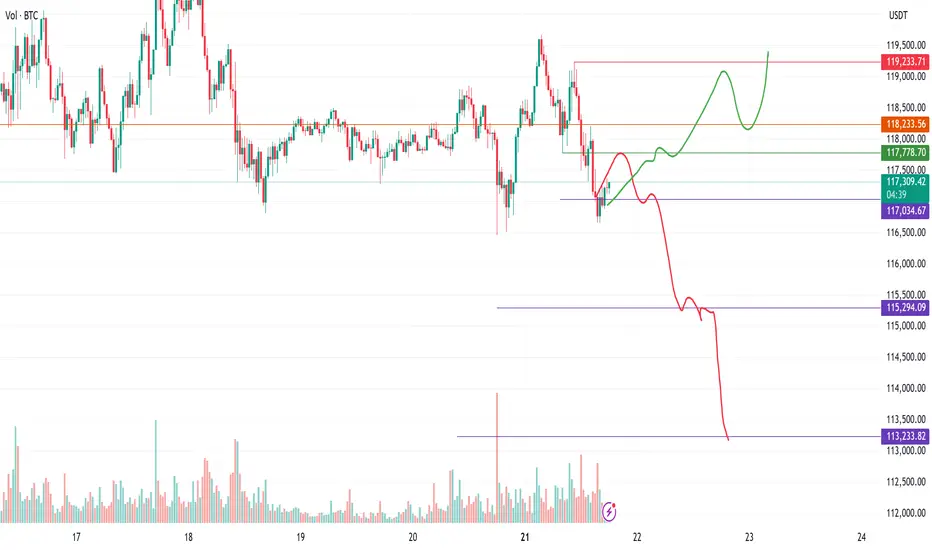
BTC Correction in progress - Can it invalidate? BTC downside pattern triggered on 30 min chart. If it can get back above the green line it will invalidate, though right now the red downside path is looking more likely.
BTC Reloading for Breakout — Watching for 1H MSS Flip
BTC has bounced from local support (green zone) and is challenging the descending trendline.
The price is now testing the red resistance zone and the upper boundary of the 1H MSS (market structure shift) box.
Scenario A (Bullish):
— If BTC cleanly breaks the trendline and flips the 1H MSS box into support (with a strong close above), this is a trigger for a scalp long.
— Target for the move is the upper green box/previous high area near $122,000.
Scenario B (Bearish/Invalidation):
— If price is rejected at the red resistance and falls back below the green support box, risk of deeper pullback toward $116,000 increases.
BTC has shown resilience by quickly reclaiming support after a sweep lower, indicating strong demand. The market looks to be reloading for another push, with liquidity building up just below resistance. The setup favors a breakout if NY Open brings momentum. The flip of the 1H MSS box would confirm bullish intent. However, caution if the breakout fails — structure remains choppy and a failed breakout can trap late buyers.


$BTC Bullish falling wedge pattern (Daily TF)Bitcoin forms a falling wedge pattern on the daily time frame. This pattern is a continuation pattern with the target around $128,000.
$128K SOON

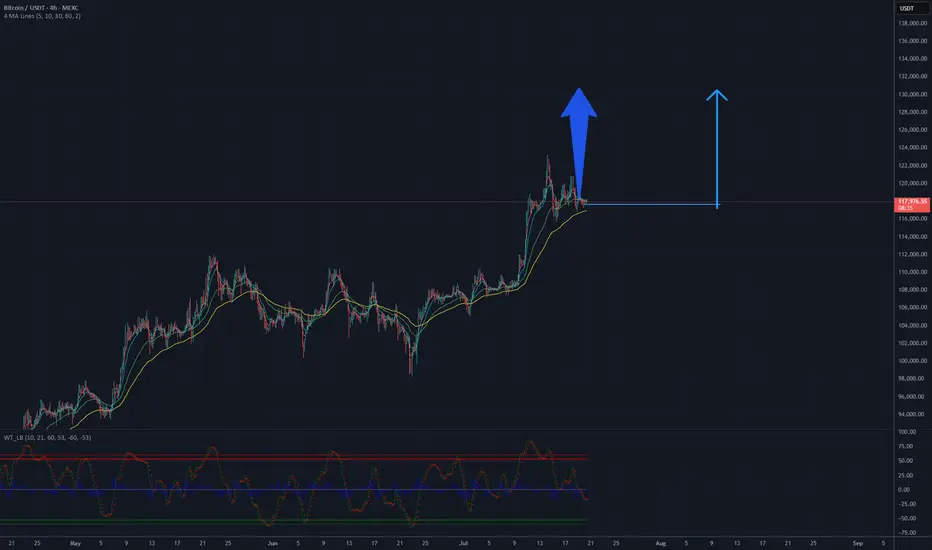
BTC will be 130 K USD? Potential target 130 000 USDAnalysis of the Bitcoin (BTC/USDT) chart on the MEXC platform indicates a positive upward trend. The price is currently hovering around $117,823, with clear support at approximately $100,000, as confirmed by the lower channel line. Moving averages (MA) suggest a sustained upward trend, and the trend line drawn from the lows points to potential for further growth. The current resistance is in the $120,000-$125,000 range, but if momentum holds and this level is breached, the price could head toward $130,000 in the short to medium term. It is recommended to monitor volume and key support and resistance levels to confirm further upward movement.
Potential TP: 130 000 $
Bitcoin’s Epic Run from 80K to 120K: What’s Next for BTC?Yo traders, it’s Skeptic from Skeptic Lab! 🩵 Diving into Bitcoin’s wild ride from 80K to 120K—breaking down the key supports, resistances, and what’s next for BTC.
From the $76k bounce to smashing $110K, we’re eyeing the $120K PRZ. Will it correct or keep soaring? Check the video for the full scoop! Drop your thoughts or coin requests in the comments, boost if it vibes & Let’s grow together!

Urgent Bitcoin Prediction: Longs Beware!!! Bitcoin longs should be careful, as we are below an important resistance and the market looks bearish. Wait for the confirmations I’ve shown in the video before making any moves! Trade professionally with a proper strategy and well-defined entry tactics!

BTC 4H Structure Break – Long Bias with Conditions🚀 BTC (Bitcoin) has clearly broken bullish market structure on the 4-hour timeframe.
📈 My bias is to ride the momentum and look for a pullback to enter long.
✅ I follow a specific entry criteria — price must pull back into the imbalance, find support, and then form a bullish break of structure on a 15m chart to trigger an entry.
❌ If that setup doesn't play out, we simply abandon the idea.
⚠️ This is not financial advice.

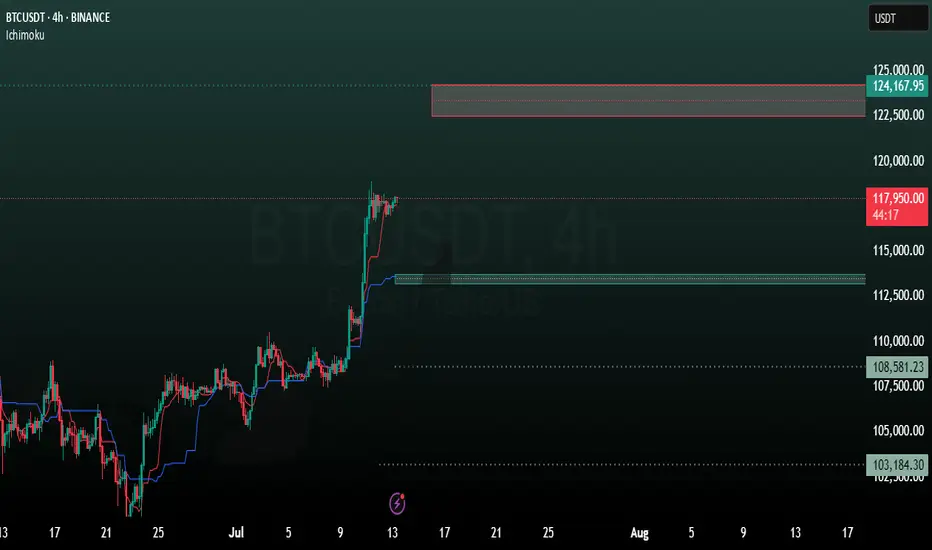
BTC 4H analysisBased on our previous analysis, BTC trend is still bullish. It reacts to our mentioned support level (98699) and moving to new resistance levels.
ICHIMOKU shows these levels as resistance:
122500
124000
137000
And these as support:
113788
113181
108581
BTCUSD LONGIt's a long time to write and explain everything, just buy the level with the limit that is at ~117.550. You can count on a short-term rebound.
The one below the touchdown is not worth taking. I'll let you know if it works or not later.

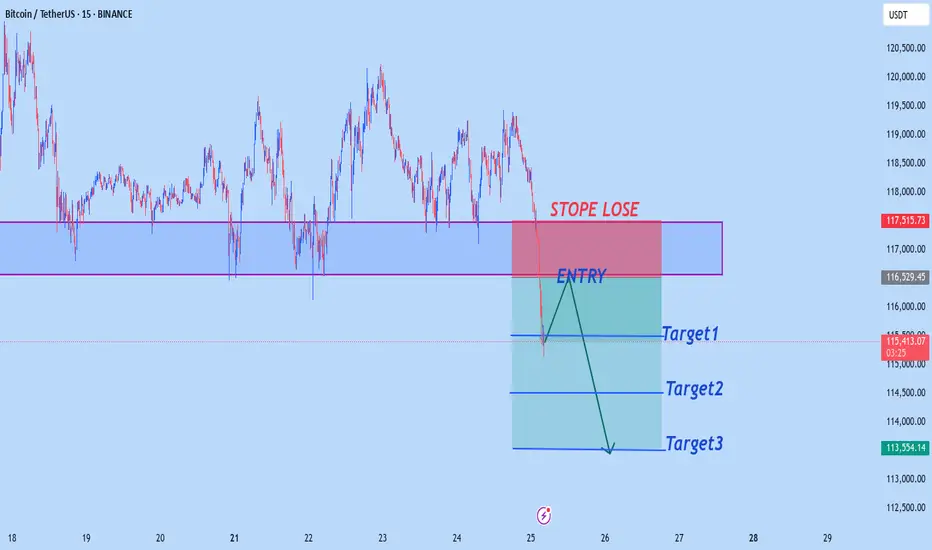
BTCUSD M15 OUTLOOKBtcusd sell from 116,500
target1 115,500
target2 114,500
target3 113,500
Stope Lose 117,500
Trade at your own risk
Shark harmonic pattern Absolutely, Amedeo! Here's a detailed and visually engaging breakdown of the **Shark Harmonic Pattern**, including its structure, trading styles, and how it connects Fibonacci ratios with Elliott Wave Theory:
---
### 🦈 What Is the Shark Harmonic Pattern?
- **Discovered by**: Scott Carney in 2011
- **Foundation**: Combines **Fibonacci ratios** with **Elliott Wave Theory**
- **Purpose**: Identifies potential **trend reversals** using precise geometric price structures
- **Structure**: Five points labeled **O, X, A, B, C** (not the usual XABCD)
- **Key Feature**: Relies heavily on the **88.6% Fibonacci retracement** and **113% extension**
---
### 📐 Pattern Geometry & Ratios
| Leg | Description | Fibonacci Ratio Range |
|------------|--------------------------------------------------|-------------------------------|
| XA | Initial impulse leg | No specific ratio |
| AB | Extension beyond X | 113% to 161.8% of XA |
| BC | Completion leg | 88.6% to 113% of OX |
| | | 161.8% to 224% of AB |
- **Point B** must **exceed point X**, forming an **Extreme Harmonic Impulse Wave**
- **Point C** is the **Potential Reversal Zone (PRZ)**
---
### 🛒 Buy Setup (Bullish Shark)
1. **No fixed retracement for A**
2. **B extends 113%–161.8% of XA**
3. **C completes at**:
- 88.6%–113% of OX
- 161.8%–224% of AB
📍 **Entry**: Near point C
📍 **Stop Loss**: Below point C
📍 **Target**: Retracement levels of BC (e.g., 50%, 61.8%), or back to point A/B
---
### 📉 Sell Setup (Bearish Shark)
1. **No fixed retracement for A**
2. **B extends 113%–161.8% of XA**
3. **C completes at**:
- 88.6%–113% of OX
- 161.8%–224% of AB
📍 **Entry**: Near point C
📍 **Stop Loss**: Above point C
📍 **Target**: Retracement levels of BC, or back to point A/B
---
### 📊 Real Trade Example & Educational Resources are in the comment

BTCUSD Long Trade BITSTAMP:BTCUSD Long Trade - this trade is basically based on Key Levels, prices are very intact as exactly shown.
This is good trade, don't overload your risk like greedy, be disciplined trader.
I manage trade on daily basis.
Use proper risk management
Looks like good trade.
Lets monitor.
Use proper risk management.
Disclaimer: only idea, not advice

BTC ~ 125K when?BTC made this strong hold the green box, Please keep in mind this if it holds, goes straight up and we plan shorts on the top as scalps!
