ETH Mega bullish pattern revealed !Stay tuned traders 🐺
Something big is unfolding on the ETH chart. 📈🔥
As you might know, the falling wedge pattern is usually bullish, but what makes it MEGA bullish?
Let me explain:
If the price gets back into the falling wedge, it shows a clear bear trap , especially when this happens in the support area . As you can see, the price is already in a huge support zone at the lowest Fib levels (0.88 - 0.86).
In my opinion, if ETH gets back into the pattern and closes a candle above it, then with 100% certainty, the price will surge —at least to the downward-sloping purple trendline, which is also a strong and very important resistance level!
This is very possible because if you already follow me , you’ve probably read my ideas about the BTC.D situation , which I want to take a quick look at again.
👉 BTC.D is currently sitting at a very high level around 60% - 61%, which is extremely high and historically signals the beginning of a massive Altcoin Season! 🚀🔥
BTCETH trade ideas

ETH/BTC UpdateETH and alts might be disappointing right now, but this game is all about patience. Waiting patiently for the 0.02299 level test before starting to build long positions

2025 - Year of ETHEREUM = 10kWe are nearing Ethereum's historical reversal. I have been waiting for this zone for a long time, and we are already here.
Check this chart
Now, let's turn on the logic. Many financial institutions and banks did not buy that amount of Bitcoin at a low price, and now, looking at the reality, they realize that they will not miss such a chance with the number two cryptocurrency in the world. Calling Ethereum the number one cryptocurrency in the future and making irrefutable arguments about the more excellent technology of a larger ecosystem and others.
Therefore, based on this logic, we can see an unprecedented influx of money into Ethereum and the entire ecosystem will fly upwards, all L2 solutions and all those projects that came out in the last 2 years in the ecosystem of ethereum that have not shown any result and disappointed the cryptocurrency community. When the majority went into super-tech projects, memcoins performed. To a greater extent this ecosystem will be inflated by retail and small funds based on the logic above, large market participants will recruit and already accumulate the primary cryptocurrency of the ecosystem - ETH.
This is why we can see the coveted 10k$ per coin in 2025.
Best regards EXCAVO

ETH/BTCETH/BTC will rise till August-September and crash. Remember we're in a down trend in monthly chart which will take a long time to recover and start a bull run. For a big and effective bull run bottom side of the down trend channel needs to be retested. Current look on both this pair and BTC.D suggests altcoin rally seems to start in Dec 2026/ Jan 2027.

Elliott Wave - If this chart reverses, it's Alt Season!At this juncture, ETH/BTC has reached a significant level of support, accompanied by a potential completion of an Elliott Wave structure. This may indicate the reversal zone and could spark another Alt Season!
If indeed this is the reversal point, expect the price of Ethereum to explode past all time highs, and the reversal/continuation for alt coins.
We'll see, good luck!

Don't throw that towel in. Long itEth/Btc is showing some signs of a reversal. First, price is landing into some longer term support. The next sign I caught was a weekly bull div on the RSI. Waiting for the Stoch to crossover which it just did on the last weekly close gave it more confirmation. Sentiment is so bad right now and could mean all the sellers already sold out or close to it.
Looking at higher time frames there is hidden bull div on the monthly. The monthly candle needs to close for the confirmation of the stoch crossover. All these clues seem to be the probability of a reversal may happen soon.

ETHBTC , GOING UP?!Hi everyone,
As we see ethbtc toyched fib 0.768 very nice,
A rejection from here could pump it ,
Wait for it soon …
( trade on your own risk )

Will 2025 Bring an Altcoin Season or Continued Divergence?
🔷 BTC.D (Bitcoin Dominance)
Trend momentum has been strongly bullish since late 2022 and shows no signs of slowing on higher time frames (6M, 12M). When BTC.D trends higher, the market tends to concentrate capital in BTC, making it difficult for many altcoins to rally. Any short-term dips in BTC.D on daily or weekly charts could temporarily release some capital into altcoins, but overall, the dominant uptrend remains intact.
🔸 ETHBTC
The ratio has been signaling a SELL bias since late 2023, continuing throughout 2024. It reflects ETH’s weakness relative to BTC. On the 3M chart, ETHBTC is in a downtrend; any upward corrections are likely just retracements before further declines. There’s no clear sign that ETHBTC has bottomed across the monthly, 3-month, 6-month, or yearly cycles.
✔️ Conclusion
BTC.D may see short-term corrections in 2025 but is expected to continue rising overall. ETHBTC, on the other hand, will likely continue its downward trajectory, with occasional small rebounds along the way. This suggests no broad Altcoin Season in 2025; instead, expect ongoing fragmentation within the altcoin market. Capital will rotate selectively based on each sector or individual coin’s structure.
💡 Strategy
Use caution when rotating funds from altcoins to BTC to optimize returns. Carefully select altcoins that show genuine growth potential in 2025, and avoid emotional allocation. Emphasize short-term strategies—buy for the short term, take profits quickly—to navigate a market where altcoins remain highly divergent.

ETH/BTCI think Super Wave 2 is complete. We are at the beginning of Super Wave 3. This chart is definitely proof that the altcoin season has begun.

ethbtc bottom is inBINANCE:ETHBTC pair is above the trend line on a linear scale, where the Federal Reserve started QE in August 2019!

ETHBTCAlt season Brewing? Yes no maybe
Charts dont lie and so do numbers, this cycle will catch plenty people off guard make sure you stacking Alts at these low prices

Ethereum/Bitcoin (ETH/BTC) Cycle Analysis – Potential Bottom AheAnalyzing the historical cycles of ETH/BTC, we observe a repeating pattern in Fibonacci retracements and price drawdowns:
🔹 Cycle 1:
Fibonacci retracement: 83%
Price drop: 80%
🔹 Cycle 2:
Fibonacci retracement: 94%
Price drop: 89%
📉 Projected Cycle 3:
If ETH/BTC reacts to the Fibonacci retracement, it could find support in the 0.020 - 0.023 range.
However, if the bearish trend continues, based on historical patterns, it may drop further to the 0.010 - 0.015 range.
ETH/BTC is currently at a critical level. The key question is whether Fibonacci support will hold this time or if the historical downtrend will continue.
⚠ Disclaimer: This is not financial advice. Always conduct your own research and assess risks before making trading decisions.
📊 What’s your take? Will this pattern repeat, or will we see a different outcome this time? 🚀

ETH ecosystem to fund initial stage of crypto bullrunWhen markets rotate the money has to come from somewhere. Money can move in and out of one sector of the economy into the other, like money moving from industrials into technology or from fiat into precious metals. Money can also move around within a macro system from its constituent sub-systems. In the case of crypto, think we will see the Ethereum ecosystem beggared while money flows out of it into other ecosystems.
In order to try and stay ahead of the rotations into and out of crypto and into and out of the various layer one projects within crypto I turn to the best tool I have, which is the charts. Once we have the layer one blockchain we care about we can look at other layer projects that ride on top of the layer one to move up the risk curve for more volatility as we see fit.
ETH/Bitcoin
Bitcoin is the biggest single slice of the crypto by fame and market cap. The double top threat is pretty clear at this point. The black double top appears to be an eve and eve with the difference between the first and second peak about 3.12% That is about as textbook as we could want to see. We just have to start breaking the neckline of the formation and we should start to see more volatility in the pair.
Eth Dominance
ETH.D is likewise in a double top but this one is a bit further away from the neckline. The targeting is much the same. Due to the structures of the uptrend I think that 40% draw down is very reasonable and realistic.
XRPETH
XRP appears to be in a ascending triangle against ETH with a target close to 2x if full performance is reached.
Solana/ETH
Solana is suppose to be an Ethereum killer and in the long run I think it will live up to its name. I think it has a couple of years for the ecosystem to mature before It does. A major sign of strength will be if this W pattern performs to target. That would have Sol putting up over twice the gains than eth does in the initial stages of this move.
Polkadot ETH
Dot has been moving sideway for the last 4 months and has created some bullish divergence on the weekly chart. I think we will see it slowly erode share out of eth.
Kadena Eth
One of my favorite layer ones to watch and maybe trade before I see my long term set up is Kadena. It is poised ot have a W pattern that pops it over 100% against eth.
Cronos Eth
Cro seems to be another coin in a wedge against eth. The target this cycle is over 300% away from the current level.
ADA ETH
Oh, look, it is another coin in a bullish falling wedge against ETH. Sure reaching the previous ATH might take a decade or so, but that is a decade to favor ADA over eth.
Doge Meme Coin Versus Eth
Want to consider something that at first glance seem moronic or hilarious? Doge has the structure to 70x eth over the next couple of years.
Final thoughts
The Eth team has done a lot to make their system more affordable to use. As price goes down the ease of use goes up and the adoption goes up. Ethereum is in the process of turning itself into a volume trade and not a profit margin trade. That might be a good thing for cryptocurrency as a whole but I am chasing alpha. Crypto gives me more potential alpha than equities so I play here. If the alpha is leaving eth then I am going to leave as well, no matter how good it could be for the world or the ecosystem. Daddy can't pay for his girls food and clothes if he doesn't get that alpha.

ETHBTC Range IdeaETHBTC Range Idea, we can see there a huge liquidy above that need to be taken after price take downside liquidity, this is a good time to accumulate eth

ETH/BTC. History may repeat itself.ETH/BTC touched a very important level and it let ETH print a relief rally. Losing such support may bring ETH back to a very relevant reversal level, BUY HEAVY IN CAPITULATION.
We've added spot at 2300$ ETH/USDT (around 0.025 ETH/BTC).
ETH at these levels is a life-changing opportunity.

will this area suffice !?BINANCE:ETHBTC After this sharp decline, the price returned to an important support area. Will it be satisfied with this price and then we will see a rebound from here, or will the price be exposed to more pressure?
I think this area will be enough, because the previous time when the price touched this area we witnessed a big and strong rebound, and this proves the strength of the support and I think the price will not break it easily.

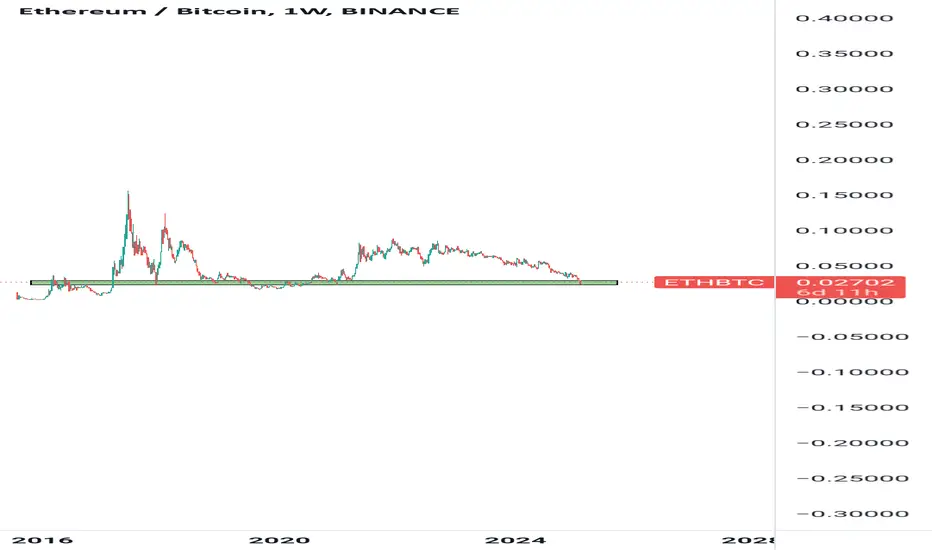
A personalized indicator for Alt SeasonThe behavior of this chart is such that the green line can only block the candles once and the trend line will definitely be broken on the second collision. If this is our assumption, we will notice that in the last few months this green line has been tested for an upward break, from where the price has been reversed. Now if we move towards this line this time, it is very likely and according to its history that this chart will break upwards and altcoins will be heavily pumped.


ETH/BTC I didn’t anticipate the green box to hit when we began reversing on November 18th, but here we are—it’s a strong reversal zone. If this level doesn’t hold, 28/29 is likely next.
I haven’t seen the strength I expected, even with WLFI (Trump's World Liberty Financial) aggressively buying ETH.
but it's now or never so I except a quick reversal from next week.

ETH/BTC Flash of Lux algo bottom signal with potential Bullish Divergence playing out on Weekly
20% upside is in line with ETH/USDT vision posted in other chart
Correlation


ETH/BTC valuation is at an all-time low — great time to BUYETH/BTC has been steadily dropping for a while now, and it’s currently at an all-time low of 0.03. This prolonged decline could present a unique opportunity for those looking to accumulate at a lower price point. With market conditions being what they are, it might be the right time to consider buying before potential upside.
