Potential Gains against BTCEthereum stands to gain ground vs Bitcoin if it can get and hold above the red line above.
Targets on the chart.
If it fails to get and hold above the red line, it may re-test the green line first before moving up.
If the green line is tested and lost, expect equally measured moves to the downside instead.
BTCETH trade ideas

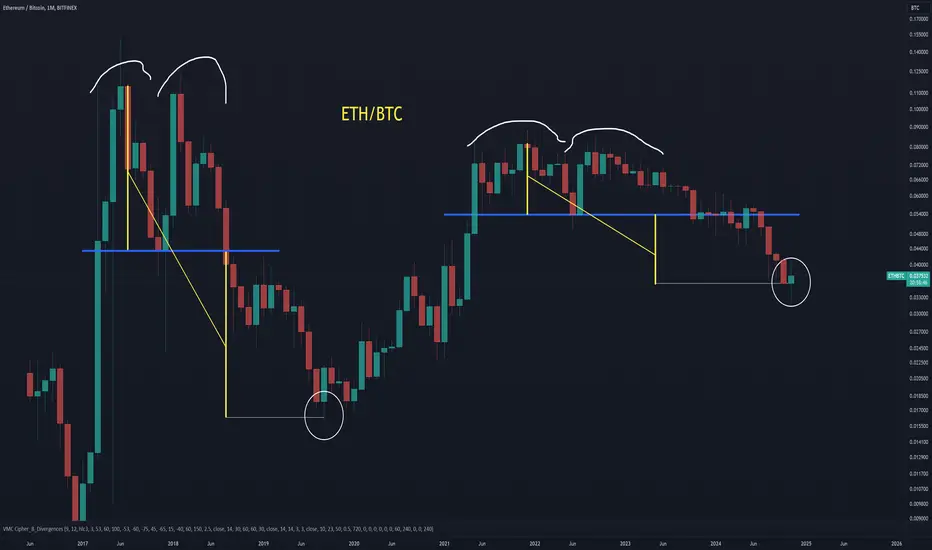
Crucial Moment for ETH/BTC- ETH/BTC is approaching the end of a symmetrical triangle formation on the daily chart, which began back in July 2022.
- The CM Williams Vix and Ultimate RSI indicators suggest that the bottom was established in late March 2023.
- Currently, ETH/BTC is testing a significant resistance line that has held strong since July 2017.
Additionally, considering the Bitcoin Dominance nearing a resistance point (see attached analysis below), it wouldn't surprise me if we witness a breakout for ETH/BTC, resulting in a decreasing Bitcoin dominance and Ethereum outperforming BTC at the moment.
I will conduct further analysis below using other timeframes

ETCBTC is showing UPTHRUST , it can give better return over BTCreletivly etherium can give better return over bitcoin from this level..
invest 5% of your capital
risk /reward is very good
confidence intrade - High
this is not a financial advoice , just for educational purposes .

ETHBTC ForecastETHBTC reached the weekly bottom trend line after exactly 30 weeks when the 50 weekly EMA crossed the 200 weekly EMA (death cross).
ETHBTC will go to the nearest resistance of 0.05-0.052 (in January) and then correct to 0.04-0.042. This happened also in January-February 2021.
After this, ETHBTC will go to ~0.08 at the resistance.

ETHBTC To the Moon ScenarioScenario: Macro Cup & Handle plays out...
This assumes the crypto market becomes bullish again and we get that final leg up in the bull market. ETH will become the strongest altcoin ever EOY.


Ethereum (ETHBTC) Three Years Long Correction EndsGood morning my fellow Cryptocurrency trader, I hope you are having a wonderful day.
ETHBTC (Ethereum) is now reaching the end of a major, long-term correction, a bear-market. This pair peaked the week of 6-December 2021 and several weeks ago it bottomed. Support was found exactly at the 0.786 Fib. retracement level in relation to the bullish wave that took place between September 2019 and December 2021.
The week that produced the bear-market bottom, 18-November, ended as a Doji (reversal signal) and closed green. The following week was full green and this leads us to present time which is a continuation and green session as well.
The Doji can signal reversal when it shows up at the end of a trend. This reversal is only confirmed by what happens after the signal shows up. We have bullish action after this Doji making it a confirmed reversal signal.
It is not only ETHBTC but other related pairs are doing the same. We can expect long-term growth now, something similar to September 2019-December 2021. We will see this pair growing with Bitcoin and/or against Bitcoin, doesn't matter; it is set to grow long-term.
When Bitcoin goes sideways, it grows.
When Bitcoin retraces it grows.
When Bitcoin goes up, it grows.
The bottom is in.
ETHBTC will produce higher highs and higher lows.
Thank you for reading.
Namaste.

What is Bitcoin ‘Pairs Trading’? (Example: ETH/BTC)This is for anybody who wants to sell some Bitcoin but is still bullish crypto. 🚀
It’s also if you’re neutral on crypto but think Bitcoin is overvalued vs other tokens.
It’s also just if you’re just interested to see a way to apply a pairs trading strategy .
In case you’ve been hiding under a rock, Bitcoin just broke over $100k - No more waiting for the HODLRS!!
Naturally after hitting this massive milestone, some traders are going to be thinking about taking profits. And if they’re thinking it, some of them are going to be doing it.
But let’s forget about selling for a moment, are you really buying more BTC when it just hit $100k and it's up ~150% this year?
So even if there is not more active selling interest, there’s probably less buying interest.
I think you’d be mad (or very brave) to bet against Bitcoin. BUT
Are these scenarios possible?
Bitcoin trades sideways for a while after hitting $100k
Alt season kicks in and other cryptos play catchup
If you think yes to at least one of these, my team and me have been looking at a pairs trade
What is pairs trading?
Pairs trading in crypto is a market-neutral trading strategy that involves taking a long position in one cryptocurrency and a short position in another, based on the assumption that their historical price relationship will revert to the mean.
The point is to profit from the relative price movement between the two assets, i.e. not the absolute ups or downs of one asset like Bitcoin.
ETH/BTC
I put this crypto pair this way around - I’m not sure if you’re meant to - it just kind of reminds me of EUR/USD in forex trading.
So as a reminder, ETH/BTC is Ethereum’s token Ether priced in Bitcoin. When Ether outperforms Bitcoin it goes up and when Ether underperforms Bitcoin, it goes down.
So it doesn’t actually matter if Bitcoin goes up, down or sideways, if you’re trading ETH/BTC - what matters is what one does relative to the other.
Well this thing has been going down a lot! Until recently.
Going back to the idea of pairs trading - the thesis here is that the Ethererum/Bitcoin price ratio has dropped to bargain levels and could be about to recover.
I’m not going to lie to you - there are a lot of sore hands out there from trying to catch this falling knife!
But this rebound off the 61.8% Fibonacci retracement of the 2020-21 rally has caught our attention.
Dropping to the daily chart, can you see how 0.4000 has acted like a magnet to the price both from above and below?
0.4 is our line in the sand for long positions.
Equally, our risk is well defined in this setup. A drop back under the 61.8% Fib level around 0.32 means the idea isn’t working and it's time to get out and let Bitcoin do its thing!
How to trade it
Specific entries and exits depend on your personal risk tolerance, but broadly there are THREE methods here:
1. Crypto-to-Crypto Spot Trading
Trade ETH directly for BTC (or vice versa) on a cryptocurrency exchange. This is straightforward and involves holding the actual assets.
2. CFD Trading (Contracts for Difference)
Speculate on ETH/BTC price movements using CFDs without owning the underlying cryptocurrencies. This allows for leverage and the ability to short-sell.
3. Spread Trading
Buy ETH and simultaneously short BTC (or vice versa) with equal dollar value to profit from their relative price movement while minimizing exposure to overall market trends.
But that’s just how we are seeing things?
Do you think this is bananas, or could we be onto something?
Please let us know in the comments
Cheers!
Jasper. Chief Market Analyst, Trading Writers

ETHBTCETHBTC price action forecast for 2025.
ETHBTC formed a bullish pennant pattern with a support at 0.032 and resistance at 0.075.
Also, the bottom of 0.032 was hit exactly after 30 weekly candles from the death cross on weekly.

ETH/BTC Cautious LongQuick Take!
ETH approaching possible reversal and hovering above support with bullish divergence although a bit overbought for my taste.
I think I'd hold out for a bit to see where this one really starts moving.
As always; minimum 3:1, trail, and keep stops tight!📈📉
bitcoin100k #XRP #BTC #Ripple #ETH

ETH (finally) ready to make its moveAfter being outperformed by Bitcoin for more than 800 days, it appears that ETH is finally ready to make its move.
This event typically serves as the signal for the official start of Alt Season.
Buckle up.


Eth Vs btcEthereum has already started outperforming BTC. What will happen when this ration crosses 0.4120

ETH/BTC PUMP INCOMING?!Now that ETH/BTC has tapped into its low, now would be a good time to start going long on altcoins.
I'm expecting BTC to dump soon and all the money from there will flow into altcoins!

ETHBTC bottoming at Monthly Support, watch it unfold.ETHBTC bottoming at Monthly Support, watch it unfold.

ETHBTC - 0.618 Strong Recovery PointThis 0.618 fib is a good spot for a recovery for ETHBTC out of this long bear market
ETH to me right now is extremely undervalued in comparison to BTC and I think the recovery and disparity will change at this Fib line. Letting ETH move ahead of BTC, which is also a strong sign of an altcoin season.
Bearish until .618.

ETH could reach the 0.048 - 0.052 region for 1BTC (37%)The monthly timeframe for ETHBTC seems to have found a strong support at the 0.035 region with some signs of a possible pullback that could reach the 0.048 to 0.052 region for 1 bitcoin.
That region has several confluences between fibonacci levels, strong resistance and the value area low from the broke trend since sep 2023 to now.

ALTSEASON incoming?!Bullish divergence on the daily chart for #ETHBTC.
CRYPTOCAP:ETH looks primed for a catch up. #Ethererum ecosystem should thrive and benefit from it.

it has wings both sides maybe it will fly to the moon I'm not sure if this is a valid harmonics but the price action respected the bullish trend and Point of control it looks like anytime btc holder will pump this prepare your bags and lets harvest what the market can give.

ETH BTC monthly reveral and pivot is inAfter underperforming BTC for 3 years, the monthly candle closing indicates a pivot and reversal. Key levels for ETHBTC are marked. Safe assumption to go until 0.1 BTC per ETH. Assuming Bitcoin price remains around 100k range, ETH has a pathway of least resistance to reach 5 figures.

ETH BTC Pair Minimum TargetLet's say ETH BTC already topped in this cycle
the current ETH BTC pair upside move is corrective, even in this case ETH BTC price will be .05-.06 BTC.
If BTC top is around 130k, ETH should be 7500-7800 I know it is too optimistic
Separately I am targetting ETH price ~ 6500

ETH/BTC Yet to BreakoutIn the extreme bullish scenario once we see ETH BTC price breakout
ETH BTC should be close to ~.08 BTC to .1BTC
Let's Say BTC top is around 120k Ideally ETH should be close 9.6k-13k
Seems unrealistic but not impossible. Based on ETH wave analysis I am targetting ETH to hit 6500k.
Never the less the ETH BTC pair breakout yet to be confirmed.