Alt Coin IncomingETH/BTC bounced from its trend line support that indicates momentum shifting from BTC to other coins. Most of the Alt coins are pumping and other are in a queue. Let them play their game!!!
BTCETH trade ideas

ETH/BTC Monthly RSI Hits Record Low The ETH/BTC monthly RSI has never been this low before. Could this signal a potential reversal or a historic buying opportunity? Keep an eye on the charts! 🔍

Looking at ETHBTC's RSI The RSI on the Monthly for this chart is nearly in the oversold zone
This oversold zone is where I expect a strong recovery to form the right side of a W pattern on the RSI itself.
Right now ETH is underperforming compared to BTC and is a great choice for the alt season run.
The sloped green line is where the RSI line will find support.

ETHBTC Bottoming - Maybe? Hitting a few possible resistance points here, could ETH be finally bottoming against BTC? Only time will tell.
Some good capitulation but not heaps of volume.
Bullish divergence on RSI which is good.
But it could go lower, lets hope not but you can see the next support right there down lower

Btc/eth chart bullish trend lineBullish trendline is on point on bitcoin/ethereum chart. We are going to move here to around 0.04 before new consolation and next step higher.

ETHBTC break the red zone, Altseason is comingI'm waiting for this break about 2 weeks,
now it is time to buy altcoins.
use this trend

ETH/BTC Technical AnalysisPiece of HOPE for ETH investors. We need to see this play out for ETH/BTC to reclaim its previous ATH.

ETH/BTC Weekly Closing Above 0.702 Fibonacci - A Bullish Signal
The recent weekly close of ETH/BTC above the 0.702 Fibonacci retracement level is a significant bullish indicator. Here's why:
Morning Star Pattern: The formation of a "Morning Star" candlestick pattern on the weekly chart suggests a potential reversal of the prior downtrend. This pattern typically occurs after a period of declining prices and signals rising buying pressure.
Fibonacci Retracement: Fibonacci retracement levels are key technical analysis tools used to identify potential support and resistance zones. The 0.702 level is not a standard Fibonacci retracement level (which are typically 23.6%, 38.2%, 50%, 61.8%, and 100%). However, traders sometimes use more precise Fibonacci calculations, and 0.702 could represent a significant level within the current ETH/BTC price structure.
Confirmation of Trend Reversal: Closing above this 0.702 Fibonacci level confirms the bullish sentiment suggested by the Morning Star pattern. This indicates that buyers are gaining control and that the price could potentially continue to rise.
In simpler terms:
Imagine ETH/BTC was in a downtrend, like a ball rolling down a hill. The Morning Star pattern is like the ball suddenly stopping and starting to roll back up. The 0.702 Fibonacci level acted as a hurdle or a resistance point. ETH/BTC jumping over this hurdle is a strong sign that it has enough momentum to continue moving upwards.
Mega confirmation would be this weekly candle close above 0.04 Say
Important Note: While this is a positive sign, it's crucial to remember that no technical indicator guarantees future price movements. Always combine this information with other analysis tools and risk management strategies.

Arbitrum and Optimism are becoming very interesting.According to previous cycles, when Bitcoin dominance peaks, Ethereum rises. Arguably, we are there, or about to be, and that made me focus on its ecosystem.
Two of its most known layers 2 are Optimism and Arbitrum, and I want to bring to your attention their charts against BTC.
Optimism is breaking out of a descending wedge, and its target is about 5200 sats, which is in fact a previous support/resistance. Volume is confirming the breakout, and we got a narrative on ETH.
Arbitrum is also breaking out of the same figure, whose target is about 1200 sats. Volume is increasing lately as well.
I'm already posicioned, but in case there is a retracement I'd ancourage you to take a closer look to an entry.

Long trade
2min TF entry
Buyside trade
Mon 25th Nov 24
12.45 pm
NY Session PM
Entry 2min TF
Entry 0.03618
Profit level 0.03859 (6.66%)
Stop level 0.03606 (0.33%)
RR 20.08
Reason: The buyside trade narrative is based on supply and demand and internal liquidity.

ETHBTC easy....After many years the moment is here, the Fibo, Gann, levels, many haters.... The contrarian...

ALT season could start here. Bitcoin is losing its dominance and ETH BTC just bounced from a 3-month order block after a 50% pullback.
BTC will mostly likely be ranging for some time which is room for the large caps to outperform.
Looking for trades on these:
Dave FX Hunter


ETH/BTC PUMP INCOMING?!Now that ETH/BTC has tapped into its low, now would be a good time to start going long on altcoins.
I'm expecting BTC to dump soon and all the money from there will flow into altcoins!

A Very Scuffed BartleyWould not be 100% on the idea yet because there is no confirmation, but this could be a bullish move. A harmonic pattern: combination of a Bat Pattern because of the 50ish retracement and Gartley Pattern because of the 0.786 retracement on the pattern completion. Keep in mind these are monthly candles, so it could take 84 years to take off. This could be the start.

Short trade
15min overview
1min TF Entry
Sellside trade
Mon 25th Nov 24
5.30 am
LND Session AM
Entry 0.03573
Profit level 0.03478 (2.66%)
Stop level 0.03586 (0.36%)
RR 7.31
Reason - After careful observation, the price reached a pivotal supply level indicative of a sellside trade.

Ethereum Buy RecommendationDue to the positive context of the cryptocurrency market and the fact that Ethereum, the second most important currency in the market, has not yet shown significant movement, I make my buy recommendation based on the following technical aspects developed.
1 - Formation of reversal candles of the tomorrow's star type on the weekly chart.
2 - Beartrap at important long-term resistance
3 - Excellent risk-reward ratio with target at the next important resistance on the weekly chart.
Do your own analysis and don't forget about risk management. Follow us for more analyses like this.

ETH Weak VS BTCEtheruem is looking extremely weak at the moment, we have just broken a ercent swing low and looking downwards towards the previous range.
I have a few levels below that give me confluence to believe that ETH will drop as well as many altcoins unless we absoultely find a bounce and soon.
Below you can find the Previous Range point of control marked in Blue.
We also have a weekly level which fueled the latest massive rally.
And lastly a long term upwards trendling dating back nearly 10 years to 2015, and it comes in perfectly with all the other levels making it a massive support zone.
This may mean signal BTC pulling away or maintaing its price level. Albiet, the candles below us would suggest a swift move to the downside as opposed to a slow bleed.
I will be watching this to be a potentiall accumulation period for ETH.

Good news for ETH holders!Hi there!
It is a high probability that from this level ETH will be Bullis vs BTC.
This is a long-waited moment for ETH holders also it is not bad moment for BTC holders who want to trade ETHBTC pair.
It is a nice opportunity take care and have a nice day!
Good luck traders and holders

Make ETH Great AgainYes you can see fake yout in support trendline indicating strong reversal in some point
Now ETH is stronger than BTC, is altseason start ?
If alt start, ETH will outperform BTC but this week also have many economic event, sometime it can cause turbulence

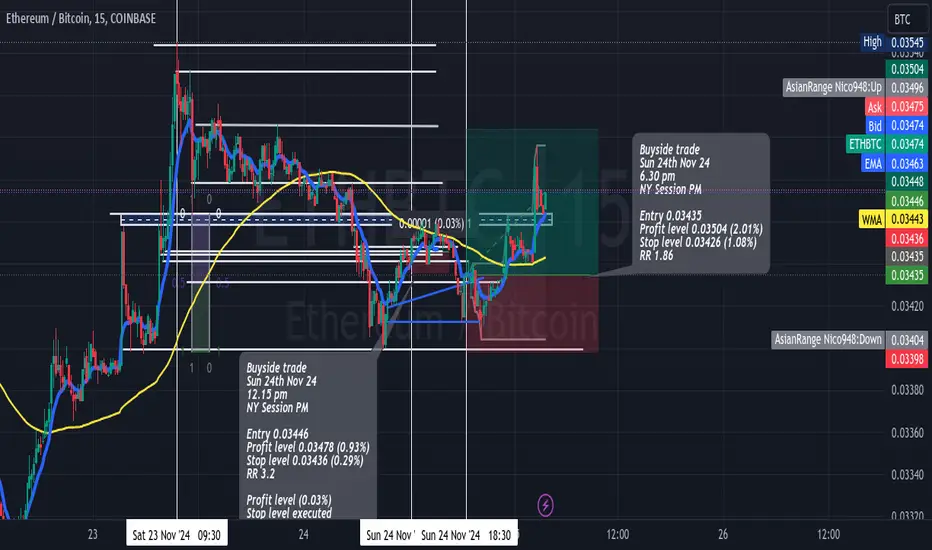
Long trade
Buyside trade
Sun 24th Nov 24
6.30 pm
NY Session PM
Entry 0.03435
Profit level 0.03504 (2.01%)
Stop level 0.03426 (1.08%)
RR 1.86
Reason: Observation of price action and bias towards the upside since Sunday 24th Nov 24th and utilising the PD array for stop loss efficiency (look left).
ETHBTC Likes JANPrior years has shown moves in JAN for ETHBTC first in 2016 and 2017 are the most prominent examples.
We have see so much bear action on this pair it is clear ETH will lead this altcoin season.
Do you think these are coincidences?

Long trade
30min TF overview
Buyside trade
Sun 24th Nov 24
12.15 pm
LND to NY Session PM
Entry 0.03446
Profit level 0.03478 (0.93%)
Stop level 0.03436 (0.29%)
Reason: Price action reached a pivotal demand level indicative of a buyside trade.
RR 3.2
