ETH/BTC Catch up time?ETH/BTC chart broken down into some simple key areas. We've recently had a double bottom as ETH has lost strength against Bitcoin, however for me it is clear that if the breaker block is flipped after such a strong reaction from the double bottom ETH is on its way to reclaiming strength against BTC.
The next level of major resistance would be 0.0625 area. After BTC's huge move recently and other L1's like SOLANA and INJECTIVE etc ETH has had a lagging response in comparison.
With profits from BTC filtering down the next obvious place would be Ethereum before some sort of mini alt-season if that's possible at this stage. Coupled with the news that Blackrock have just registered an Ethereum trust in Delaware ETH looks very strong currently.
BTCETH trade ideas

ETH/BTC - Wicked right to the trendline from previous postAfter seeing ETH/BTC fall right back to 0.051 at the same trendline we have seen many touchpoint of support. Right as we touch that trendline the news comes out of BlackRock's ETH ETF. Amazing how that works.

It looks like we are at the beginning of the Ethereum bull runI am an Ethereum buyer in this price range BINANCE:ETHBTC

When is the best time to buy Ethereum?The Ethereum to Bitcoin price ratio chart indicates that Ethereum's price remains influenced by the fluctuations in Bitcoin's price.
The pattern displayed on this chart suggests that Ethereum is likely to endure buying pressure from Bitcoin in the market.
However, the ideal range to anticipate a more substantial movement for Ethereum against Bitcoin would be around the parity level of 0.0490-0.0456.
Furthermore, the market is expected to facilitate more substantial bullish movements for Ethereum by providing additional support for Ethereum.

ETH/BTC first accumulation zone reached.Starting to DCAing in a little at this level from BTC.
Will start DCAing harder once the second, and a lot more within the golden pocket, and especially the third accumulation zone is reached.
ETH vs BTC have the potential to fall even lower. But long term, I am bullish, hence looking for opportunity to accumulate ETH now that the first phase of the Bull Market seem to have commenced with BTC pumping first.

ETH $3.3k after dipI believe after hitting support we will finally test our Supply zone at $3.3k all shorters will be eliminated. ETH/BTC is due for 1 hell of a bounce/rally

Ethereum / Bitcoin Trying to Find a SupportEthereum's current pullback presents an intriguing scenario.
The BITSTAMP:ETHBTC price seems to be seeking support in the range where it retraced during the mid-summer of 2022.
Currently hovering around 0.05, this level stands as a crucial support zone.
If Ethereum maintains above this mark, a potential climb to 0.058 and beyond becomes feasible.
On the flip side, dropping below 0.05 might extend the downtrend. The next moves are uncertain, so stay tuned and observe the market dynamics closely.

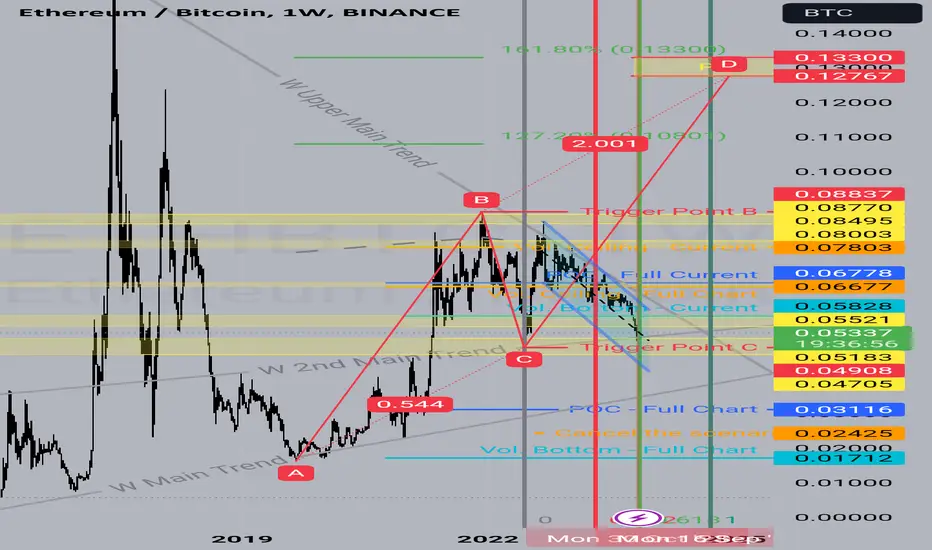
ETH/BTC on weekly chart looks nice I believe eth/btc is looking solid now and trying to breakout the main trend since it is at the upper level of the trend
Also, we have a bullish harmonic ABCD that has higher targets.
All the best insha Allah!
ETH to Massively Outperform BTC in the NEAR Future!all the signs are there:
- SEQ 9 weekly on tom-de-mark
- oversold on weekly RSI and lowest on 2 weekly MRI
- Trendline (multi-year)
- Demand zone
- Support zone
- Range low


Ether/Bitcoin pair breaking downEthereum continues to bleed against Bitcoin. I sold all of my ether around $1,800 last year during the 'buy the rumor, sell the news' merge event and haven't rebought since. I'm waiting until the ETHBTC ratio dips back below 0.04, and ideally on a USD pullback below $1,300. As usual, patience is key.
Currently, I'm 70% cash after the bitcoin pop, with plans to be all in 2 months before the halving, i.e. halving Apr 2024 -> be all in by Feb 2024. Note a recession may change this plan if it materializes.


ETH/BTC ETH/BTC has been bleeding for a while now. BTC got a great pump to new ATH of 2023. You always see every cycle that BTC breaks out first before ETH is getting injected. ETH/BTC is stabalizing right now and possible looking for a move up while many expect its still going down because it's looking quite weak. If ETH is going to find the move to follow BTC it is going to be soon and it is going to be big. Otherwise i am looking at rejection levels for BTC. BTC is still the main market driver!!!

Bitcoin showing strength against Ethereum, but it's not over yetI have been watching this falling wedge for over a year now and my plan was to swap my Bitcoin to Ethereum when the breakout did occur. However, with the halving coming up for Bitcoin and the disappointing Shanghai update for Ethereum in September, Ethereum has struggled to match the performance of its predecessor.
The falling wedge broke structure downward and as of now, I expect Ethereum to more or less follow Bitcoin and/or underperform, but there is good news. The ETH/BTC pair is trading just above a strong support zone. Once we dip our feet into this zone, I believe that bulls will begin to file into ETH, likely within the next 12 to 18 months, likely finding confluence with the beginning of the next true altseason following Bitcoin's probable upcoming rally.
We should be aware of this chart and keep tabs for the opportune moment for a powerful long position will inevitably arrive and we will likely see ETH reach levels against BTC that we have not yet seen before. Unless some unknown future event occurs that puts the significance of ETH into question, it is more than probable that we will see some sort of double bottom pattern form here.
Remember to trade smart, not fast, and always keep your head on your shoulders. We are here to make money, not lose money.

What's the future of Ethereum?We made future predictions based on the past upward cycle.
It's likely to be wrong, but it's a history that's repeated more than twice, so you need to think about it.

$ETHBTC: Ethereum trending down vs BTCLooks like Ethereum has a lot of downside potential in the ratio vs Bitcoin here...
It's been underperforming massively for a good while, ever since it peaked back in 2021, after the 'deflationary asset' bubble combined with NFTs and whatnot, it:
broke under the uptrend inside trendline (a less obvious support level you obtain from plotting a trend line from the lowest high of each swing).
Failed to break over the down trend speed line (starting from the very top in the ratio in 2018, down to the bottom in 2019, you plot a line that represents 50% of the progress made in that time, and 25% of it, and extend it in time like a 'ray')
Triggered a Time@Mode down trend signal in long term charts.
The down trend signal points to a substantial decline in the coming 16 months.
I'd brace for impact and stay on the sidelines, or short it vs Bitcoin if possible. As long as rates don't make it costly to hold, it will pay off. (if not stopped)
Best of luck!
Cheers,
Ivan Labrie.

EthBtc getting ready for massive moveHey guys,
Do make sure to hold some ETHBTC as its printing strong inverse Head and shoulder BULLISH reversal pattern.
Everything is well explained on the chart for your immediate action and all targets were shown.

ETHBTCNothing is personal, I love both assets but I thin in upcoming two years eth will outperform in general.

ETHBTC - Likely Recovery PointETHBTC looks really bearish right now to me at least.
I expect a recovery at either the dotted line which is now being crossed or the secondary dashed line at 0.03
From there I could see a sharp recovery up as in the past ETHBTC has acted this way, aligning also with a higher high within the prior structure

ETHBTC: The Back Bone of Risk Appetite AnalysisIntroduction:
Understanding the nuances of the cryptocurrency market is challenging, especially with its inherent volatility. However, seasoned investors often rely on specific charts to gauge the market's overall sentiment. One such crucial chart is the ETHBTC chart, which is a ratio of Ethereum's price to Bitcoin's price. This article delves into how this chart can be an essential tool for discerning risk appetite in the crypto market and identifying potential altcoin outperformance compared to Bitcoin.
1. A Brief Overview of ETHBTC:
The ETHBTC chart represents the value of one Ethereum (ETH) in terms of Bitcoin (BTC). When the ratio rises, it suggests that Ethereum is gaining strength relative to Bitcoin, and when it falls, Ethereum is weakening relative to Bitcoin. Solana will be used as a representative for altcoins for live examples.
2. Gauging Risk Appetite:
Bullish Sentiment for Altcoins: A rising ETHBTC ratio can be an indication that the broader altcoin market is bullish. Ethereum, being the second-largest cryptocurrency, often leads altcoin rallies. When investors are optimistic about the general altcoin space, Ethereum typically sees significant gains against Bitcoin.
Bearish Sentiment for Altcoins: Conversely, a falling ETHBTC ratio may indicate a more risk-averse sentiment, where investors prefer the perceived 'safe-haven' of Bitcoin over altcoins, including Ethereum.
3. Identifying Potential Outperformance of Altcoins:
Early Indicators: A rising ETHBTC ratio can serve as an early signal that altcoins might start to outperform Bitcoin. When Ethereum, a bellwether for altcoins, gains strength against Bitcoin, it can foreshadow a broader altcoin rally. (depicted earlier)
Reversal Points: Sharp reversals or significant inflection points in the ETHBTC chart can indicate changing market dynamics. These can be pivotal moments where market sentiment shifts, providing opportunities for astute investors.
4. Correlation with Broader Market Indicators:
To get a comprehensive view, investors can also correlate the ETHBTC chart with other market metrics like total market capitalization excluding Bitcoin or volume dominance of major altcoins. Such analyses provide a more holistic understanding of where the market is heading.
5. Caveats and Considerations:
While the ETHBTC chart offers valuable insights, relying solely on it can be myopic. It's vital to:
Combine with Other Tools: Integrate the insights from the ETHBTC chart with other technical indicators and fundamental analyses to ensure a well-rounded investment decision.
Stay Updated: The cryptocurrency market is notoriously dynamic, with rapid changes. Regularly updating oneself on global news, technological advancements, and regulatory changes is paramount.
Conclusion:
The ETHBTC chart is a potent tool in an investor's arsenal, offering insights into market sentiment and potential altcoin performance. However, as with all investment strategies, it's crucial to employ a multi-faceted approach, integrating various tools and staying updated to navigate the tumultuous crypto waters successfully.

ETHBTCETHBTC
Monthly and weekly time frame
There is an important support, I prefer it to come back from here. But if it doesn't come back and breaks the yellow downward trend, the green line is a very suitable point to convert Bitcoin to Ether. The neckline is from the inverted head and shoulder pattern that existed in the market in the past, and *if* we reach that area, a BAT pattern will be formed, which can cause the price to return.
