ETHBTCi am waiting explotion after open usa stock market.we are getting to end For ETH.
If there will no wick for altcoins then it means that there is just a way which is up :) Lets Gooo
BTCETH trade ideas

ETH/BTC CALLING A BOTTOMI have "called a bottom", this Pattern is unrealistic and cannot be continued.
At this point I am "all in" in ETHEREUM

Ether seems to be starting to show strength against Bitcoin.Ether seems to be starting to show strength against Bitcoin.
So far Micro strength)))
Inside Gen by RateXAI Agent
Ethereum is pushing toward $1.8K after a strong 10% move this week. But there’s a bearish divergence showing up, which usually means a short-term correction could happen. Right now, it looks like the market might either pull back a little or just move sideways before trying to break higher again. Overall, the sentiment stays neutral to slightly bearish until we see a clear breakout.
On the 4-hour chart, there’s a clear divergence between price and RSI, which backs up the idea of a possible pullback. If the price gets closer to $2K, liquidity zones could kick in, causing some forced liquidations and maybe even sparking stronger buying pressure after that. For now, it’s better to stay cautious and watch how the price reacts around these key levels.

EthbtcThis is good bullish signal for alternative coin
I see bullish divergence in rsi
The price is in a good support range.
$ETH vs BTC - Falling Wedge breakout. Combined with the recent analysis ive been posting on ETH / USDT, i think theres a real chance for a low here on ETH / BTC.
Real clean falling wedge, and capitulation low, with a breakout and reaction.
Could it stall a little bit here and retest the downsloping trend, absolutely, but in similar instances of these type of bottoms, you dont usually get that. Not once youve gotten your sign of strength / reaction outside of the downtrend.
While im not trading this chart specifically, it helps validate the USDT pair, and the Bear market fractal ive referenced.
Regarding the USDT pair, id look for support above 1754, and if it holds up, that would be considered a sign of strength imo, and id look for a retest of the highs coming into 2100ish.
Typically this is where a partial decline would come in, and itd give you an inverted head and shoulders look. The partial decline is the final signature youd expect to see with this type of broadening bottom. If it retests the highs again, after a partial decline, id anticipate a breakout there after, with a 100% measured move underway.

ETHBTC will supercede BTCs price growth % metrics. Time to SEED!ETH has been met with so much price gravity lately that it went to correct unbelievably from 4k+ to 1.5k.
Thats more than -3x of its peak price - an overextended trim compare to its peers like BTC which did a muted hibernation but still price remained afloat up there.
But hope is starting to arise from the latest price behavior. We are seeing some significant shift in trend. Net longs are starting to pile up from the current bargain price area -- conveying positioning of long term growth seekers. BTC is showing some massive break in structure as well showing some obvious signs of market recovery as a whole.
With this in mind, ETH metrics is becoming more and more attractive -- if we compare its possible price growth in terms of percentage and proportionality growth ratio.
ETHBTC will definitely benefit with this forthcoming growth ratio change.
Based on our diagram, we are already seeing some gradual shift -- a first sign of reversal to the upside. This can roll up soon and pace up its numbers.
Price is currently bouncing perfectly from its 6 year solid support. This is a massive hint already of things to come. GOOD THINGS.
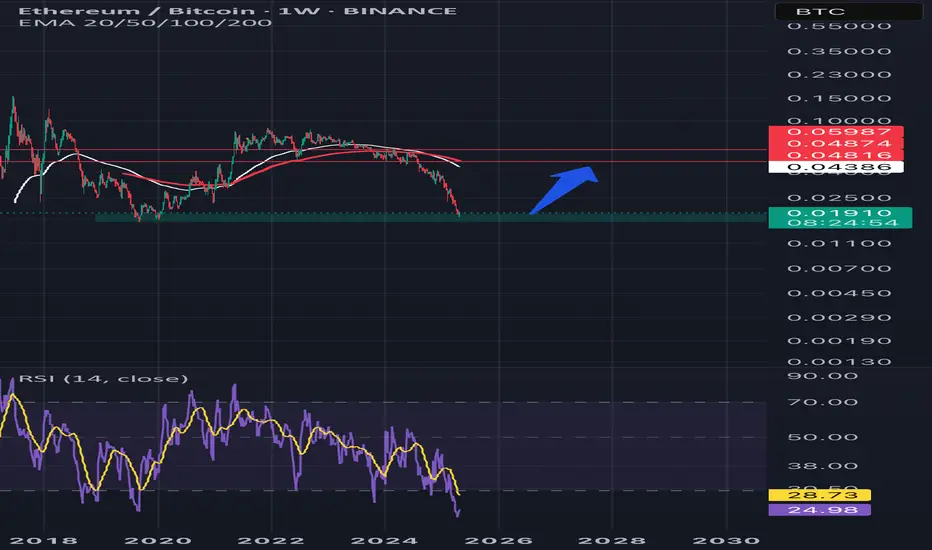
Spotted at 0.0190
Target X10.
TAYOR. Trade safely.

A Reversal on ETH/BTC is already on its way.With 80% probability, ETH will soon become stronger than Bitcoin.
Many factors are now on the side of Ether.
I have already written about them, a huge plus is ETH - ETF Staking for the guys from Wall Street.

ethbtcnot quite at the bottom vs btc, maybe.
but on the daily its starting to turn.
My matic trade was taken because of the action i was seeing on eth (0.185)

ETHEREUM BOTTOM?ETH/BTC continues to be the punching bag of crypto – but the chart is finally showing signs of life.
We’ve got clear bullish divergence on the daily RSI. While price made a lower low, RSI made a higher low – hinting at momentum shifting beneath the surface. Volume also ticked up as ETH pushed higher, adding a bit of confirmation.
Zoom out, and it’s even more compelling: ETH is historically oversold on the weekly chart (not shown here). This signal has triggered some major reversals in the past. Yes, it’s failed before – especially on ETH – but this setup is one of the more reliable ones across markets.
I know I’m a glutton for punishment posting ETH charts while it’s still limping around the floor, but that’s usually where opportunity likes to hide. We found the bottom in the newsletter 9 days ago. Now we need follow through.


Bitcoin Will Continue to Slap EthereumWave E should be much lower than wave C.
Also note the size of the red bars in the last period.
I think this fight could reverse around next October.
* The purpose of my graphic drawings is purely educational.
* What i write here is not an investment advice. Please do your own research before investing in any asset.
* Never take my personal opinions as investment advice, you may lose your money.

Macro ETH/BTC Bearish Adam & Eve (Double Top)Not looking good for ETH bag holders. The worst merge since the Philadelphia Experiment. Target 0.005 and below.

ETH Reversal ZoneStrong technical level for ETH to reverse providing us a once in a decade opportunity to buy ETH.

ETH/BTC Long. I am calling a bottom, ALL-IN ETHEREUM AT THISThe ETH/BTC pair’s RSI 30 DAY CHART(massive) is at extremely low levels 20, indicating oversold conditions that often precede reversals.

Ethereum PECTRA Upgrade IncomingX posts suggest optimism, citing potential for Pectra to drive adoption and price recovery, possibly to $3,000+ if staking ETFs and the upgrade align.
MAY 07 is a major alignment.

eth-btc I've been studying the ETH/BTC chart using fractals, and I've noticed something interesting. The price is currently pausing at a strong order block and sitting right on an ascending channel.
What makes this even more compelling is that both the dates and fractal patterns are aligning, suggesting a potential repeat of past behavior.
Additionally, according to the Rainbow Chart, ETH is in the accumulation zone, which makes the case for the long-awaited altseason even more promising.

Crypto Bubble is about to burstETHEREUM is at stake, where are the institutional money?
bears and day traders flooded the crypto space and new money is not flowing in, CME has ETH as the most shorted asset of crypto space, things can not go on like this,
IT is a make or break in ETH history

ETH BTC LONG PositionETHEREUM is setting up a bullish move against Bitcoin, The bottom at 1850 is completely formed, and high higher's are imminent...

MAY 07, Ethereum Pectra Upgrade taking effect on PricePosts on X reflect optimism about Pectra’s potential to drive ETH price growth, citing the upgrade and potential ETH staking ETFs as bullish catalysts.

Possible Reversal Zone for ETH/BTCETH/BTH has been on a heavy decline, this significant level marked by the parallel channel and Fibonacci level suggest a potential reversal zone. Time will tell.
ETH/BTC is heavily oversold when you look at the RSI reading.
Let me know what you think.

ETHEREUM BITCOIN (BEST-CASE)CRYPTOCAP:ETH is the main platform for thousands of apps and blockchains, all powered by the Ethereum protocol.
This vibrant ecosystem fuels innovation and a wide range of decentralized apps and services.
Free and global Ethereum accounts
Pseudo-private, no personal information needed
Without restrictions anyone can participate
No company owns Ethereum or decides its future


ETH/BTC GOING UPETH/BTC is expected to bottom here and gradually find its way to the 4hr Supply Zone
