Green dot also on the market cipher indicator on the 8 hour Green dot also on the market cipher indicator on the 8 hour chart
Bullish signal !!!!
Don't forget to push the like button. Thank you.
BTCEUR trade ideas

Green candle on the MACD indicatorGreen candle on the MACD indicator
Go bitcoin............
Don't forget to push the like button. Thank you.

A very good strategyGOLD PREDICTION AND SIGNALS + BuySell Signal V3.0 by Nick Kenens + MACD or ZigZag++

BTCEUR Pattern, lines - short termThese are just lines to demonstrate a pattern. It doesn't say anything about the direction, because the result of this pattern is the combination of several markets and numerous individual decisions. Nevertheless, bots have a tendency to act rationally, hence the fomation of patterns that refelct the optimal mathematical solution. I'm just interested in seeing that live, as it forms.
I am a sculptor, not a trader.

Rate Chart and Order 0/10 (fail)Hi,
I've just started trading on TradingView, before that was on binance. Found Binance much easier to set order but their chart is ugly. Like old pixeled screen when you zoom out and blury image.So ive actidentally failed at order ofc Limit amount wasnt executed as i wanned : D ,but its fine 30e are at stake no biggie...
So how does my chart looks. Does it make sanse ? :( :)

Btc/Eur random analisys from a newbie :) Check it outWhat do you Think ? Any ideas i could use more for analysis would be great to know :)) (Please comment below)
Thanks.


Golden cross for bitcoinGolden cross for bitcoin at the 10 september.
Bitcoin shall explose !!!!
Don't forget to push the like button. Thank you.

Buy signal on the indicator hash ribbonWhen bitcoin have a buy signal on the indicator hash ribbon.
The price never went lower again !!!!!
Don't forget to push the like button. Thank you.

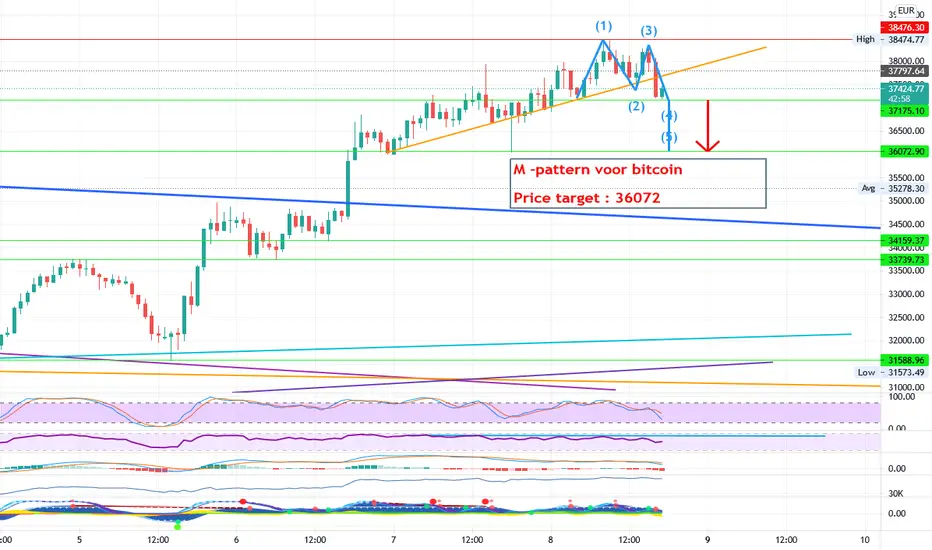
M-pattern voor bitcoinM -pattern voor bitcoin
Price target : 36072
Don't forget to push the like button. Thank you.
Bearish divergence on RSI for bitcoinBearish divergence on RSI for bitcoin
Bitcoin shall go down.
Don't forget to push the like button. Thank you.

Bitcoin must break resistance line and MA 200 for bull runFirst we must break the blue resistance line.
And if bitcoin breaks MA 200 then the bull run starts again.
Don't forget to push the like button. Thank you.

Nostradamus 101: BTC EUR 1 month aheadSince many of you have messaged me for an update, here it is.
>>This is not financial advice. If you can make the most of this analysis, great. Enjoy.<<
Let me preface by saying what I always say: divide any advice by half and conduct your own research!
So, to recap.
BTC was at its all-time high in mid-April, back when our friend Musk announced that you'll be able to buy TESLAs with BTC... or so we thought, I mean this is how news cycles work boys and girls, they take time to marinate! Besides, markets naturally go through 3 phases: Accumulation, Hype and Distribution.
Nonetheless, our billionaire buddy decided to defraud his own followers for a quick buck. Frankly, sickening, and what's worst, is that people still look up to him as some messiah. Relax, he is just an inventor, a good one, but nothing more, another industrialist who is willing to sacrifice his own people for his own benefit... nothing new.
Then we had the El Salvador news... another news cycle, and on top of that, news coming out of one of the most corrupt countries... I mean we know about lobby, which is technically another word for insider trading / promoting interests of others... so why were we surprised to see a head and shoulder pattern? We weren't... we saw it coming, all of us, we just didn't want to believe it.
Remember kids, news cycles mean: insiders have already accumulated and set a trend, then the rest of us retail investors rush out of FOMO, then the same insiders distribute (sell) hence making a chunky profit. And unlike us poor pleebs who expect 20-40% gains, billionaires with their billions should be content at say 3-10% which is already plenty... so when you see a new trend set by news cycles, read between the lines... because that is when you begin to view the market broadly... that is when you begin to understand how and when big money makes moves... remember, a billion-dollar trade would probably takes days to complete, you wouldn't be able to click market order... that way, you as a savvy billionaire lose money... so start visualizing how the players of the market could potentially act... also picture what would make them sweat and act out of FOMO (a feeling more frequent in retail noobs).
As for today, now we have the Amazon news cycle which has been drowned by the potential of U.S. regulators taxing cryptocurrencies. So what now you ask? Many things, depends on the combination:
1. Amazon did not confirm use of BTC, it confirmed use of cryptos in general at some future date, potentially December of this year (makes sense cyclically). Now the danger is: Amazon reverting on their announcement with something like: "we will look into it next year", "we are not ready yet" or, worst of all for BTC, "we will start off with our own coin and then make it available to the rest...". There are a million ways this could pan, but what is almost certain is that Amazon, Tesla, the Musks, Bezoses and Bransons of this world give 0 **** about you, they care about money, power and legacy... so watch out...
2. In previous analysis I mentioned that unfortunately (particularly for the naive) BTC was created with other intentions in mind. Money laundering. Absurd you say.. long story short, industrial shadow governments and mafia farms (in China, Russia, North Korea, Iran etc...) have mined BTC for the last decade... and are currently offloading... I mean this does not mean the end of BTC, but not the 100k we dreamed off, at least not right now... sure, there is buying power, but no volume, volume is with the billionaires, corporations and shadow players... we (retail investors) are but a speck in this ocean of BTC volume... therefore just keep it in mind when trading.
3. Lastly, nothing is ever what it seems, even the patterns that we do know of change / reverse / break... remember, if you had a billion and you want to short a currency... all you must do is trade the closing of each pivotal candle (e.g. 1h, 4h, 6h, 12h, 1d, 1w) - this means that you could (and they do) sacrifice a couple of million in losses to ensure that a candle closes a certain way to show a certain pattern (FYI: called institutional candles)... remember guys, all you fundamental and technical analysts... patterns are all about ' the self-fulfilling prophecy', this means that once there is an idea in the world, and enough people are exposed to that idea, and then it manifests, it almost naturally forces market players to react in a certain manner, and this means, nothing is ever what it seems.
Hope this helps you trading warriors. Adjust and overcome. Safe trading.

Bitcoin Bearish Tringle Patterns & Volume ProfileHey there this is an updated chart of my previous share "Bitcoin Bullish Confirmation, Tringle Patterns & Volume Profile".
I had labeled the previous chart as "Neutral" however the 'Point of Control' didn't breakout since today.
To this updated chart the patterns shows that bear is on the way.
That's why I strongly believe that this chart is helpful for "shorting".
I will keep posting updates.

We're not out of the woods yet. < $20K BTC is still possible. This is the same idea as last one but with Candles so that new bars will load (this feature is not available for Renko bars).
An Expanding Triangle is a pattern that starts with the price action squeezed tightly in the Apex (dotted blue line). There will be usually at least two swing highs and two swing lows in price. Overall volume usually diminishes as the pattern develops because traders become more and more unsure as to the market’s future direction. Also there may be several intermediate failed efforts to reach either the support or resistance as outlined by the triangle extensions. If the action creates a new bearish breakdown, typically the action will repeat the volatility experienced with the Pole creation (the vertical blue lines). We also need to pay close attention to the volume after the breakdown to recognise further development for the pattern. Another breakdown downwards is possible. Let's see what's gonna happen.
Safe trading everyone.

< $20K BTC still possible. We're not out of the woods yet.I got rid of the noise by using Renko bars and saw a potential Bear Expanding Triangle in development. An Expanding Triangle is a pattern that starts with the price action squeezed tightly in the Apex (dotted blue line). There will be usually at least two swing highs and two swing lows in price. Overall volume usually diminishes as the pattern develops because traders become more and more unsure as to the market’s future direction. Also there may be several intermediate failed efforts to reach either the support or resistance as outlined by the triangle extensions. If the action creates a new bearish breakdown, typically the action will repeat the volatility experienced with the Pole creation (the vertical thick blue line). We also need to pay close attention to the volume after the breakdown to recognise further development for the pattern. Another breakdown downwards is possible.
What do you think of this pattern?

Don't go chasing waterfallsWait till BTC reached the (confirmed) bottom before going in. Everything can happen but I just want to share two possible scenarios. What do you think of this idea? I think Scenario 2 is very unlikely to happen but the chance Scenario 1 will play out is bigger than many people think.
Happy Careful trading everyone.

Maybe a bull flag for bitcoinMaybe a bull flag for bitcoin.
Target : 37104
Don't forget to push the like button. Thank you.

Historical volatility indicator showing a bad sign for bitcoin.On the weekly chart.
The historical volatility is breaking the pattern to the downside.
That's not a good sign.
Maybe a bull trap for bitcoin.
Don't forget to push the like button. Thank you.

Maybe a bull trap for bitcoin !Price action is going up but OBV, RSI and MACD indicators are going down.
Maybe a bull trap for bitcoin.
Don't forget to push the like button. Thank you.

Falling wedge pattern for bitcoin
Falling wedge pattern for bitcoin.
Bitcoin goes up and then go down to retest the trendline and then goes up and break the yellow line.
We can go long to 35833.
Don't forget to push the like button. Thank you.

Inverse head & shoulder for bitcoinInverse head & shoulder for bitcoin
Target zone : 30777
Don't forget to push the like button. Thank you.

