Newb prediction: €60k Euros ATH within two weeks.Is there a trend in the correction? During the two previous events where BTC hovered at a support level, both events lasted approximately 7 days and then BTC took off for another run, if there is a pattern we may see one more day with BTC struggling to get past the resistance level of €50k euros but by the 23rd March with luck BTC may return to recent velocity and potentially hitting a new world breaking ATH of €60k euros before mid April.
BTCEUR trade ideas

Bitcoin is in a symmetrical triangleBitcoin is in a symmetrical triangle
Bitcoin bounce down to the 0.65 Fibonacci line.
And now we are bouncing up again.
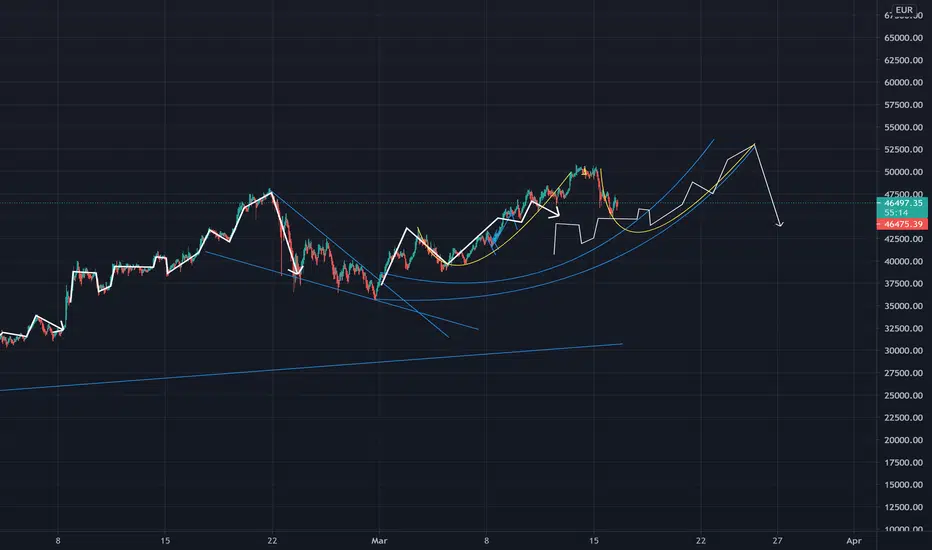
It's holding at the yellow trendline.
Maybe we still go down to the 1.618 Fibonacci line. We shall see.
Don't forget to push the like button and don't forget to retweet. Thank you.

Bitcoin direct options in te next few 1H candels we have a few bulish options before it wil get bearish on the short term.

Big dip at 58000 euroHere is what I think will play out when the next big correction happens, which still looks like will happen on march 25th. If it gonna play out similar to the previous big correction. We now will have a slow run up to the march 25th if no bigger update or news happen that cause bitcoin to hit the crash line earlier we will still expect 25th be the day we see the big dip. The last few days of lows we could see where most of the support lines are and combining with some of the data of the previous run I think this be a possible scenario.
25th of March we will hit 58000 euro and start the decent down
26th due to contracts ending speed of fall increases
27th hit bottom at 49000 - 48000euro
28th we will get a small recover going up after people buying back after hitting bottom
29th Hit next bottom of 47000-46000
30th start rise because next day many crypto have updates on 31st
31st and 1 april be going up and depending how fast we go up we could see the start of next run up or if not will will go down
2nd April if still going down hit 46000 before going up again, to start the next run up to April 27 and hit 68000
I personally set a limit sell a alarm at 57000 and also a limit sell at 57900, after that I suggest keep eye on bookings list and depth to see where most bookings for it to dip down to.
Extra tip Never be too greedy when setting your limit for buy or sale, if you set at precisely with large volume of booking there are chance you might only get a partial sell so I alway set the slightly lower to make sure it get sold and set buy limit slightly higher to make sure have a buy also.

Bitcoin has another pattern : bullish pennantBitcoin has another pattern : bullish pennant
If we break out to the upside : 54521
If we break out to the downside : 41479
Don't forget to push the like button. Thank you and don't forget to retweet also.

Diamond pattern for bitcoin.Diamond pattern for bitcoin.
Normally more bearish sign.
Price prediction : 43078
But if we break out to the upside : 55505
Don't forget to push the like button. Thank you and not forget to retweet.

The total EUR Crash? EUR/SATS ChartIf you look at the EUR/SATS Chart you realize, fiat is trapped in a never ending downward spiral. Do we achieve 1SAT = 1EUR in 2030?

Bitcoin € 55k end of MarchSeveral methods point to a rise to 55.000 euro on 31 March, unless suddenly there would be regulations (which, short term, hasn't got a chance I'd say). I have made this graph on the 1st of march and until now it has tracked it perfectly.


Inverse head & shoulder for bitcoinInverse head & shoulder for bitcoin
My price prediction : 50455
Don't forget to push the like button. Thank you.

Bitcoin making higher high and higher lowBitcoin making higher high and higher low
Bitcoin shall break to the upside.
In a couple of weeks bitcoin shall have a big move to the upside.
Don't forget to push the like bottum. Thank you.

Now the stochastic RSI shall break to the upside again !!!!!!Stochastic RSI on the weekly timeframe for bitcoin :
Every time the stoch RSI get above the 20 bitcoin get a strong bounce to the upside.
Now the stochastic RSI shall break to the upside again !!!!!!
Don't forget to push the like button. Thank you. Greetings.

BTCEUR breaking out or heavy pullback?Right now you cant really rely on indicators because its again very volatile. 4hr chart looks good but overbought bigtime. Daily seems ok so far, stoch rsi nice at 55.
What you think, breakout or breakdown?

Update BTCEUR Experiment - Zooming outWave pattern randomly-but-not-really-randomly applied, starting exactly one year ago. I just try to feel it. And because the pink waves just made a ping, I'm putting my trust in Plan B. Indicated targets are for the coming wave, although I would be very surprised if we actually go to 160K EUR.

Supports for the next big BTC correctionSo last few days dropping down could be seen as test where the support line would be, so that about 45000euro and did not fall down further and next big dip would also not fall beyond that. The timing of the next dip really depends how fast we are going to hit that red line, but most 25 days upwards trend happened for the last two dips, most likely this time would be the same and see the start of the dip happening on March 25th and lowest it could drop be 45000euro which is around 54370usd.

W-pattern for bitcoinW-pattern for bitcoin
My prediction : 50500
Don't forget to push the like button. Thank you.

BTCEUR 1hr possible short bounce?All indicators shows bearish so this could be again a short bounce in my opinion. Whats your thoughts?
(Im a noob, just 2 months started selfstudy ta/fa so be gentle with my thoughts ;)


Bearish pennant breaks out to the upsideBearish pennant breaks out to the upside
My prediction : 48127 or 48685 euro
Don't forget to push the like button. Thank you.

Bearish pennant for bitcoinBearish pennant for bitcoin
If we break to the downside : 44747 euro
Don't forget to push the like button. Thank you.

Huge parabolic curve setup today!We see the start of a huge parabolic to push out to the next top before we see another big correction. We hit about 43000euro or 51000 usd before we start to move up again.
Same patterns almostBreaking up the pattern with out the pump of tesla and media promoting it, we can see most of the patterns is similar, so next few days can expect how bitcoin would move

