BTCEUR trade ideas

btceur one more week of chances to sell before parabolic crush Similar to March there will be a one week window to sell before the parabolic crush will start, that will be worse than in March.
In March it was just a psychological crush - fear from uncertainties...
Now there the real effects of lockdowns with millions of bankruptcies worlfwde will be visible.
As well
-no vacin till end of the year
-new lock downs
-oil war of Saudis with Russia
-NoDeal Beexit
-US election

Current trendline confirmed, for now!Hello wonderful person!
Hoper you have had a great & safe weekend.
There was a sharp correction and test on the BTC price happening yesterday, but the current trendline held.
We might see another correction, but if so; the trendline should still hold.
The indicators are still strong, although they are showing some loss in strength, but still strong.
There are two things I changed on the chart:
- Extended the fib retracement to match current top.
- Extended current trendline in the same angle, in order to capture current and future price actions.
PS
Just because indicators show a continuous strength, with a possible correction. There might come news in the media that can instantly shift the course any direction.
Therefore important you keep yourself updated at all time, stop losses in place; and only trade what you can afford to lose.
Have a great day, and happy trading!!

BTCEUR 22 NOV 2020 1036 hrs (chasers lose)Trend analysis versus range analysis.
Price moves in waves, not strait lines.
You can see the two key potential supply/profit taking zones. You dont want to buy when the CO is selling. Where does the CO sell? Where does the CO buy?
Buy low/sell high right? If you miss it or it fails to meet criteria, depending on your personal risk tolerance you let it go.
A good rule of thumb if in teh learning process: Do not enter a trade as soon as you open your chart. Assume you missed the move. Wait for profit taking to cease and for price to come to you. If you chase it, 9/10 times you will lose.

BTC still in ascending channelJust a heads up for the people that think BTC will fall down, it most likely won't due to the fact that It has to break major support.


BTCEUR 17 NOV 2020 0004hrsWaiting for pullbacks as per sop. Uptrend. Nearing a previous resistance (red horizontal).
Avoid buying when SM is selling. Where might SM sell? Resistance, Supply zones, untested new high ground etc.
Buy low/sell high.

Massive breakout, new fib retracement drawnedHello Wonderful person!
We saw a very good break out and turned the resistant line in to proven support line, which is awesome!
There are a couple of concerns with some indicators that momentum is fading off, but lets see if there will be more strength added this week. (dont forget to check the RSI).
Interesting pointers are the new fib retracement that almost perfectly matches the new support line, and the current trendline is holding.
It is not unheard of that we might see a correction down to the next trendline, around 12500 Euro.

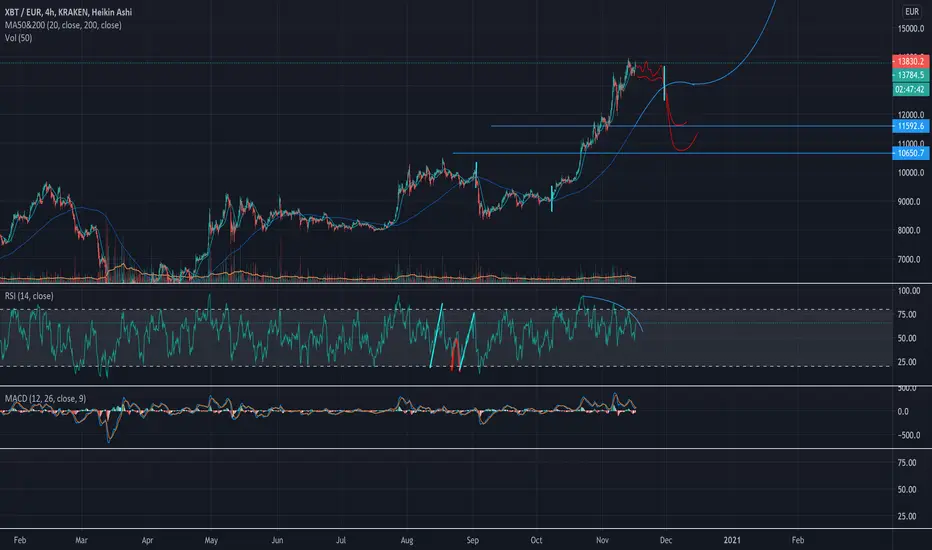
BTC Near Term Looks like momentum is slowing down based on lower highs on RSI (4 hours) and backtesting previous patterns on the 4h chart.
I'd expect choppy action to continue for while (further relief for ALTS), followed by a sharp 20% selloff as soon as price converges with the 200 EMA.
2 levels I'm looking at are €11500 and €10600.
(Not financial advice. Just some ideas. :)

Break trendline or break resistant line?Hello wonderful person!
Now it is breakout point one way or another.
Either the current trendline will hold and the resistant line is broken.
OR current trendline is broken and resistant line is holding, which means next price is 12200 Euro; but might bounce at 12950 Euro (depending on the strength)
My indicators point more towards a correction, and we will bounce at 12960; and might continue to the next trend line at 12200 euro.
Have to wait and see what the indicators tell at that time.
What is yours?
As always, stay safe and sane,
happy trading all!

btceur 50 days of bitcoin being above 10000 ends 10th decemberLast times Bitcoin were above 10 000 it was no more than 50 days.
This time the 50 day period ends on 10 december.
If this will hold most possibly we will have a new rally to 40 000
Otherwise the crush to 4000

Current Trendline closing in the tough resistant lineHello wonderful person!
I am trying out a new way of delivering messages in the articles by having more text and symbols in the chart itself rather than writing them in the article.
Hope it will be a more efficient way, but I am open for suggestion in the comment.
Small conclusion about a key factor I am watching now, is the wedge between resistant line and the current trendline.
One way or another, we will have a breakout from this in the next couple days (within this week).
As always, please stay safe and sane in these times and happy trading!

BTCEUR - break-out from bullish triangle 15.4k as targetWe are currently retesting the top side of the triangle at 13350€. Waiting for a confirmation above 13400€ with sufficient volume to open a LONG position. This break-out could lead to a continuation move to 14400€. If we break to the downside, we will have to re-evaluate the situation.
Good luck! And of course, this is not a trading advice.

correction to 12000 euro?Hello wonderful person!
Incredible rally in the stock market due to vaccine news, and this might hold up to end of december.
Bitcoin reacted as with gold, it took a hit.
Based on the chart, there are some spinning top and a doji forming, which could form a correction.
If that happens, we could look at a price target at around 12000 euro, and if it is still a bull run; this will hold.
If that 12000 breaks, we are looking at a further decline to possible 11000 euro.

