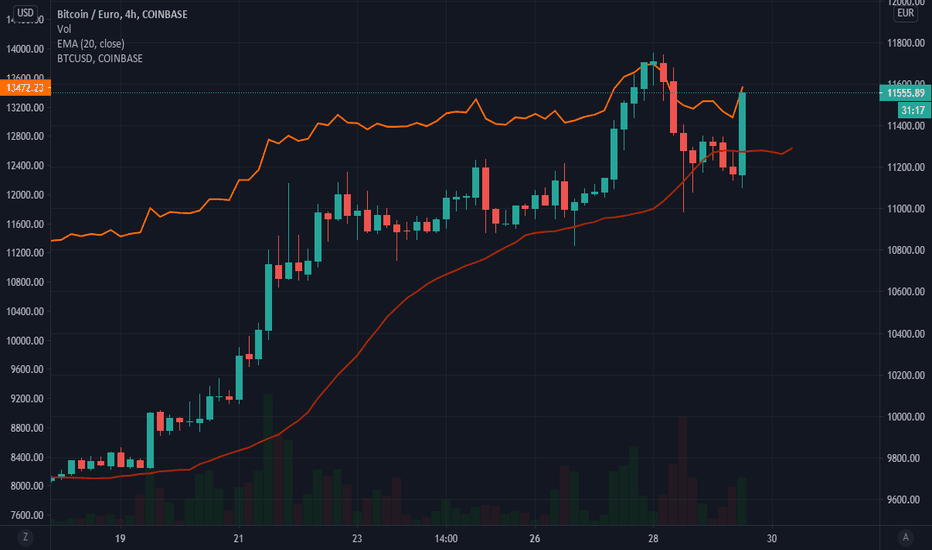
correction to 12000 euro?Hello wonderful person!
Incredible rally in the stock market due to vaccine news, and this might hold up to end of december.
Bitcoin reacted as with gold, it took a hit.
Based on the chart, there are some spinning top and a doji forming, which could form a correction.
If that happens, we could look at a price target at around 12000 euro, and if it is still a bull run; this will hold.
If that 12000 breaks, we are looking at a further decline to possible 11000 euro.
BTCEUR trade ideas
Reputation points needed to participate in chat
Hello everyone,
I joined tradingview a few days ago and just want to get some points so I can join live chat as this are very exciting times for crypto and BTC especially and as a complete noob I have a lot of questions which I would like to ask in chat on the go, to help me better understand price movements. Wanted to attach an image of my current "analysis" or rather practice of predicting BTC-EUR direction, but it wouldn't let me... So maybe next post.
Thanks and have a good one!
Edit: Just saw that it does attach my chart also, so yeah. #first_post_problems
RSI Divergent, is BTC in for a correction?Hello beautiful person!
I am up tonight watching the U.S election and witness live the effect it will have on the BTC during it.
If you have read my previous posts, you know I have been writing about a second wave of the virus and lockdown; which will in turn affect the market negatively. I expected the second wave and more effect in September/October, so it seems I missed it there in months; but at least in Europe we are in a new lock down.
How will this affect BTC?
I believe that BTC is still correlated to the stock market in the sense that when we have a sell off in the markets, we will also have sell off in BTC.
However, BTC will gain again shortly after.
Short term bearish, long term bullish.
- check the chart for more info and trend lines.
- check the divergent in RSI.
- added fibonacci retracement indicator for the last "bull run".
Have a great night everyone, and stay safe!
The two most two likely scenarios for BTCSince we closed above the 2019 highs, it is very unlikely that we fall back below that levels again, at least not in the immediate short term. It seems obvious that we move higher. But it would be equally unlikely that we wouldn't re-test those levels in the near future. The question is now, from where we might retrace. The RSI is still looking good and leaves more space to the upside, so from my point of view, scenario B seems more plausible. Looking forward to your comments.
Up as long as we don't break downJust for personal reference
As long as we don't break the first down target at 10.987 we remain bull
As soon as we break down target 1 but don't break down target 2 at 10.477 we are in doubt
As soon as we break down targets 1 and 2 we turn bear
Target list
Down 1 at 10.987
Down 2 at 10.477
Up 1 at 11.763
Up 2 at 12.952
Up 3 at 16.324


