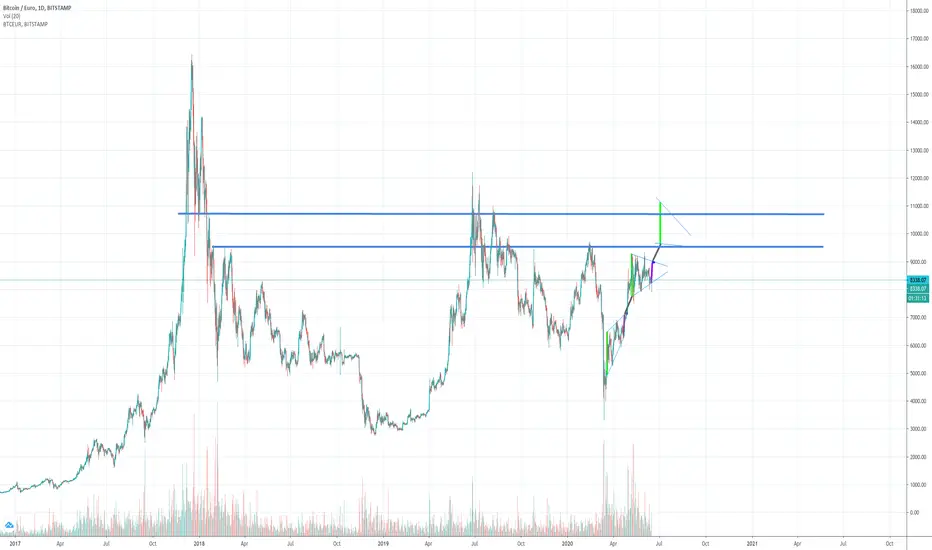
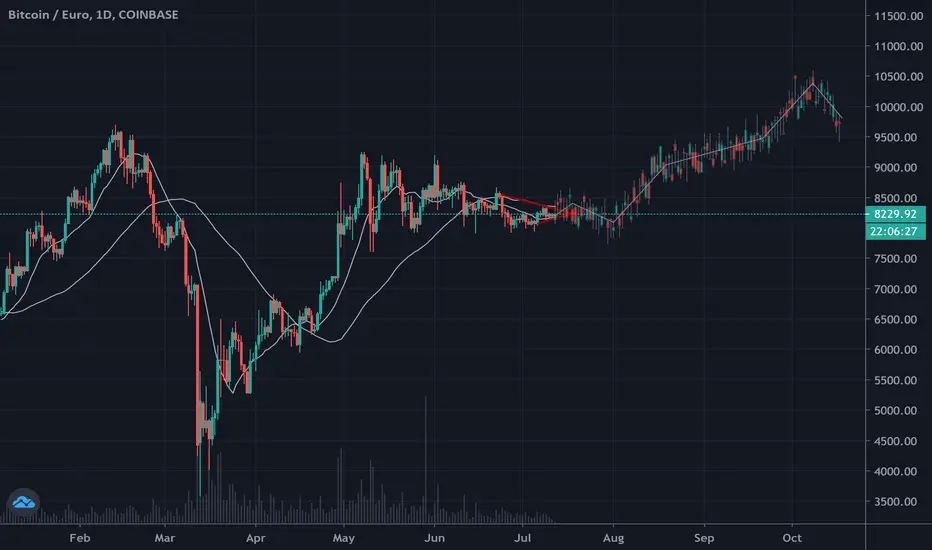
BTCEUR Sitting At 8500.After rolling down on HL's, the BTCEUR is now steady at 8040. My Analysis In my view, something similar happened on 03 Jan '20, and if I connect that historical sequence then a bearish map shows that travels to 5000, but, 8913 is interesting .Shortby KhiweJul 5, 20202
Same BTC, but different pair...Looking at things from a different view can always help! BTCEUR is trading in a range just like BTCUSD but not as many fakeouts here and much more horizontal! The bottom of mid-term range where BTCEUR is currently sitting (7900) can break soon since there is not much liquidity left, we may see a free fall like previous times to 5k area (6k on BTCUSD) or even lower (somewhere around 3k) if it doesn't hold. On the bullish side, we can expect a new ATH, if BTC breaks out of the resistance zone (blue area).Shortby RezzaHmtJul 5, 20209
BITCOIN/EUR IN 01HOUR BITCOIN / EURO on a downtrend and it shows on the pitchfork indicatorby bachirseftaouiJul 4, 20204
Schort that thing to death :DSchort that thing to death :D You see the Hanging Man?Shortby bubblefoxJun 26, 2020115
BTC potential retracement sometime from the middle of Sept 2020If the pattern holds firm , we could be looking at a frice of €8k ish sometime by the middle of Sept, with a potential retracement back to a low in and around 4K , that is on the basis of BTC doing the unpredictable by shooting to the moon pefore that by EndaKeaneJun 25, 20208
BITCOIN / EUR ON DAilyhello everyone, BTC EUR on a range since May 01, may have a change of position in the coming days.Longby bachirseftaouiJun 20, 20204
BTC ASSETT w/ BEST Performance: Covid19 Impact (5 Year) (Bitcoin as a Deflationary Asset or Inflationary Index) note: Stock market liquidity boosted by FED Stimulus == increase Inflation Gold Safehaven to BTC by pbc666Jun 18, 20208
BTC/EUR, the price is about to explode to the moon.Bitcoin to Euro is currently trading in the range market. In case we made it to the upside, that will be very bullish sign. Longby forexmastersacademyJun 16, 20201113
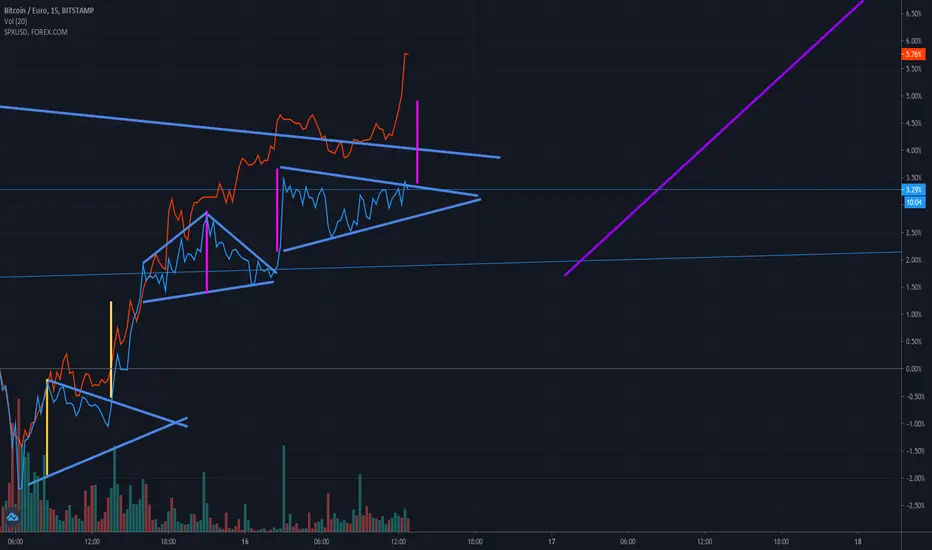
Bullish BTC IdeaRecent bullish run so momentum is bullish. Rising triangle formation is bullish. ETH and a few other cryptos also look bulish.Longby bigbear92Jun 16, 20203
CONSTANT PROFITS(KP)SO I GOT PROVEN WRONG..LOL But the profits stayed constant!Longby Investor_PhilipJun 14, 20204
long short term btcpossible fib retracement followed by a upward movementLongby INSANEMOANINGJun 13, 20204
BTCEURVEO UN PUNTO FUTURO DE MITIGACION EN TEMPORALIDAD DE UNA HORA, PARA CONTINUAR CON UNA VENTA PROLOGADA. VELA INSTITUCIONAL EN VENTA EN ESTRUCTURA ALCISTA EN DIARIO Y 4 HORAS.Shortby SolnacienteJun 12, 20204
perfect rejectionHello wonderfully wonderful person! Stock markets all over have seen a large pullback. Maybe more investors have awaken and smelled the coffee? Time will tell on how the market will react now. Will it be the emotion fear that will trigger more downfall or the emotion hope that will set the market upward? Anyways, back to BTC; and it seems to be very connected to stock rather than gold as of yet, since gold I believe saw a minor upward price action. The indicators were showing a weak momentum for some time now with the horizontal movement, and it was just waiting for some nudge to either regain momentum or fall. The latter happened and let us see how far it will fall, but we have some well tested and strong support lines shown in the chart. Mind you that these will not hold if the emotion in market is fear, so dont put too much faith in these support lines. For my part, it is still too volatile and it might be that the rest of the market is catching up with the belief that the world is not yet recovered and that will keep lowering the price in market. Or this sell off is a short lived fear and people will rush in to the market to pickup more. who knows at these times, so I will be waiting a little longer on the side line with my pocket filled with some fiat, waiting for a good moment. Like i mentioned in my previous post, September or november is the turning month for me about being bull or bear. PS I am still holding BTC and stocks and have not sold out, but have sold off some in order to liquidate to have some cash at hand; in case further fall. Keep safe out there and dont invest more than you can afford to lose. by egilagreUpdated Jun 11, 20205
fake break out and sideways trading, what now?Hello hello wonderful person! What an interesting week it has been, where we have seen a fake breakout above the triangle; and now we are in horizontal move. So the market broke out of the trend line, that was just a matter of time really, but it did not break out on lower or upper side. Rather the price is trading horizontally and perfectly aligned with the volume trade profile. This indicates a very strong support line at current price, and what is left to see is the momentum; will support hold and go up or break. To check more into that I look at the: - RSI: It was in a downward trend in the daily chart, but might be moving upward. It all depends on what it will do the next two days. On the 4 hourly it is showing a sideways trend. Even when switching to Heikin Ashi, the RSI does not change much, and one should remain cautious to RSI in a sideways market. - MACD Not much to say here except it shows weakness, but a little better on the 4 hourly rather than the daily. Heikin Ashi did not reveal anything big here either. - 100 and 200 MA The 100 MA is underneath the 200 MA in both 4 hourly and in daily - Market Cap The overall market cap has not moved at all the last 7 days, and barely on last 14 days on the upside. So what? well, the market have experienced a massive upside lately; but it is not shaking my theory about delay effect aka wave 2. It is after summer and probably around September that I will make my own call about strategy ahead, based on financial numbers in September. Still believe BTC will climb this year, so I will probably look for an entry point soon for DCA (Dollar Cost Average). To sum it up... I am cautious. PS I am also looking into some of the ALTS, one in particular: ETHER. Stay safe out there and thank you for reading my ideas.by egilagreJun 9, 20204
Gráfico de Bitcoin / EurGrafico que muestra un triángulo simétrico en la tendencia de BitcoinBby rulobitJun 8, 20203
So Yea I think it`s going to dump nextJust some parralel lines,fib levels and support&resistance levels.just a beginner and this is what my chart looks like. A picture says more then a 1000 words www.upload.ee If you find it useful at all hit like.Shortby JackH8Jun 6, 2020115
Consolidation Area In the last month, BTC is in a consolidation area. The trend can be characterized as a bull due to the fact of positive EMA(20,50,200), but nothing can exclude the potential of an abrupt reversal. Hint: it perfect time to consult the Bollinger Bands. by pistolero41Jun 6, 20207