BTCEUR trade ideas


BTCEURVEO UN PUNTO FUTURO DE MITIGACION EN TEMPORALIDAD DE UNA HORA, PARA CONTINUAR CON UNA VENTA PROLOGADA. VELA INSTITUCIONAL EN VENTA EN ESTRUCTURA ALCISTA EN DIARIO Y 4 HORAS.

perfect rejectionHello wonderfully wonderful person!
Stock markets all over have seen a large pullback. Maybe more investors have awaken and smelled the coffee? Time will tell on how the market will react now. Will it be the emotion fear that will trigger more downfall or the emotion hope that will set the market upward?
Anyways, back to BTC; and it seems to be very connected to stock rather than gold as of yet, since gold I believe saw a minor upward price action.
The indicators were showing a weak momentum for some time now with the horizontal movement, and it was just waiting for some nudge to either regain momentum or fall.
The latter happened and let us see how far it will fall, but we have some well tested and strong support lines shown in the chart.
Mind you that these will not hold if the emotion in market is fear, so dont put too much faith in these support lines.
For my part, it is still too volatile and it might be that the rest of the market is catching up with the belief that the world is not yet recovered and that will keep lowering the price in market.
Or this sell off is a short lived fear and people will rush in to the market to pickup more.
who knows at these times, so I will be waiting a little longer on the side line with my pocket filled with some fiat, waiting for a good moment.
Like i mentioned in my previous post, September or november is the turning month for me about being bull or bear.
PS
I am still holding BTC and stocks and have not sold out, but have sold off some in order to liquidate to have some cash at hand; in case further fall.
Keep safe out there and dont invest more than you can afford to lose.

fake break out and sideways trading, what now?Hello hello wonderful person!
What an interesting week it has been, where we have seen a fake breakout above the triangle; and now we are in horizontal move.
So the market broke out of the trend line, that was just a matter of time really, but it did not break out on lower or upper side. Rather the price is trading horizontally and perfectly aligned with the volume trade profile.
This indicates a very strong support line at current price, and what is left to see is the momentum; will support hold and go up or break.
To check more into that I look at the:
- RSI:
It was in a downward trend in the daily chart, but might be moving upward. It all depends on what it will do the next two days. On the 4 hourly it is showing a sideways trend.
Even when switching to Heikin Ashi, the RSI does not change much, and one should remain cautious to RSI in a sideways market.
- MACD
Not much to say here except it shows weakness, but a little better on the 4 hourly rather than the daily. Heikin Ashi did not reveal anything big here either.
- 100 and 200 MA
The 100 MA is underneath the 200 MA in both 4 hourly and in daily
- Market Cap
The overall market cap has not moved at all the last 7 days, and barely on last 14 days on the upside.
So what?
well, the market have experienced a massive upside lately; but it is not shaking my theory about delay effect aka wave 2.
It is after summer and probably around September that I will make my own call about strategy ahead, based on financial numbers in September.
Still believe BTC will climb this year, so I will probably look for an entry point soon for DCA (Dollar Cost Average).
To sum it up... I am cautious.
PS
I am also looking into some of the ALTS, one in particular: ETHER.
Stay safe out there and thank you for reading my ideas.


So Yea I think it`s going to dump nextJust some parralel lines,fib levels and support&resistance levels.just a beginner and this is what my chart looks like.
A picture says more then a 1000 words
www.upload.ee
If you find it useful at all hit like.

Consolidation Area In the last month, BTC is in a consolidation area. The trend can be characterized as a bull due to the fact of positive EMA(20,50,200), but nothing can exclude the potential of an abrupt reversal.
Hint: it perfect time to consult the Bollinger Bands.


False breakout BTC had the 4th false breakout last night and lasted less than one day from the long term downtrend support line on weekly chart. That’s bearish indicator to see 4th false breakout. I still don’t see the possibility to break from the very long downtrend on weekly chart. Saying so, I’ll keep monitoring to see a stronger breakout on weekly chart to confirm uptrend.

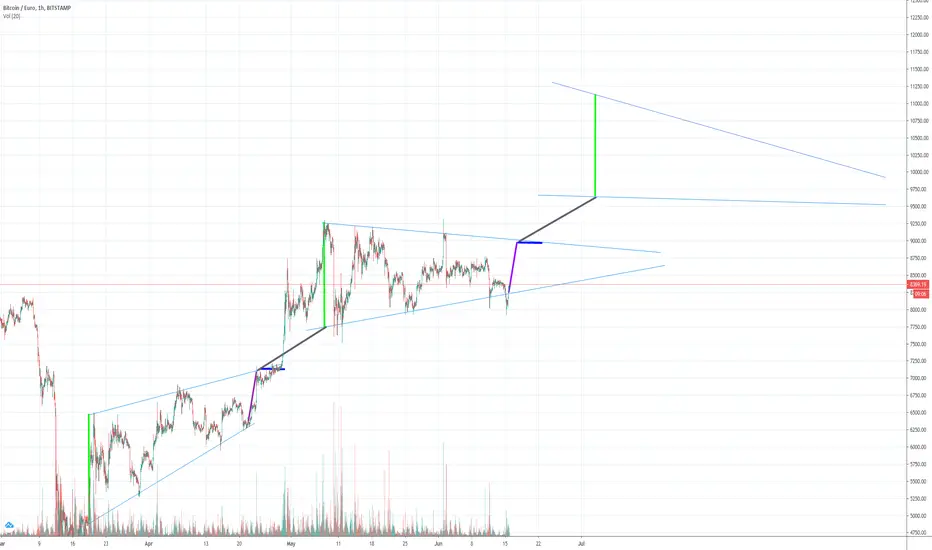
Next is a break out regardlessHi there wonderful person!
So, next week we will either breakout on the upside; which means that the price breaks the long tested triangle.
Or we will break out on the down side, which means the upward trend is broken and support line of 8058 will be re-tested.
It is not unthinkable that we could revisit the 7772 support line, if the 8058 does not hold.
Personally, I am eye-balling the support line at 7040 for an entry, but will see if I am not dollar averaging something in on the 7772 as well.
A short message from me today, but wish you all the very best and as always: stay safe out there!

Bitcoin Diamond....but not that shitty coinI know some chart formations, but could this be the rarly seen diamond formation ?
I was one of the #coinvestorarmy I NEVER WOULD SHORT BITCOIN, not for a minute, not for a day, but if this is a diamont formation, we can but some more cheap coin
Learm more about the diamont formation:
www.investopedia.com
Invest smart !


I need your helpHello, I would like to reach level 5 reputation in order to be able to chat with others on live chat so that I can learn and ask the right questions. So I made this chart, but I don't have a lot of knowledge. This is why I would like to be able to chat with other traders on live chat. Thank you .


RENKO TURNING REDBreaking 100D EMA on Renko chart will certainly activate many bearish signals ...
Let's watch this one carefully.

This is tense, but probably going to dipHello wonderful person!
It has been a while since my last post, but nothing fundamental has really changed. We are still within the triangle,but in the upper region none the less, an overall upwards trendline is still holding.
What is really interesting now is if that upper trendline (marked in gold) is going to hold this coming week.
Changes
Added trendline on RSI, Stoch and CCI
Added VPVR
Conclusion
The RSI, Stoch and CCI are showing some signs that the momentum is not that strong, and in combinations with the stock market; I believe we will see a dip in the BTC/Euro price.
The dip will retest 7038, and let us see what happens after that.
when it comes to my own plans in these times, nothing changed from my previous posts, I have already liquidated some parts of my BTC holding in waiting for a dip, and I am patient.
Probably will pick up some at 7038, but checking to see if it holds before entering.
I have been writing about a second financial wave (downward wave) coming, and still believe it is coming and we are seeing the very beginning of it now.
Since BTC has not yet been decided as a safe hedge, I do not know how BTC will perform during the second wave; but I believe BTC will rise after the second wave has washed over.
PS
For you guys that are going nuts about the behaviour of the stock market, and it is not really acting logically to what is happening in the market. Prices not reflecting the actual market, gold going down, companies that are hit hard by lock-down are still having increase in stock price, etc...
There are three things I have noticed that I want to share with you great guys, and take it for what it is; just a theory!
Traders selling good performing stocks to cover their losses . One of the cardinal rule in trading is to be in the market one way or another (can be in currencies or other assets). One way of doing that, other than bringing more fresh cash, is to sell assets that you have profit on to cover the losses you had. You never know when those performing assets go down, so it is important to take out profit when you can. This can result in safe harbour assets such as gold can drop in price, or hot bio-tech companies drop in price.
Fund Managers are obliged to rebalance their portfolios to keep the asset allocation and exposure to risk correct to their fund profile . This is kinda related to the one on top, but fund managers sit on HUGE amount of value and when they start to rebalance their portfolios to cover losses or to keep true to their fund strategy, it can really affect the price in markets. What is fund strategy (asset allocation) to do in this? well, let us say that a fund has a strategy to be in 60% stocks and 40% bonds. If that fund have hit a golden goose and have great return on some stocks, it will have to rebalance in order to keep within 60-40 strategy of their total asset holding value.
Stock market is based upon beliefs and feelings, and not logic. Also it is not reacted to the current time, but what they expect in future. The market is a place for feelings, and additional guessing what will happen in the near future or long term future. These estimation of the future will constantly be re-valued by the current news but will not necessary act on it the way it logically might seem to be doing.
Monetary stimulus like new money being printed and thrown into the market like in US. The Fed buying up all it can, regardless if it is a fallen angel or what have you. This will give impression the market is holding, when in reality it is a facade.
As always guys, stay safe and may the trading be with you!

Bitcoin, where to stack up + important levelsIt all started with bitcoin, but it will not end with bitcoin.
getting this out, I see bitcoin getting pretty bullish in the future.
As I have most of my assets in altcoins, i'm looking to get a little bit more of the digital gold to.
In this Chart you see where I will be buying/selling.
Let me know what you think, and if you're also stacking up, leave a like!


