Breaking PointWith 10 touches of this level and the approach towards the end of this choke of the triangle, we are eagerly awaiting a break upside or downside for BTC. We could see a late year end bull run, or even midway through January before anything gets rolling. That is if we break downside FIRST within the last few months of this year.
BTCGBP trade ideas


BTC price chart spoked wheel pattern emerging.Viewing the daily BTC GBP chart since the ATH 2017, I noticed a pattern emerging that has ZERO to do with any currently known or observed market/price movement,
so I would consider this utterly random , and to be viewed entirely as co-incidental and NOT as any kind of realistic price action.
THIS IS NOT TA or any attempt at any meaningful or established TA, so please please keep any rage to yourself regarding this chart image.
Ignoring ( for the most part ) the outlying ATH spike, it appears the rallies price/time angles lead back ( visually ) to a -6000 GBP figure.
Spokes in a wheel so to speak, each becoming shallower in angle, and all centered around ( pretty much ) a minus 6000 GBP hub.
Noticing this, I used said hub to project further spokes outward that intersect with the clear downward bear trend line of the last three rally peaks ( near enough ).
The 'hub' of the wheel is not a pinpoint, but a hub, a circular area you could equate visually to a hub in a wheel, it has mass/volume.
Yes this is a 5yr old childs mindset, playing with crayons and the human propensity to see patterns where none exist, but still kind of interesting.
I have placed two dated prices ahead of time, just to see if this pattern plays out.
There are far too many outside factors going on in the crypto-sphere to give these figures ANY validity, but it will be interesting to see if the
'spoked pattern' plays out none the less.

Multi fiat charts against BTC - EURO, USD, GBP & JPYSome positive action from Bitcoin rasies the market spirit and some of the alts too
here is BTC in four of the main trading pairs with fiat
been a nice day for scalping, golden crosses about to form
CoP indy moves bull mode and 7,500 area would be next bull target
looking positive to move up more, will be a slight pullback i expect but nothing to harsh if it does then we will change sides, ez :)

BTC - LONGPulled back from our bearish decline to around 4300.
Broke out of minor resistance at around 4700 and is looking to push up and out.
Currently at 5000-5100 area looking for push at least to around 52-5300.
More of a long term move is through our zone and to the 61.8% level of the fib.

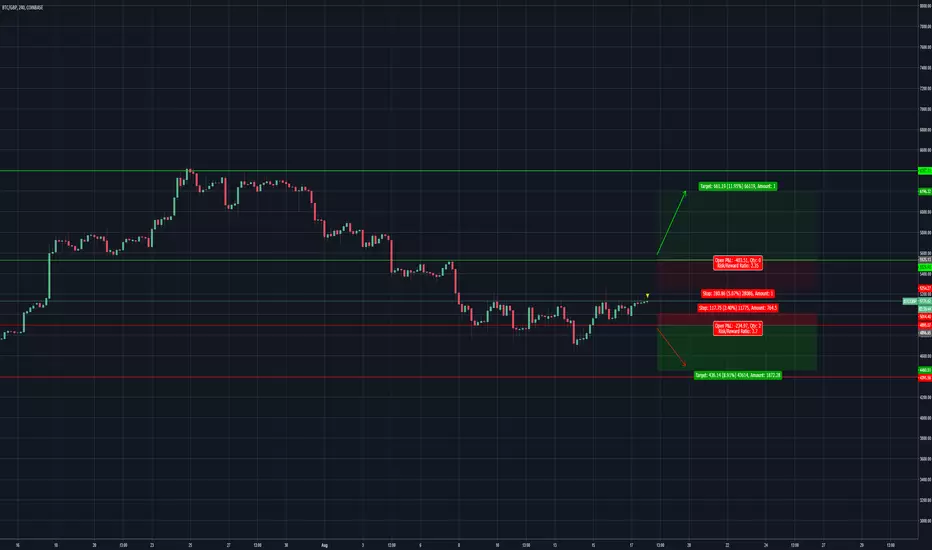
Bitcoin support and resistanceAs you can see the price has respected both support and resistance lines in the past, we will be keeping a close eye on this trade as it could provide a big pip count.
Entry, TP and SL will be provided for our clients once the trade becomes valid. If you are interested in joining us then message us.

BTC movingI predict BTC will move fast, if it does I plan to take profit as swing traders will capitalise the volatility and looking at rejoining the market before the correction, based on my years of experience watching the crypto market in these pullback situations
MomentumA lot of people watching BTC right now, If it moves soon, I think you we'll see a few green logs here or a steep drop to long term resistance of bottom support line

Short-term view on BTC from a new guy..Just from a basic level of chart viewing, seems to me the short term (1-5 d) top and bottom continually tested... a breakout toward lower is (in my opinion) what charts show BUT i feel that momentum/flock trades and their impact in coming weeks/months influence me to Buy.
BEST OF LUCK - To all!
PS. My thanks to James Winsoar for his guidance and helpfulness! Follow him would be my suggestion.....

Multi Fiat Bitcoin charts GBP, USD, JPY & EURO 6th Aug.18 [BTFD]For the week starting 6th August 2018
Quick overlook of the main crypto fiat pairs (minus KRW)
All charts seem to be showing a clear market bottom with the CM Williams Vix Fix giving the green lights, showing market bottoms/reversals
price action on both USD and JPY pair have caused the COP indy to go move into bearish sentiment where its still has not moved down on the other two...
the MA cross is looking to form either a golden or death cross, giving us more idea of sentiment for the coming days/weeks
its pretty make and break for bitcoin again this week, some lows of USS$5600 are possible with very strong support, on the upside if we can stay above 6600 support we can start looking towards previous weeks highs of 8200-8500 (USD) - the levels should be easy to convert if your using a different fiat pair
have a powerful week and any questions please leave in comments below

Coinbase accepts fast £GBP deposits [FPS] for Bitcoin...Some progression in the UK at last for buying cryptocoins...
the best site to buy crypto in the UK was cryptomate.co.uk (still has WAY more than ANY other!)
now Coinbase has opened up the Faster Payments System with the UK banks so you can now instafund your Coinbase account with very little waiting time!
ETC will be added on the 7th August
you can sign upto coinbase here: goo.gl (fee free trading and withdraws)
------------------------------------------------------------------------------------
BTC/GBP:
Going to see some more volume on this pair in August and beyond
Charting this so UK buyers can get an idea of levels are targets while the US dollar controls the price still
Seems like we had a Golden Cross form on the 22nd July and the COP moved up into the Bull area a week before that and it produced positive moves towards the last high of £6475, selling pressure has forced it down to the very strong support of the 0.618 fib level just shy of 5600
If this fib support holds then we can see retests of the last high and most likely with current market conditions to fake out and rebound back down to the last 2018 major lows of £4100-£4400, if the fib level breaks we can consider these targets without going to test the last highs
good trades to all, come join us in our chat or leave questions in comments below....

BTCGBP - Coinbase- Simple Strategy: high return, LOW drawdownSame strategy as the related ideas below. ( VERY SIMILAR TO BTCUSD HOWEVER WITH EXCEPTIONALLY LOW DRAWDOWN AND HIGHER PROFIT RETURN )
Currently reading a short signal.. same as BTCEUR and BTCUSD.. no long signal in sight so far
Strategy
Refer to BTCUSD and TRONUSDT related ideas below for detail into strategy, which works well with only high volume/volatile coins.
Summary: All indicators must cross to give a strong buy/sell signal
i.e. fibonacci lines, bollinger bands , macd , rsi must be crossed simultaneously.
PNL = +42.14%
Max Drawdown = 0.89% !!!
6 closed trades in total spanning ~2months (over 21% profit a month!!!)
In short:
BTCUSD vs BTCEUR vs BTCGBP <----- BTCGBP wins :)
BTC-Fiat is signalling short at the moment

BTC 4hr chart. Double Bottom?
Just tapping the support from last weeks low.
Is the Ice going to break?
Probably........
Scale in here or wait? thats the question.......What will the answer be?

£4k bitcoin still in playfeeling a large sense of fomo at the moment but also expecting another big drop very soon that will will open up sub £5k bitcoin buys. patience is key

BITCOIN LONGPatience... Wait for a clear signal to go long. Either a strong bounce from support or breakthrough of support then bounce of a lower level.
USD is still weak and news isn't supporting the strength of crypto at the moment.

BTC descending triangle - look out below. #btc #taThinking about trianlges
This one has broken downwards. Target will be around £4500 not quite the low of February. But edging closer.
Buy the dips gang!

BTCGBP - BTCUSD CLONE WARS -6k on the way?Separating chart patterns to identify trade opportunities?
People tell me it's incorrect to analyse btc with any other altcoin in a separate manner.
Usually one would look at btcusd as one pair. Here is BTCGBP with BTCUSD in the background.
BTC looking about as bullish as a pair of wet socks. It's in a converging diagonal pattern, D1. And it looks way to early to break out.
Yes, a declining converging diagonal or wedge is a bullish pattern, but the price action within is not. If we must name it, let's call it
a mushroom or partly completed declining H&S.
Try to add the DXY overlay to a BTC chart. There seems to be a pattern emerging. See what you think of it.
You could for example select the GBPJPY pair and add the BXY index to the chart as an overlay. Investigate this.

Bitcoin up 10% in a few hours #btc #chartsfinally COINBASE:BTCGBP woke up and did something.
Time to stop shorting the market?

A mish-mash of Trend Lines ... A multi-perspective analysisThis might look a bit complicated to start with - and that's for good reason. Markets are complicated.
Its easy to make something complicated. It's hard to make something simple. I've attempted to simplify what's going on - without looking at chart patterns. These are really good at explaining what's going on, then a breakout occurs either before or after the pattern formed, which means a pattern is simply a language to optimise explain what happened historically, or what's about to happen. I have no data to say how often patterns succeed or fail, which is why I'm sceptical of them.
I've drawn long-term support trends, and mixed them with with shorter-term support and resistance trends. The longer-term trends are browner, and the shorter term trends are greener. The thicker line which represents the sum total of the angles of the uptrends and downtrends (not weighted in any way - which is probably a weakness in my thinking). This makes a clear downward trend for the bitcoin price in the coming weeks/months. Where trend lines cross, there are triangles and quadrants of what I think are degrees of certainty for the price range of Bitcoin in the coming months. I have no idea whether a triangle or a quadrant is significant, or irrelevant in this context. Of course, lines all over the place mean nothing, but I think where more lines intersect, there's a greater chance the price range will fall into those ranges.
As the future pans out, more lines will need to be drawn, and the projection will change.
Thoughts, anyone?

#BTC bullish or bearish? disruption sensor is high.
The technology is very bullish. However the price is bearish.
You didn't think they would allow Bitcoin to disrupt them yet did you?
Learn how to read charts. See Tone Vays for details.


£4k bitcoinself explanatory really, double bottom and then up... £4k could see the push we need to move

