BTCGBP trade ideas
BITCOIN 2022 CHART ANALYSISBTCGBP:
This is a brief overview of BTC price denominated in Pound Sterling, I believe Bitcoin remains in a SUPER bull market, my personal Elliot wave count is marked on wave 5. This means that we currently are in wave 4. My orange dashed trend line is the lowest price bitcoin could retest, although this is statistically low in probability, we must understand price is relation to time.
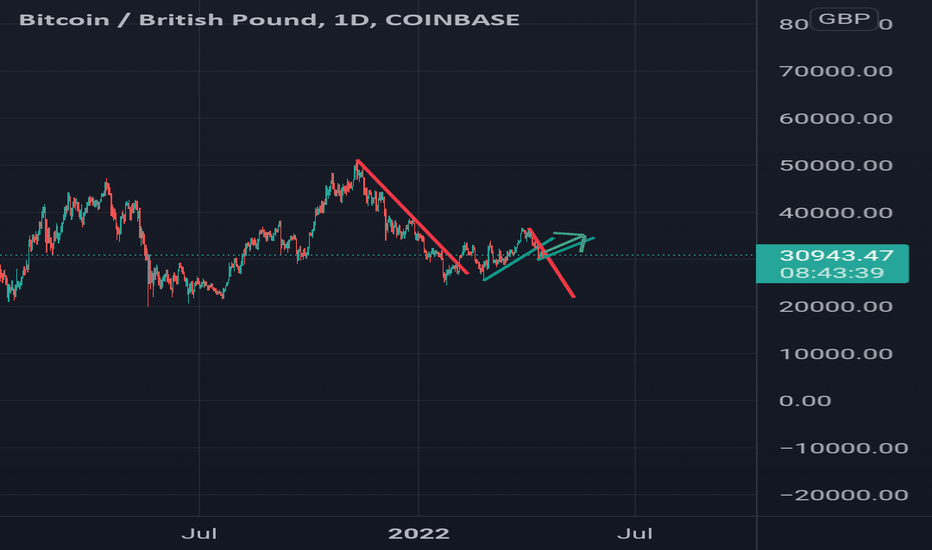
BTC looking strong for the future...Bitcoin is seeing higher highs and higher lows indicating that we are not yet in a bear market. i also believe that bitcoin is about to break out hopefully to a new high due to the extremely low prices which many whales are buying at to hold for a long time leading to a reduced supply therefore causing a higher price.
however, bitcoin may not break out as in march / April interest rates are very likely to increase causing the stock market to fall which bitcoin and the crypto space has started closely following causing them to fall as well. this is because its more profitable and safer to have your money in the bank with no risk gaining higher interest rates than facing risk in stocks / crypto.
due to this bitcoin may not break out till April / may time when it should reach new highs and hopefully $100,000.
BitcoinGood morning traders, do we have any crypto investors on here?
Been monitoring the £30k mark for a while now to begin loading up. Is this the dip to begin buying on before we get back down to £22k?
Where will price go after? Will we see the well awaited push to £100k that many have anticipated or will Bitcoin continue to dump?
So many questions being asked, so many predictions being made from credible people, what will the future hold?
I'd love to hear your thoughts down below!
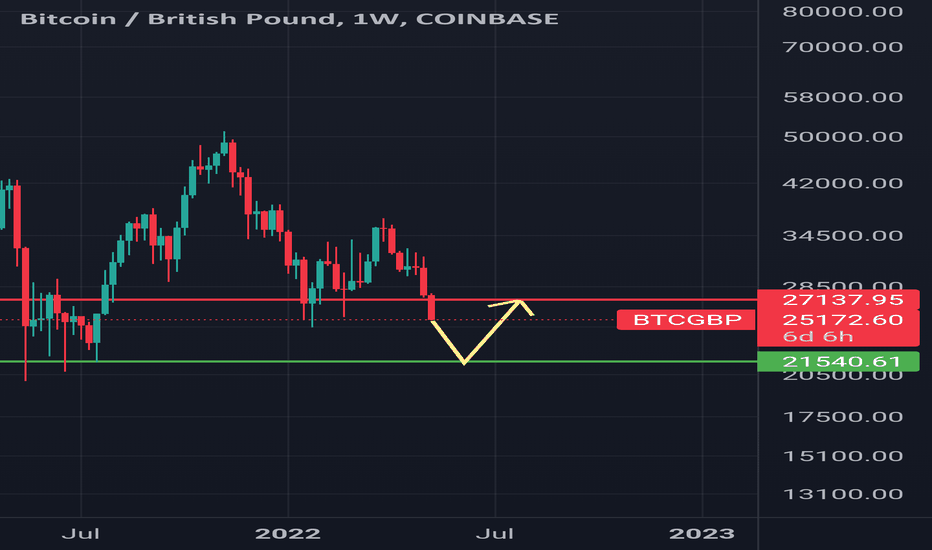
Bitcoin Bearish 2022BTC weekly candle to close between £31K - £25.7K. If bulls do not provide enough momentum to break the new resistance level at £31K. Bears will attempt to bring the price action further down again to the next level of support at: £21K.
Retesting £21K will mean bearish for BTC due to the fact higher highs & higher lows trend pattern being broke.
WHAT CAN YOU EXPECT FROM BITCOIN OVER THE NEXT FEW WEEKSMomentum on the weekly and daily EMA's has recently crossed over signalling an overall bearish sentiment towards BTC over the next few weeks. There has been clear series of lower highs and lower lows and price now appears to be falling towards previously established support located within the 20-23k price range.
The 20k whole number psychological level also coincides with an overall previously established long term bullish trendline and fib 1.1618 retracement area.
Its likely we will continue to see price fall to just below the 20k mark before price begins to stabilise and establish some support again.
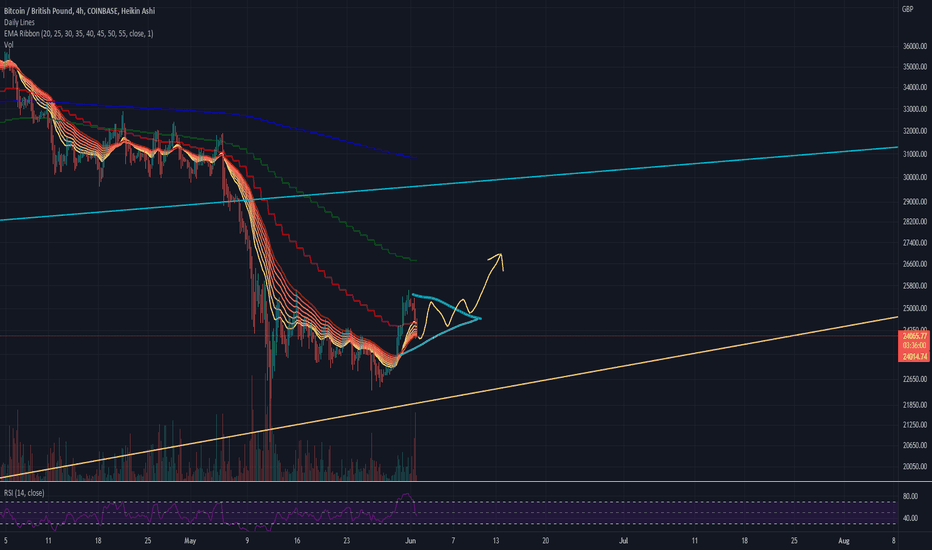
Last bullish movement before bull market opensTriangle pattern has formed on the 30m & 1hr timeframe, expecting a breakout to the low side (following the current trend.) I have set my buy points at $31,000 & $30,500 but if you really want to push it price may hit the September support ($30,200 - $29,600) and that would also be a brilliant buy but a push.
After the price drops more i expect to see an impulsive move to the upside very quickly as we have not seen prices this low in a long while and may never see these prices again.
If you are interested in how and when the big upwards movements will take place check out my idea comparing the April 2021 drop and the current drop we are experiencing now, there are a few interesting points. ( Linked in the related ideas ! )
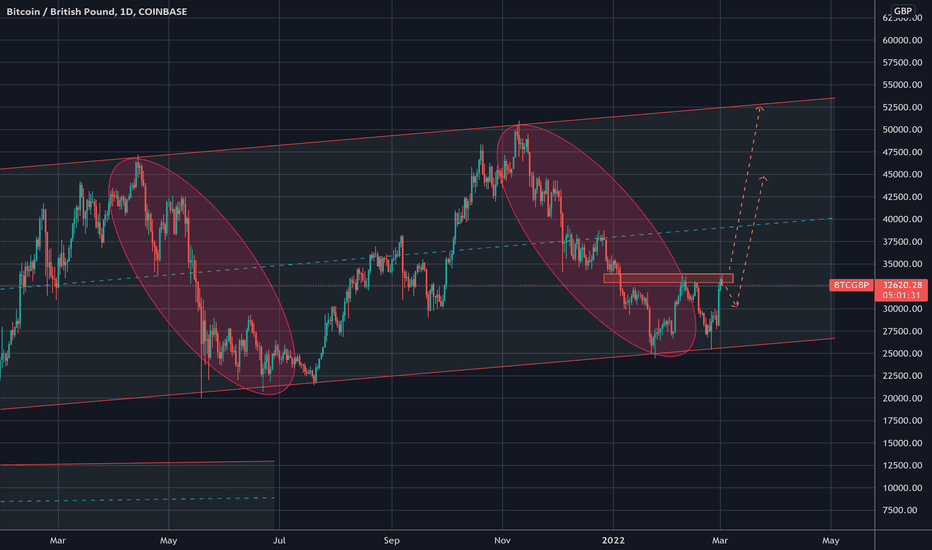
Bitcoin going bullish (April drop repeated)Tell me if im wrong but the market is repeating the april 2021 drop,
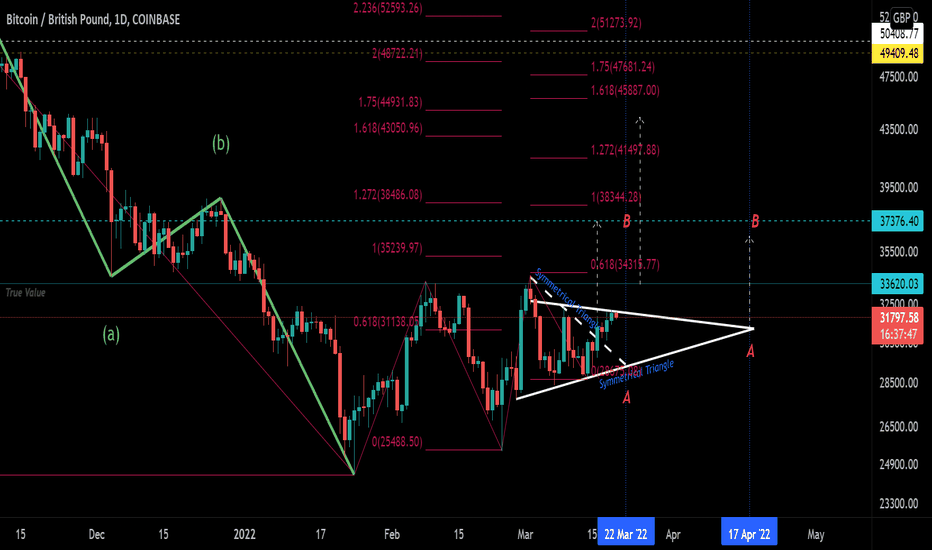
The april 2021 drop of 25000 lasted 96days in total before bouncing up and making all time highs in November 2021 now since November as you could expect the price has been dropping by a substantial amount (16000+ to be more specific). Comparing the time taken and the amount dropped in both drops i have noticed a bit of a similarity (Bare with me i will get to the point). okay so 25000 drop from april and coming up to 17000 drop from november, 17000 is around 68% of 25000 using this i can do (68% of 96days = 66days) and now i have an estimate on how long this current drop will last.
Thats cool to know but yes it is an estimate the real interesting thing is a 66 day estimated drop by the expected 17000 will place you perfectly in line with the current ascending triangle pattern (not break just perfectly on top), is this just a huge coincidence or is the market repeating itself from april 2021 and are we looking at a new all time high very soon.
