BTCKRW looking more bullish than BTCUSDTBTCKRW movement is a little different from the BTCUSDT chart. BINANCE:BTCUSDT
Korean market is currently more bullish.
However, there's always a small correction after a big green candle.
Expect correction wave but we can expect price to reach 148,500,000 KRW.
Take half profit and watch price movement.
BTCKRW trade ideas

Increased likelihood of short-term surges occurringHello?
Traders, welcome.
If you "Follow", you can always get new information quickly.
Please also click "Boost".
Have a good day.
-------------------------------------
(BTCKRW chart)
To check the upward momentum we look at volume.
However, in order to check the power of the market itself, you need to look at the size of the funds and how they are flowing.
In that sense, I think the movements of USDT and USDC charts provide us with important information.
The BTCKRW chart is slightly different from the BTCUSDT chart.
On the BTCUSDT chart, the StochRSI indicator is about to enter the overbought zone, and on the BTCKRW chart, it is located near the 50 point.
Therefore, if the selling pressure does not increase, it is expected to rise further.
(BTCUSDT 1D chart)
At this time, the important thing is whether the price is maintained around 27262.84 on the BTCUSDT chart.
Binance exchange is a large exchange where many transactions take place.
However, large selling or buying trends begin on small exchanges.
--------------------------------------------------
- big picture
The full-fledged upward trend is expected to begin when the price rises above 29K.
This is the section expected to be touched in the next bull market, 81K-95K.
-------------------------------------------------- -------------------------------------------
** All descriptions are for reference only and do not guarantee profit or loss in investment.
** The trading volume indicator is displayed as a candle body based on 10EMA.
Display method (in order of boldest)
More than 3x 10EMA trading volume > 2.5x > 2.0x > 1.25x > trading volume below 10EMA
** Even if you know other people's know-how, it takes a considerable period of time to make it your own.
** This is a chart created with my know-how.
---------------------------------


[BTCKRW] 220419 BITCOIN LONG Scenario1. PATTERN : Inverse H&S
2. Trend Line, Volume Profile
3. Ichimoku Cloud Time Theory
4. Volume
19th April
KMD LARIANE

BITCOIN PUMP UPDATE (KWT)Looks like we are moving according to plan, but we are noticing some resistance being respected.
therefore move stop losses in profits accordingly. this applies to all bitcoin pump ideas
well done Lungu FX team!!

BITCION PUMP FOR KWT ??TECHNICALS
there a a few reasons to by bitcoin this week
1- markets have come to thee resistance turned support.
2- markets are within the 61.8% fib level.
3- markets have made there 3rd touch of the supporting trend line.
however if market does break out of the support zone, wait for market to touch the 4 hour support zone of 73659730.1 then enter a buy position (if market is oversold when touching the h4 support then even more reason to buy.
FUNDAMENTALS TOOK LOOK OUT FOR
TBD

Daily Analysis BTC/KRWThis chart provides a technical analysis using the ATR indicator. It plots a buy and sells signal based on daily data. This chart should not consider as financial advice always do your own research.


Kimchi premiumThe kimchi premium represents the difference between bitcoin’s price on South Korean exchanges and the going rate on other global trading venues.


Shots fired! Shots fired! Long BTCKRWAs you can see, 1st target was made, but in light of recent events i feel comfortable getting in late on this one
Entry 11048000
Target 1 11311389
Target 2 12079872
RRR 3.37
SL 10742837
GL everyone

WeirdBithumb works if you ignore the daily wicks and focus on the candle bodies.
Very weird. I'm going to keep checking all of the exchanges.


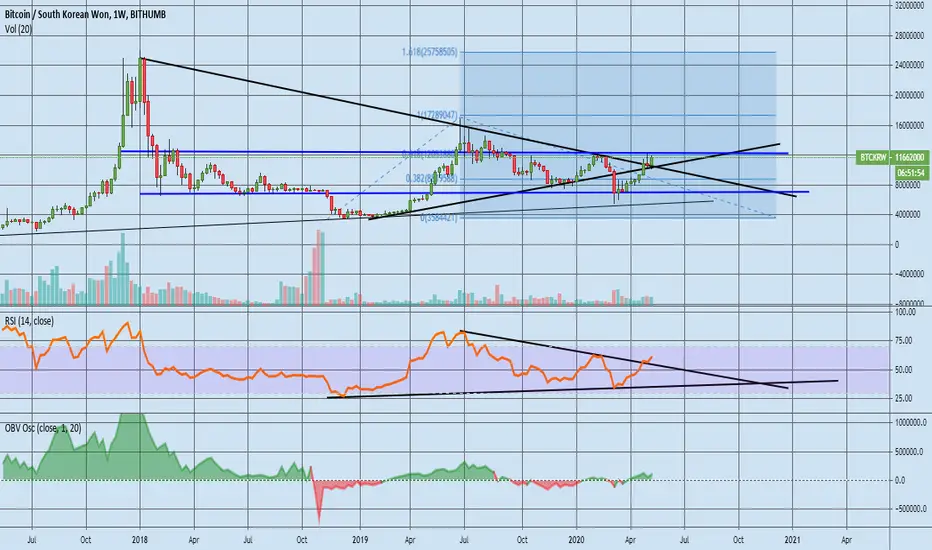
$BTCKRW - Spot longs loadedi believe this will be the largest bear trap as we head into the bitcoin halvening
I don't usually take this much risk on my trades, however, since I will be scaling in my spot buys, it is my belief that as long as the recent bottom at $6666 holds, my bull thesis is in place


BTC Trading Tip: Periodically compare BTCUSD to BTCKRWLast bull run we found out that the Koreans know how to bitcoin. Check the KRW chart when there are discrepancies between various USD exchange charts. For example, it's hard to tell from this last move up if we broke out of the downtrend or not. Bitstamp says maybe no, Binance says yes. KRW settles the matter.

BITCOIN SOUTH KOREAN WON 3D BITHUMBLast time the 50 MA crossed the 200MA, on the BTC/KRW pair, was Jan2016.


