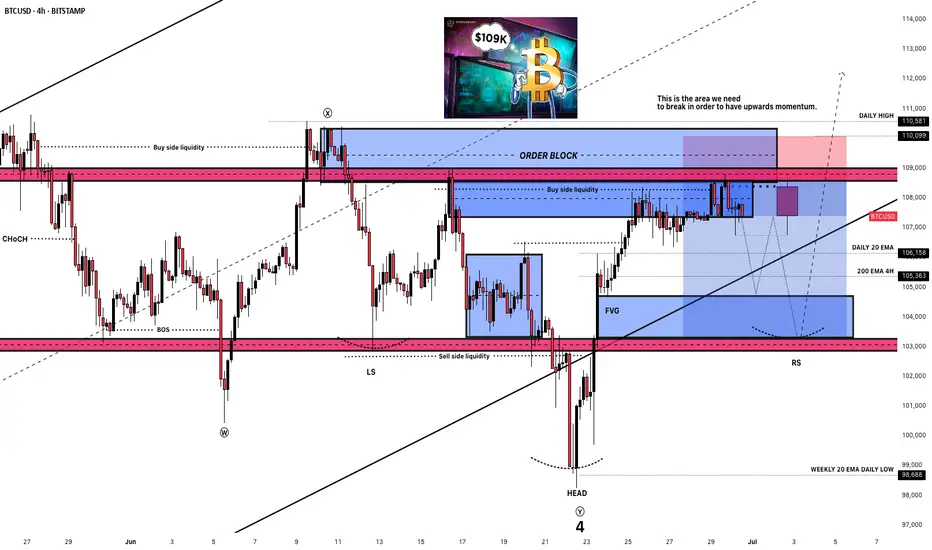
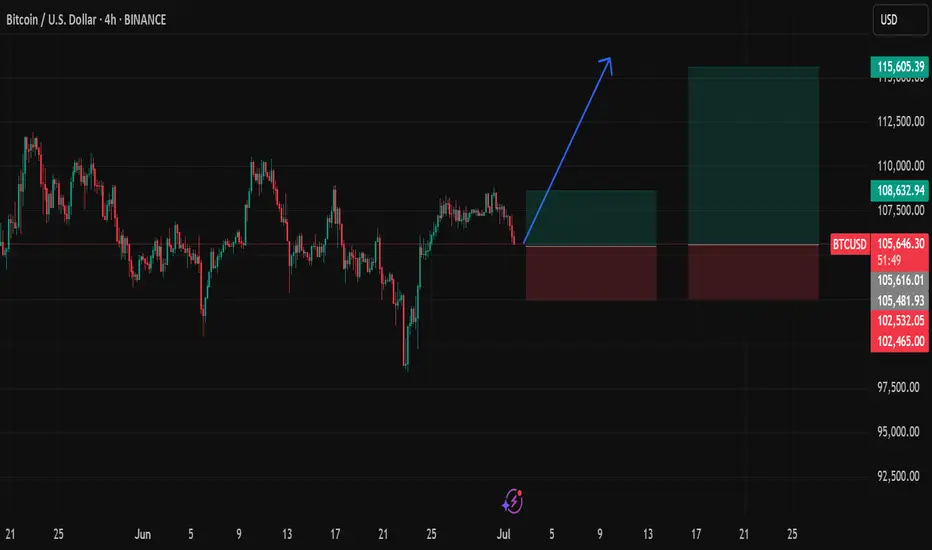
The inevitable breakout to an ATH?MN Capital founder Michael van de Poppe spotted Bitcoin hovering at $107,450, saying that after taking out some liquidity around $109,000, BTC may see a slight pullback before breaking out to all-time highs. We already reach this area.
An accompanying chart shows $109,000 as the key level to watch on BTC’s four-hour time frame. “This is the area we need to break in order to have upward momentum,” Van de Poppe said, adding:“The inevitable breakout to an ATH on Bitcoin might even happen during the upcoming week.”
However, I think we might see a pullback before this happens. We might have an inverse head and shoulder pattern in process.
BTCUSD.P trade ideas
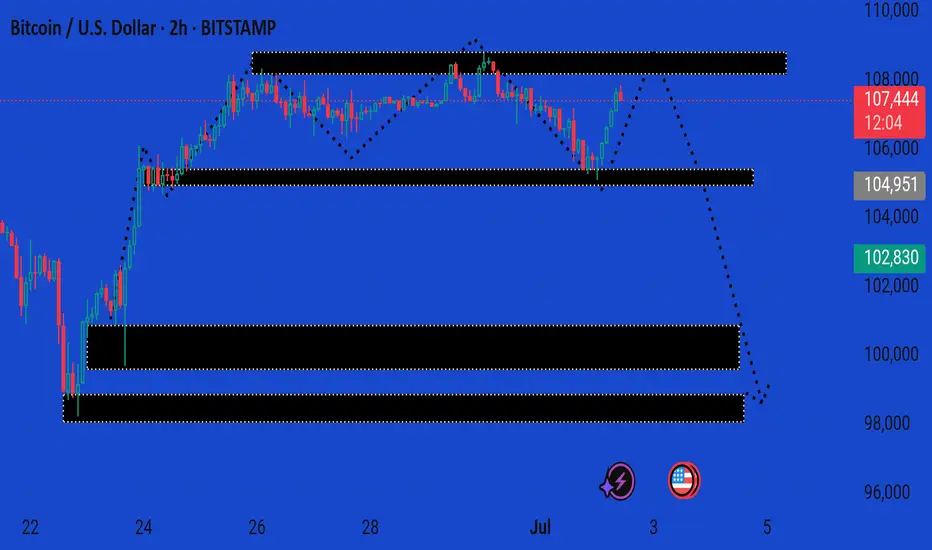
BTCUSD UPDATE MARKET This is a 2-hour BTC/USD (Bitcoin to US Dollar) chart showing a bearish projection after a consolidation phase. Here's a breakdown of the analysis:
---
🔍 Current Price:
107,549 USD
Up +1.74%, suggesting a recent bullish push — likely a short-term rally.
---
🧠 Technical Zones & Forecast:
1. Resistance Zone (~107,500–109,000):
This area has been tested multiple times.
The dotted arrow from this level suggests a projected reversal, possibly forming a lower high.
2. First Demand/Support Zone (~104,800–105,200):
Shallow support. If broken, it may confirm the start of a deeper correction.
3. Second Demand Zone (~101,500–102,800):
More robust support.
Could serve as a bounce zone or long-entry area.
4. Third Major Demand Zone (~97,500–99,000):
Strong long-term support; a bearish target if momentum increases.
---
🧭 Directional Bias:
The dotted line shows a bearish trajectory with targets at 104.9k, 102.8k, and potentially 99k.
The price action reflects a distribution range at the top, hinting at potential markdown phase starting soon.
---
✅ Conclusion:
Short-term bullish, but showing signs of weakness near resistance.
Watch for rejection around 108k–109k to confirm the bearish move.
Breakdown below 104.9k would accelerate downside toward 102.8k and 99k.
Let me know if you'd like entry/exit signals or stop-loss suggestions based on this outlook.
108400 Breakout Level – Bullish Above, Bearish BelowWatching 108400 closely as a key breakout level.
Above 108400: Momentum shifts bullish – potential for upward continuation.
Below 108400: Bias remains bearish – risk of further downside.

Bitcoin Faces Impending Drop to Mid-30,000sAs of July 02, 2025, Bitcoin’s price chart, crafted by "RoadToAMillionClub" on TradingView, paints a concerning picture. Currently hovering at $107,831, the cryptocurrency appears to be teetering at the edge of its upper channel, signaling potential trouble ahead. The recent 0.51% dip may be just the beginning of a more significant decline.
The long-term upward trend, marked by a supportive orange line since 2018, has been a beacon for bulls. However, the green trend line projecting a drop toward the mid-30,000s range, around $37,932, suggests a looming correction. This level, a historical support zone, could become the next battleground as selling pressure mounts.
Market indicators point to overextension, with the price hitting a 4-day and 14-day high of $107,831 before the recent pullback. The speculative fervor that drove Bitcoin to these heights seems to be waning, increasing the likelihood of a bearish turn. Investors should brace for volatility, as the cryptocurrency may struggle to maintain its current altitude, potentially sliding toward the mid-30,000s in the coming months.

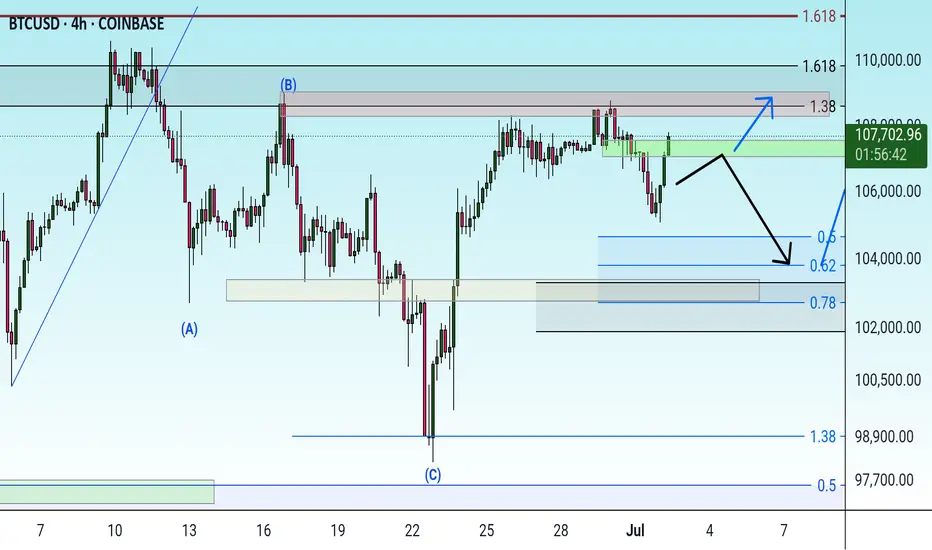
Possibility of uptrend A trend change is expected to form at the green resistance area and we will see the beginning of a downtrend. If the price breaks through the resistance area, a continuation of the uptrend to the previous high is likely.
BTC BOUNCESBitcoin just pulled off a clean bounce off support, landing perfectly on the 50-day moving average around $105,800 – a level that’s repeatedly proven its importance. The move came with a solid +2% daily candle, reclaiming lost ground and putting the bulls back in control for now. Price is still trapped under the descending trendline just below $112,000, which has capped every breakout attempt over the past month, but momentum is shifting. As long as BTC stays above that support zone and keeps printing higher lows, the structure looks bullish. A breakout above that trendline would likely send us flying – but fall back below $105,800, and we’re probably retesting $100,700. For now, the bounce looks strong, the trend is intact, and the ball’s back in the bulls’ court.

Btcusdt tecenical analysis.Btcusdt tecenical analysia next move possible at h1 time frame.not fincial advice.

BTC Blow off top coming soon?BTC cycles is showing the blow off top might be closer then we think, by the end of year 2025
BTC has always done this cycles and I hear "this time is different" since forever.
Do I expect this time to be different? Absolutely not.
Even if it goes to 140k? it is still the same wave and its expected to be honest, 120-140k is still at play and that will be the end of the fireworks finale.

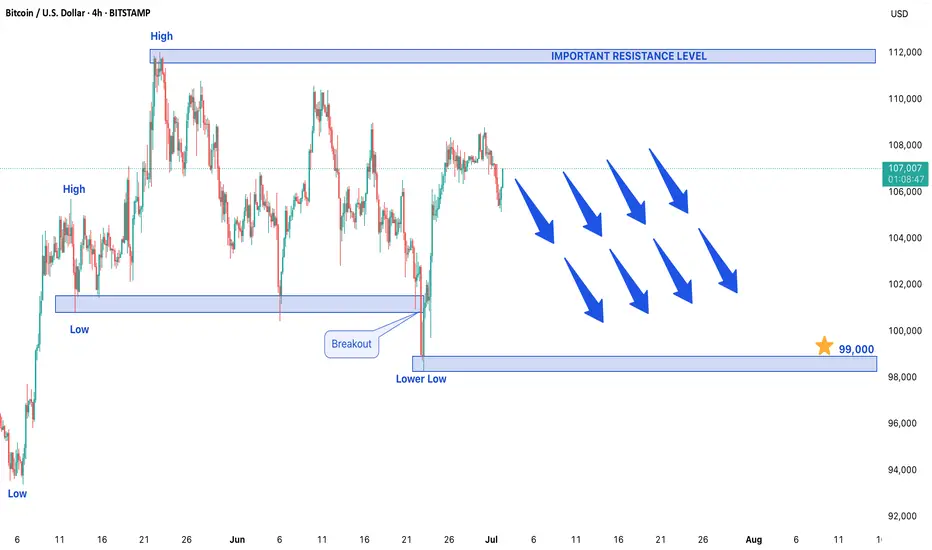
BITCOIN STRATED FORMING BEARISH TREND STRUCTUREBITCOIN SHOWS SIGNS OF BEARISH REVERSAL – KEY LEVELS TO WATCH
After an extended bullish run, Bitcoin is now showing early signs of a potential trend reversal as the market begins forming a bearish structure. The formation of a lower low on the price chart indicates weakening bullish momentum and suggests that sellers may be gaining control. This development comes after a sustained upward trend, signaling that a corrective phase could be underway in the cryptocurrency market.
Bearish Confirmation: Lower Low Formation
The appearance of a lower low is one of the most reliable technical indicators of a trend reversal. This pattern demonstrates that bears are successfully pushing prices below previous support levels, establishing a new downward trajectory. While this doesn't necessarily confirm a long-term bear market, it does suggest that Bitcoin could face further downside pressure in the near term. Traders should watch for confirmation through follow-through selling or additional bearish candlestick patterns.
Downside Target: $99,000 in Focus
If the bearish momentum continues, Bitcoin could test the $99,000 support level in upcoming trading sessions. This level represents a psychologically important zone where buyers may attempt to step in. However, a decisive break below this support could accelerate declines, potentially leading to deeper corrections. Traders should monitor volume and price action around this level for signs of either consolidation or continuation of the downtrend.
Resistance Level: $12,000 as Key Barrier
On the upside, $12,000 now acts as a critical resistance level. Any short-term rallies toward this zone could attract renewed selling pressure, reinforcing the bearish outlook. For the current downtrend to be invalidated, Bitcoin would need to reclaim and sustain above this resistance with strong buying volume. Until then, traders may consider selling into strength near this level while maintaining tight risk management.
Market Outlook: Correction Expected After Prolonged Rally
Given Bitcoin's history of volatile price swings, this potential reversal should not come as a complete surprise after its extended bullish run. Market participants should watch for:
- Increasing trading volume on downward moves (confirming bearish conviction)
- Potential bearish continuation patterns (like descending triangles or flag formations)
- Macro factors that could influence crypto markets (regulatory news, ETF flows, or macroeconomic shifts)
Conclusion
Bitcoin appears to be entering a corrective phase, with $99,000 as the next key downside target and $12,000 serving as major resistance. While the broader uptrend may still be intact long-term, short-term traders should prepare for potential bearish continuation. As always, proper position sizing and stop-loss strategies remain crucial in navigating Bitcoin's inherent volatility. A break above $12,000 would require reassessment of the bearish outlook.
BITCOIN CRASH TO $87,000?!In accordance to my ‘Elliott Wave Theory’ strategy, Bitcoin has completed its 5 Wave Impulse run OR is very close to completion!
Is it time for price to start correcting and dump down towards $87,000?
Let me know in the comments what you think.

BTC Consolidates Above $100K — Bullish Structure Remains IntactKey Support Holding Firm:
Bitcoin is consolidating above the critical $100,000–$105,000 support zone, a former resistance area from early 2025. Holding this level preserves the broader bullish structure.
Short-Term Noise, Long-Term Strength:
While recent price action shows some lower highs and lows, the long-term uptrend that began in April remains fully intact. This is typical consolidation behavior within a strong bull market.
Wedge Formation Points to Breakout:
A six-month wedge pattern continues to develop, often a precursor to a powerful breakout. If resolved to the upside, the next leg could target the $130,000–$135,000 range.
Outlook Remains Bullish:
As long as Bitcoin holds above $100,000, there’s no technical basis for a bearish scenario. This remains a constructive pause within a dominant uptrend.
#Bitcoin #BTC #CryptoMarket #TechnicalAnalysis #Bullish #SupportAndResistance #WedgeBreakout #LongTermTrend #MarketOutlook #PriceAction

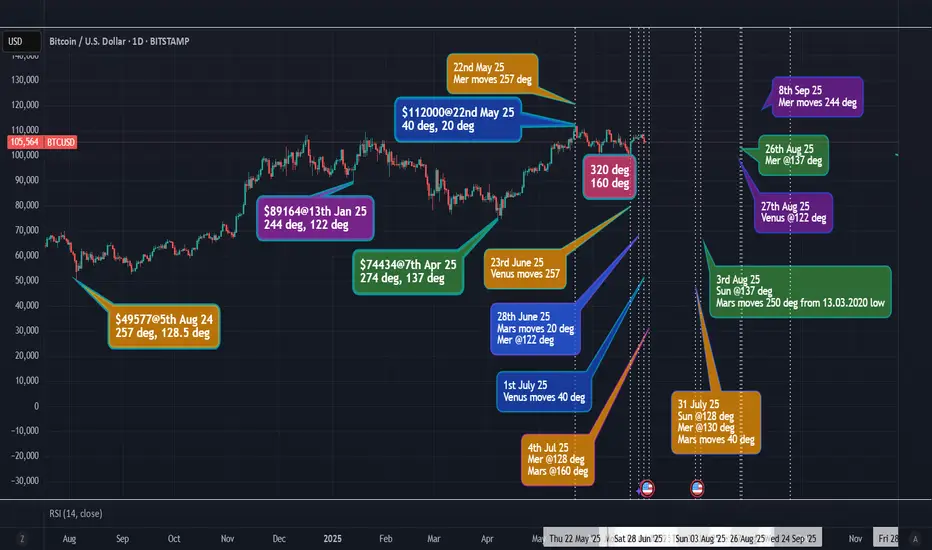
BTC - change in trend - GANN's price = planetary long/movesThis is based on GANN's price squaring planetary longitude and planetary movements. The color-coding is to match the price in degree with the expected future dates for change in trend marked on the chart.
btc/usd 4 hour bearish analysis bitcoin may be go for sell side bearish movement will be touch to zone due to consolidation point

bearish divergence on the weekly , pullback seems to be comingafter a bullish run up , it looks like it is about time to cool down a bit . retrace to below 100k , and test support . bearish diversion is clearly showing on the bigger timeframes and can play out very soon.

BTC Shorts Into Q3 | Monthly + Half-Year Candle PressureWe’re entering a pivotal window on the Bitcoin chart, the monthly close, Q2 close, and 6-month candle all lining up. This kind of macro convergence rarely goes unnoticed by the market and often marks major structural shifts.
BTC has failed multiple times to break through key highs, and with momentum fading into this close, I’m leaning short heading into Q3. Even if price wants to trend higher later this year, I expect that move to begin from a deeper wick, not from the top of the current range.
I’m watching the 103K level closely. A break below it could trigger a swift drop toward 95K, possibly lower depending on how the new monthly opens and reacts. That would line up with the idea of a strong lower wick forming on the new 3M or 6M candle.
This isn't a long-term macro short, just a high R setup where structure, timing, and context are aligning. I believe this move starts today or very soon. The next few candles will speak volumes.

Turn off the noise. Listen to price. $XBTUSDFor me, BITMEX:BTCUSD.P is still in a bullish setup. If you are long, don't panic sell early yet. The signal to sell would be a break of my LIS which currently stands at 103703. If it makes new highs, it would be even more convincing that it wants to go higher ie. don't sell at new highs.
If a new high is made, i will be able to provide a min target to the upside. I will keep you updated.

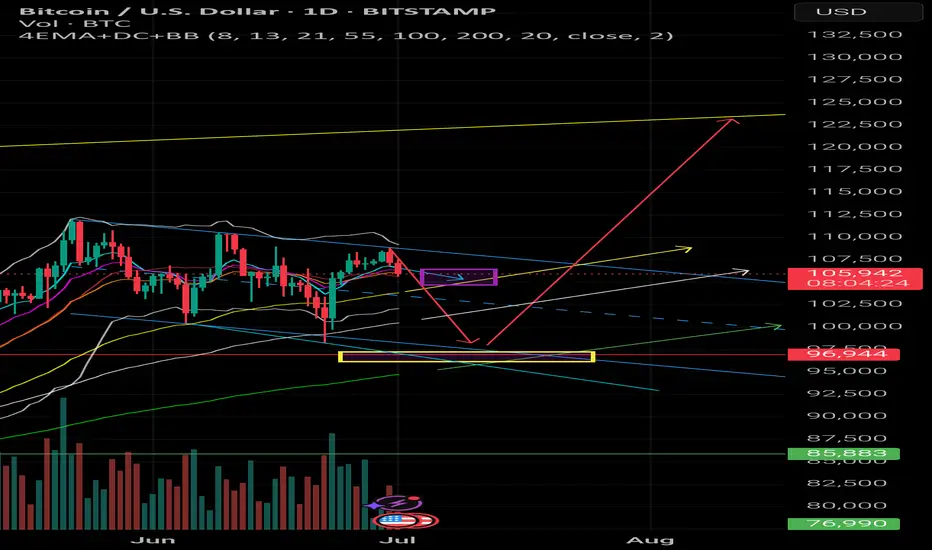
Bitcoin Daily – Multi-Line Magnet in Play📊 Bitcoin Daily – Multi-Line Magnet in Play
Price, Time, and Structure Align
I’ve added a new trendline connecting the last two deep hits.
Technically, the second hit broke the old flag structure – but honestly, that’s not a real problem.
👉 The overall swing structure remains intact.
The new line now perfectly fits the current market rhythm.
What’s really interesting:
This new trendline converges exactly at the same magnetic zone I’ve been tracking – around 96,944 USD.
It aligns with the previous horizontal key level, the EMA projection, and the crosspoint I marked earlier.
This kind of multi-line confluence often acts like a price magnet.
👉 What I love about this setup:
If price really pushes into this zone, it would cleanly stab through the old flag structure – a typical panic trigger that shakes out many traders.
📌 Also worth noting: Another day has passed since my initial idea, and the current price action has technically proven that it’s possible to push lower.
The path to the target remains open.
👉 Stop-Loss Logic:
For this setup, the cold stop-loss sits just below the midline of the weekly Bollinger Band.
If this level gets broken, the overall structure is technically invalid.
But I wouldn’t place the stop directly on the midline – it’s smarter to give it a small buffer to survive potential liquidity sweeps.
Typically, this level doesn’t break cleanly on the first touch.
Let’s see how this plays out.
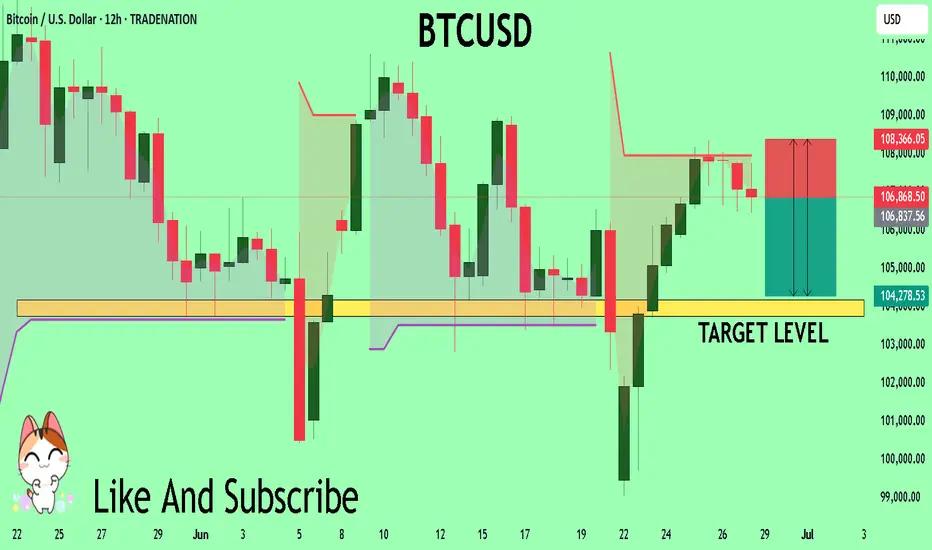
BTCUSD Trading Opportunity! SELL!
My dear subscribers,
This is my opinion on the BTCUSD next move:
The instrument tests an important psychological level 10686
Bias - Bearish
Technical Indicators: Supper Trend gives a precise Bearish signal, while Pivot Point HL predicts price changes and potential reversals in the market.
Target - 10417
My Stop Loss - 10836
About Used Indicators:
On the subsequent day, trading above the pivot point is thought to indicate ongoing bullish sentiment, while trading below the pivot point indicates bearish sentiment.
Disclosure: I am part of Trade Nation's Influencer program and receive a monthly fee for using their TradingView charts in my analysis.
———————————
WISH YOU ALL LUCK
BTCUSD Bullish sideways consolidation supported at 101.780Trend Overview:
BTCUSD remains in a bullish trend, characterised by higher highs and higher lows. The recent intraday price action is forming a continuation consolidation pattern, suggesting a potential pause before a renewed move higher.
Key Technical Levels:
Support: 101,780 (primary pivot), followed by 100,380 and 98,184
Resistance: 109,170 (initial), then 111,600 and 114.140
Technical Outlook:
A pullback to the 101,780 level, which aligns with the previous consolidation zone, could act as a platform for renewed buying interest. A confirmed bounce from this support may trigger a continuation toward the next resistance levels at 109,170, 111,600, and ultimately 114,140.
Conversely, a daily close below 101,780 would suggest weakening bullish momentum. This scenario would shift the bias to bearish in the short term, potentially targeting 100.390 and 98,180 as downside levels.
Conclusion:
BTCUSD maintains a bullish structure while trading above the 101,780 support. A bounce from this level would validate the consolidation as a continuation pattern, with upside potential toward the 109,170 area. A breakdown below 101,780, however, would invalidate this view and suggest deeper corrective risk.
This communication is for informational purposes only and should not be viewed as any form of recommendation as to a particular course of action or as investment advice. It is not intended as an offer or solicitation for the purchase or sale of any financial instrument or as an official confirmation of any transaction. Opinions, estimates and assumptions expressed herein are made as of the date of this communication and are subject to change without notice. This communication has been prepared based upon information, including market prices, data and other information, believed to be reliable; however, Trade Nation does not warrant its completeness or accuracy. All market prices and market data contained in or attached to this communication are indicative and subject to change without notice.

Bitcoin ConsolidatesBitcoin is currently consolidating just below a clear descending trendline, showing a series of lower highs since its recent local top near $112,000. Price is hovering around $106,300, holding just above key horizontal support at ~$105,800. This level coincides with the 50-day moving average (blue), which is currently acting as dynamic support.
So far, Bitcoin has respected the ~$100,700 level as major support after the mid-June shakeout. As long as price remains above that zone and holds the 50 MA, the bullish structure remains intact despite the short-term lower highs. But the more price compresses beneath the descending resistance, the more likely we see a breakout (or breakdown) soon.
The 200-day moving average (red) is well below current price action, hovering near $95,000. That’s a long way down and would likely only be tested if broader market conditions deteriorate significantly.
Volume is tapering, suggesting traders are waiting for a decisive move. A break above the descending trendline and reclaim of $110,000+ would invalidate the current short-term downtrend and likely bring $112,000 and new highs into view. A loss of $105,800, on the other hand, puts $100,700 back in play – and below that, things could get ugly quickly.
For now, the trend is neutral within a broader uptrend. The bulls are holding the line – but just barely

Last chance to make profit from BTC with buying positionBullish flag
Strong resistance breakout
2 bull points
Position trade spot buying
Bitcoin completing timecycle on oct 2025 after that it would be 4th time if market again crash for around 70%
Manage your risk in both future and spot trading
Note: NO analysis would 100% profitable trading is the game of probability and risk management so follow your trading plan with proper risk reward and win rate.

Bitcoin is bullish now & many Traders don't see it !!!I currently expect the price to correct slightly, as indicated on the chart, and then pump by about 6% from the PRZ . This signal is reinforced by strong positive divergence and a wedge pattern. In summary, the PRZ is a solid entry point, derived from the confluence of touchlines and pivots. However, if the price ignores this zone and falls below it, my analysis will be invalidated.
Best regards CobraVanguard.💚
