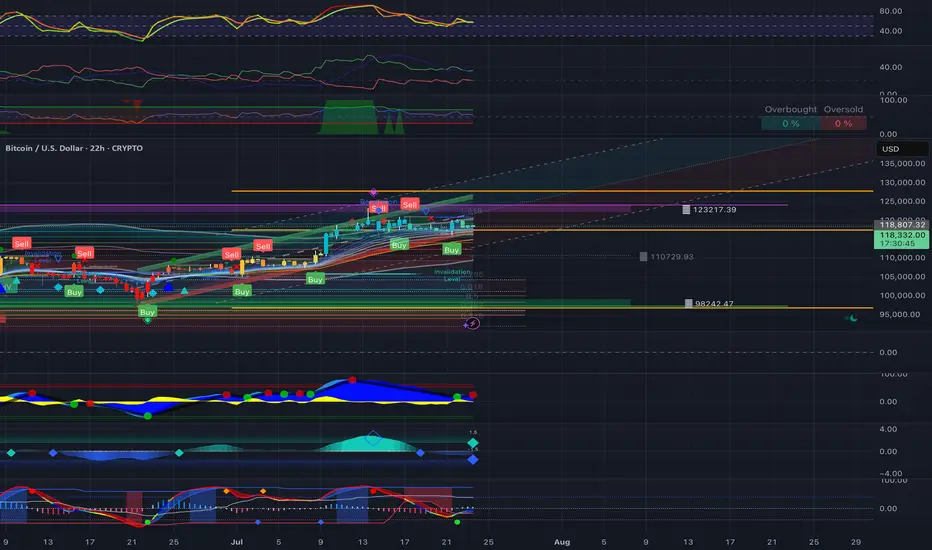
Bitcoin: Genius is on the scene The U.S. House passed the Genius Act on July 17, following Senate approval in June. The bill sets comprehensive federal standards for stablecoins, clearing the way for banks and fintechs to issue them under clear reserve and audit rules. This represents a new milestone for the crypto market, and its leading coin - BTC. During the week, BTC managed to hold steady above the $118K. On Tuesday, there has been one attempt to push the price toward the $116, however, the price swiftly returned to the previous grounds. The highest weekly level reached was at $122,8K, reached on Monday, however, this level was also unsustainable. The majority of trades during the week were around $118,5K.
The RSI modestly moved from the overbought market side, ending the week at the level of 65. This could be an indication of a forthcoming price reversal, however, considering strong demand for BTC, such a move could be easily postponed. The MA50 started again to diverge from MA200, indicating that there will be no cross of two lines in the coming period.
BTC managed to hold levels above the $118K, which is an indication that investors are still not ready to sell in higher volumes, in order to take profits. The RSI is indicating potential for a short reversal, however, in the current circumstances, it might be postponed. A move toward the higher grounds is also quite possible, especially taking into account BTCs recent push toward the $122K. At this moment charts are pointing to equal probabilities for a move toward both sides. On one hand, the $116K support was indicated through price during the previous week, as well as the $122K. The start of the week ahead will determine which side will prevail in the week ahead.
BTCUSD.P trade ideas

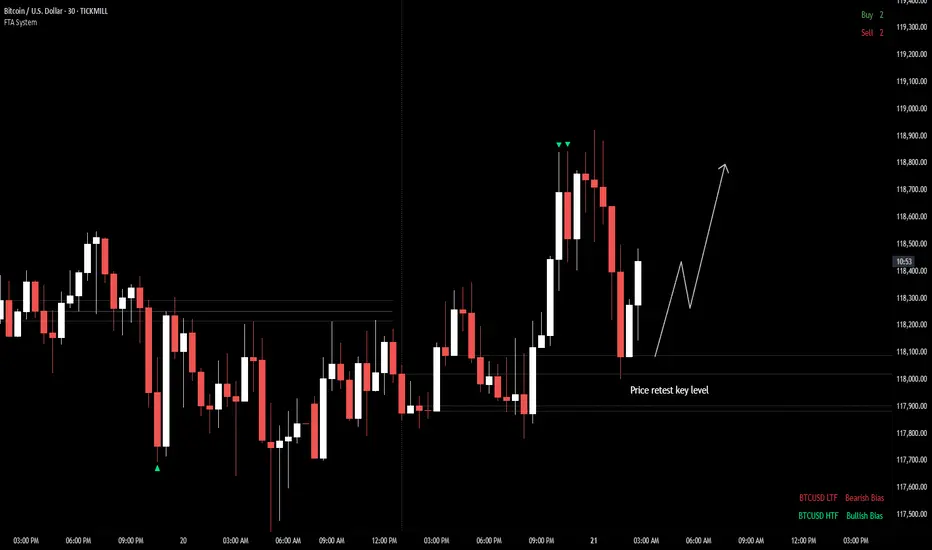
BTC/USD — Potential Bullish BreakoutBitcoin is currently retesting a key intraday level after pulling back from recent highs. If price continues to hold above this level, potential for break above previous highs.
As long as the structure holds and continue bullish momentum. However, if price slips back below the level with momentum, this scenario may be invalidated.
📌 Bias: Neutral to Bullish
📌 Timeframe: Intraday / Short-term
📌 Key Level to Watch: 118K
#202529 - priceactiontds - weekly update - daxGood Day and I hope you are well.
comment: Prior weeks close was 24332 and this was it was 24386. Bulls need to continue with higher lows and bears need to break below 24000 for lower prices. Not more magic to.
current market cycle: bull wedge
key levels for next week: 24000 - 25000
bull case: Bulls are still in control until we print lower lows again. We have 2 potential bull trend lines close to the daily ema and that’s around 24200 and will be my line in the sand for bulls next week. Below, chances of 24000 go up big time. If we stay above 24300, there is no reason we can not test back up to 24500 and above that we will likely try 24700+ again.
Invalidation is below 24000
bear case: Bears need a lower low below 24000. That’s really all there is to it. As of now the selling on Friday was decent but it’s not enough to expect follow-through selling. Below 24000 I think we can test the 50% retracement at 23900 but I’d be surprised if we go lower. Only an event could trigger that. Lower targets would be as marked on the chart.
Invalidation is above 24749
short term: Neutral. I want follow-through selling but will likely won’t get it. It’s still a bull wedge until we have a daily close below 24000.
medium-long term from 2025-06-29: Bull surprise last week but my targets for the second half of 2025 remain the same. I still expect at least 21000 to get hit again this year. As of now, bulls are favored until we drop below 23000.
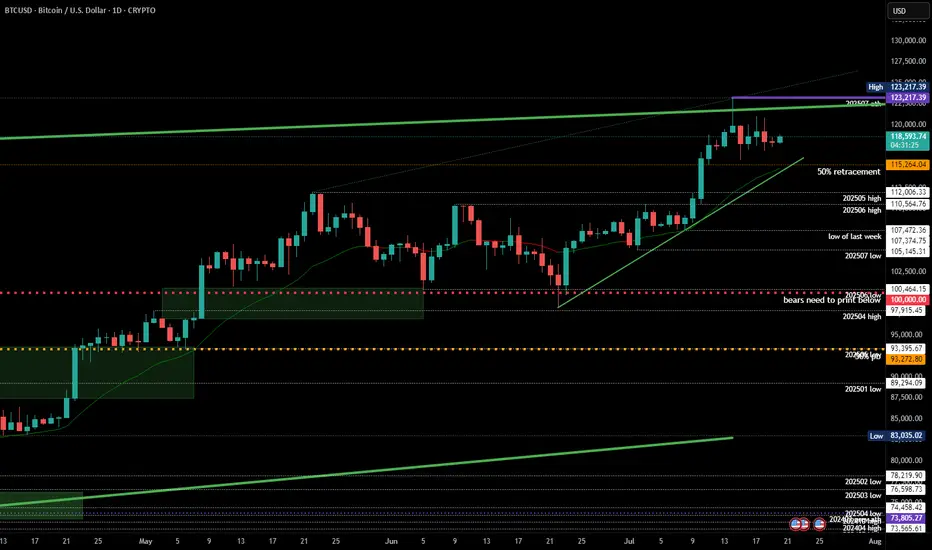
BITCOIN - Price can bounce up from support line to $125000Hi guys, this is my overview for BTCUSD, feel free to check it and write your feedback in comments👊
For a long time, the price was trading sideways inside a wide flat range between the $99000 support area and the $112000 resistance level.
After accumulating volume, bitcoin made a strong upward impulse and performed a breakout, pushing above the top of the flat.
Following this movement, the price action began to form a rising wedge pattern, moving between its clear support and resistance lines.
Recently, price tested the resistance line of the wedge and then started a predictable correction back down towards support.
Now, BTC is approaching the support line of the wedge, which aligns with the important horizontal support area around $112000-$113500.
I expect that the price can test this support line and then bounce up to the $125000 resistance line of the wedge.
If this post is useful to you, you can support me with like/boost and advice in comments❤️
Disclaimer: As part of ThinkMarkets’ Influencer Program, I am sponsored to share and publish their charts in my analysis.

BTC 4H – Dance with the 200MA
Bitcoin continues its strong relationship with the 200MA.
Each time price dips below it, fear spikes — but bounces off key Fib levels have followed, with price then riding higher alongside the 200MA.
Right now, price is caught between the 200MA and a nearby Fib level.
Here’s what could happen next:
– Price flips the Fib into support, ideally with help from a rising 200MA.
– Price waits for the 200MA to catch up, and they break the Fib together.
– Or, we get another panic dip, and the bounce comes after another test from below.
Whichever path it takes, we’ll be here watching it unfold.
Always take profits and manage risk.
Interaction is welcome.

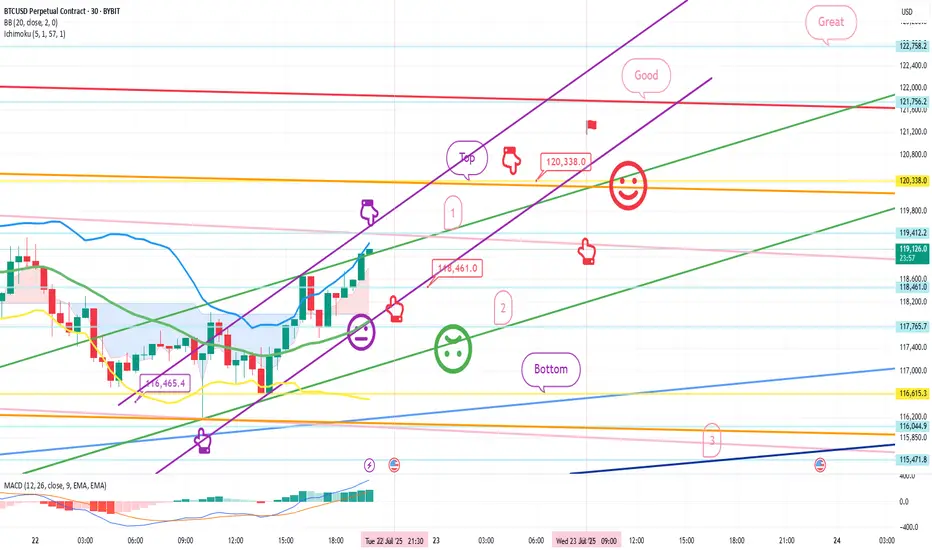
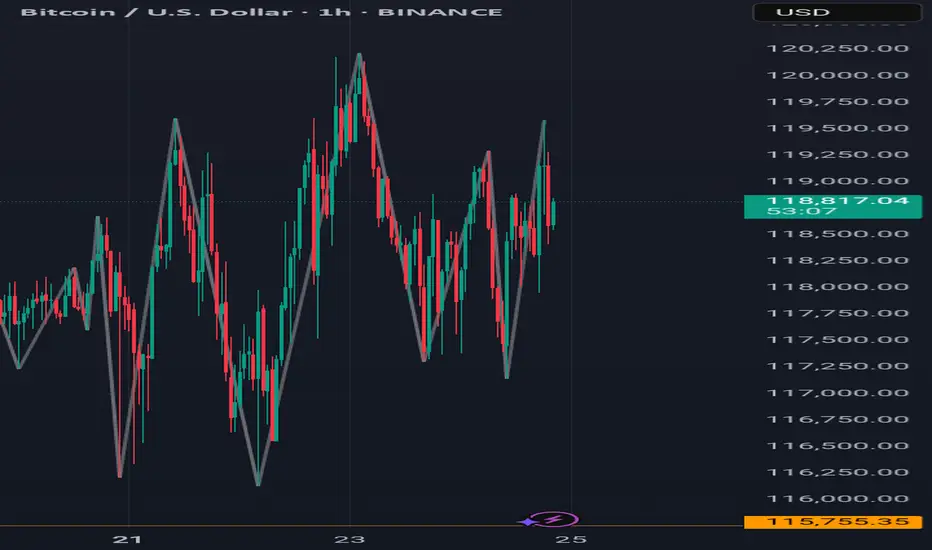
July 22 Bitcoin Bybit chart analysisHello
It's a Bitcoin Guide.
If you "follow"
You can receive real-time movement paths and comment notifications on major sections.
If my analysis was helpful,
Please click the booster button at the bottom.
This is Bitcoin's 30-minute chart.
Nasdaq indicators will be released at 9:30 in a little while.
Although Bitcoin's mid-term pattern is broken,
it looks like a strong upward trend based on signals and candlestick positions.
In the case of Nasdaq, the 6-hour and 12-hour charts MACD dead cross is in progress,
and even if there is no plunge and only a sideways movement,
it seems likely that today's strategy will be successful.
In the bottom left, from the analysis article on the 18th,
the final long position entry point of $116,465.4 Bottom
is connected as is.
*Red finger movement path
One-way long position strategy
1. $118,461.9 long position entry section / green support line breakout, stop loss price
2. $120,338 long position 1st target -> Good, Great in order of target price
See the 1st section at the top as a touch section for an upward wave rather than a short position entry,
and if this section breaks through right away, an upward trend can be connected.
If the purple parallel line support line is maintained without breaking away,
there is a possibility of a vertical rise.
If the top section is touched,
after the first liquidation,
it would be good to use the 1st section to re-enter a long position.
The 2nd section at the bottom is important,
and if it is pushed to this section according to the movement of Nasdaq today,
it can fall strongly.
Please check the real-time support line shape.
From the breakout, Bottom -> 3 sections are open.
If you touch the 3rd section after tomorrow, the mid-term pattern will be restored.
This is the 12+ day section.
Up to this point, I ask that you simply use my analysis for reference and use only.
I hope that you will operate safely with the principle of trading and stop loss.
Thank you.
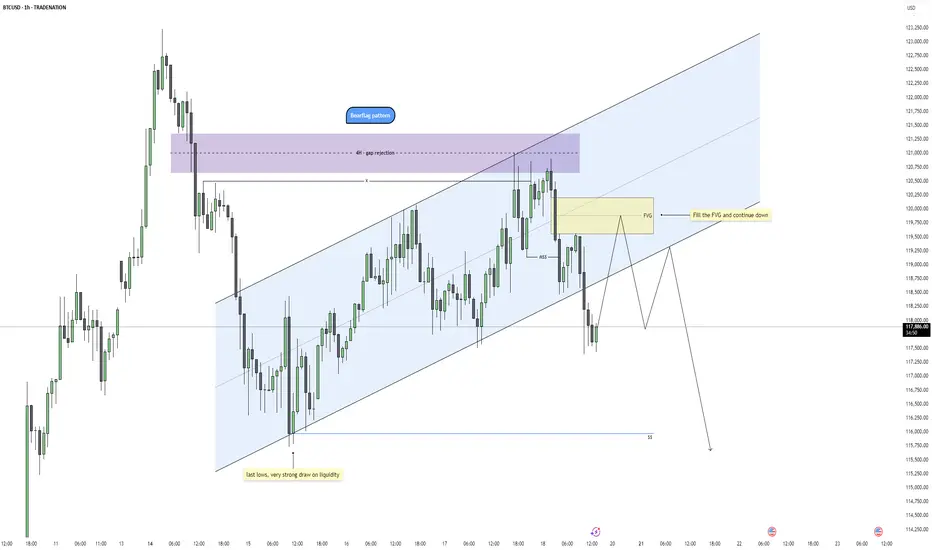
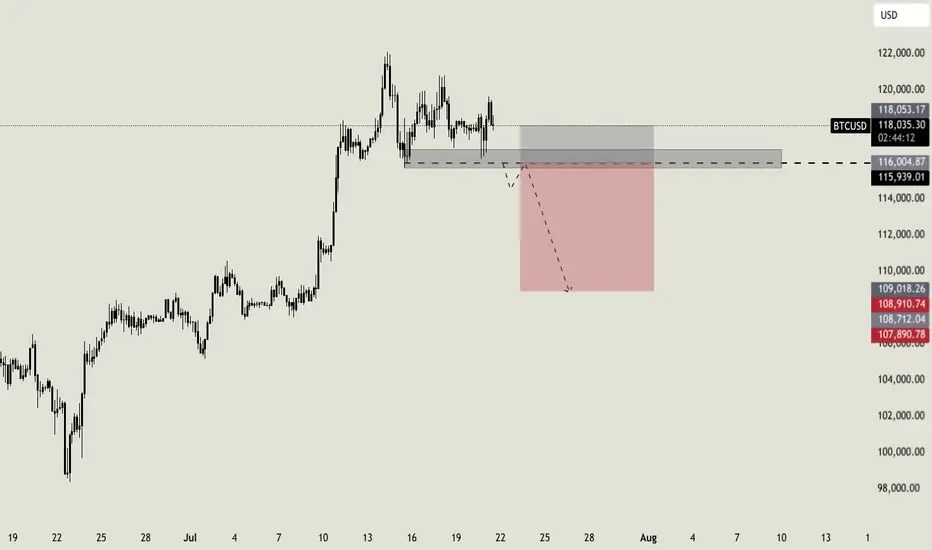
Bitcoin - Bearflag Structure Taking ShapeBitcoin is showing signs of weakness after a clean rejection from a 4H fair value gap, where price also swept the previous swing high. This aligns well with a broader bearish context as the market failed to sustain above the upper bounds of the trend channel, indicating potential exhaustion of the bullish correction.
Rejection Zone and Fair Value Gap
The rejection took place precisely within a 4H imbalance, adding confluence to the idea that this was a premium retracement in a bearish leg. The high formed inside that zone has now been swept, setting up conditions for distribution. A smaller 1H fair value gap was also left behind during the displacement move down, creating a clean area for price to return to and potentially react from.
Channel Structure and Bearflag Formation
Structurally, price has been climbing in a rising channel that resembles a bearflag pattern. The recent market structure shift broke the channel low, confirming that the rising structure is likely corrective. The rejection from the top of the flag and the subsequent breakdown align with a typical bearflag setup, suggesting a continuation move to the downside.
Short-Term Retracement Expectation
Before the next leg down, price may retrace to fill the unmitigated fair value gap while possibly sweeping the minor swing high that caused the current drop. This retracement would offer a premium shorting opportunity in alignment with the bearish bias, especially if internal structure remains weak on the lower timeframes during the return to the FVG.
Draw on Liquidity and Price Objective
The main objective for this setup is a sweep of the last equal lows near 115950, which represents a strong draw on liquidity. If the bearflag setup plays out fully, this area is highly vulnerable and could be the next significant target once the FVG is filled and lower timeframe distribution confirms.
Conclusion
Price has rejected from a 4H imbalance and swept liquidity to the upside, forming a clean bearflag structure. As long as price remains below the recent high and fills the 1H FVG without invalidating the shift, the path of least resistance looks to be down toward the liquidity resting below 115950. I’ll be watching for signs of weakness during the return to the FVG for a potential short trigger.
Disclosure: I am part of Trade Nation's Influencer program and receive a monthly fee for using their TradingView charts in my analysis.
___________________________________
Thanks for your support!
If you found this idea helpful or learned something new, drop a like 👍 and leave a comment, I’d love to hear your thoughts! 🚀
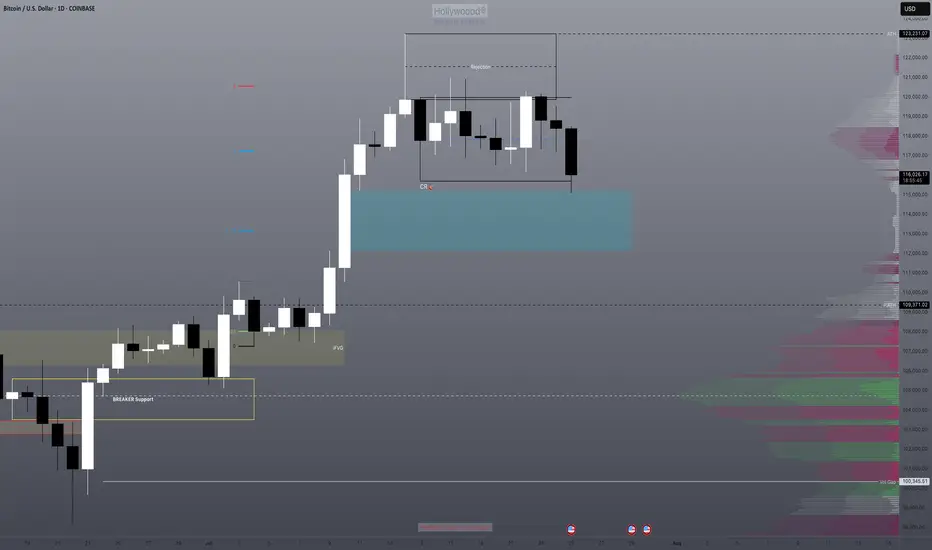
Healthy BTC Retrace in Trend Next Breakout Target 112K Then 122KBitcoin continues to respect the bullish market highlighted in our previous analysis, where the AB=CD structure pointed toward significant upside potential. The market has since retraced into a well defined re-accumulation zone, aligning precisely with prior expectations.
Price has held firmly above the round figure support ($100k), with the current structure confirming a healthy correction within trend.
As long as the re-accumulation zone between 104k–107k holds, momentum remains skewed to the upside. The projected 2.618 extension sits near the 122k mark, where the current setup aims to complete.
The broader structure still respects higher timeframe demand and ascending channel boundaries, keeping bullish continuation valid unless 100k decisively breaks. Watch for confirmation breakout above 112k to activate the next leg of the move.
If you found this analysis insightful, drop a like to support the work and leave a comment with your perspective whether you agree, disagree, or have an alternate scenario in mind. Let's grow together through collective insights.

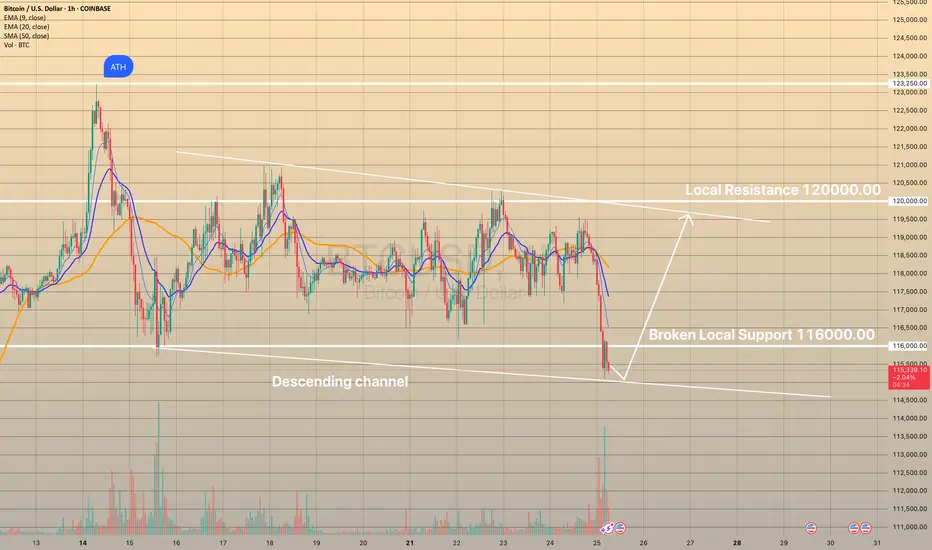
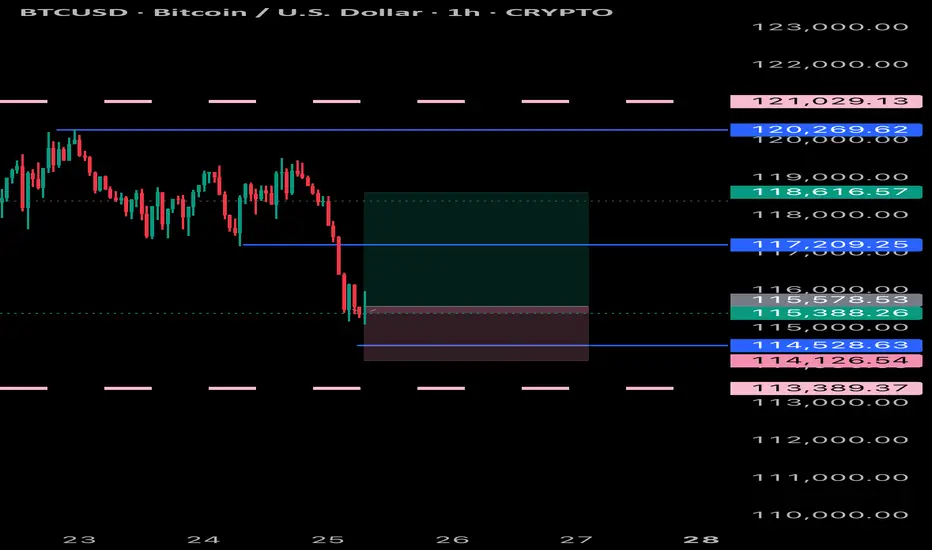
BTCUSD DROPPED BELOW LOCAL SUPPORTBTCUSD DROPPED BELOW LOCAL SUPPORT📉
Today bitcoin dropped below the level of 116,000.00 on high volume. However, the price didn't go somewhere far downwards and consolidates slightly below this level. Presumably, descending channel may be formed.
What is a descending channel?
A descending channel is a bearish chart pattern formed by two downward-sloping parallel trendlines connecting lower highs and lower lows in a pair’s price, indicating a consistent downtrend. It shows sellers are in control, with prices declining within a defined range.
Here I presume the price to rebound from lower border of the descending channel with possible movement towards upper border slightly below the 120,000.00 level.
$BTCUSD bullish short term before Intermediary Wave 1 pullbackSupercycle (years): Wave (III)
Cycle (months): Wave III
Primary (weeks): Wave ((3))
Intermediate (days): Wave (1)
Minor (4H): Wave 5
Looks bullish in the short term.
Let's Go!

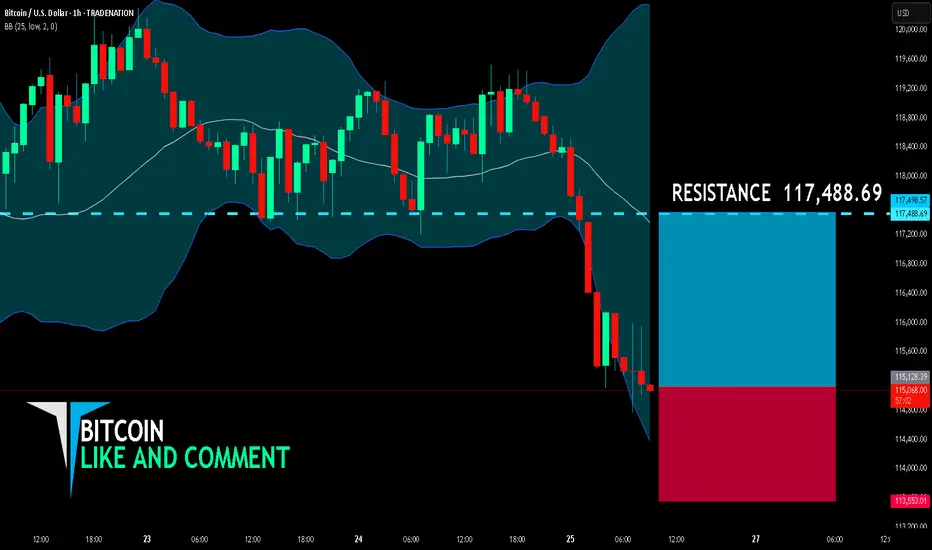
BITCOIN BULLS ARE GAINING STRENGTH|LONG
BITCOIN SIGNAL
Trade Direction: long
Entry Level: 115,128.39
Target Level: 117,488.69
Stop Loss: 113,553.01
RISK PROFILE
Risk level: medium
Suggested risk: 1%
Timeframe: 1h
Disclosure: I am part of Trade Nation's Influencer program and receive a monthly fee for using their TradingView charts in my analysis.
✅LIKE AND COMMENT MY IDEAS✅
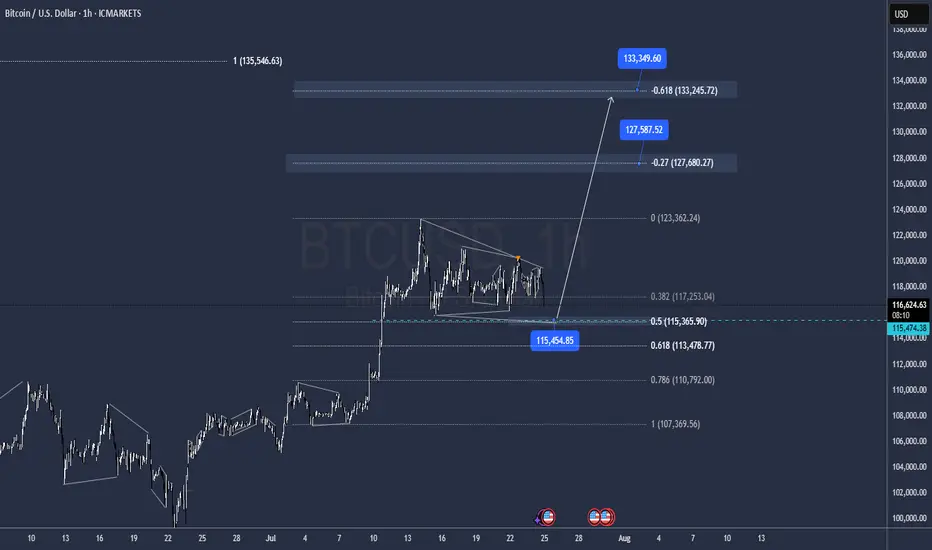
BTC Correction may be overOn a new look to the structure with the lat moves, it has the Potential to be over after tapping 115.500 and go for new Highs @ 127.500 / 133.000 as all internal impulses seeems to be matched.
Bitcoin (BTC): Accumulation Before New All-Time-High?After the recently formed ATH near the $123K zone, we have had a decent accumulation following after that, which stabilized the Bollinger Bands and RSI, giving us a new potential for another ATH to form from here.
Now our target was $120K, which we filled quickly; now it is the $140K zone mainly so we are keeping our attention there. We are keeping the bullish game plan as long as we are above the middle line of the Bollinger Bands (which currently is in a bullish trend). (That green line is the middle line, btw).
Swallow Academy

BITCOIN Accumulation Phase almost completed. Higher from here?Bitcoin (BTCUSD) is making a strong rebound on the bottom of its 1-month Channel Up and this analysis is in direct response to the one we published last week (July 15, see chart below), where we called this one-week consolidation:
We won't be going into too much detail then, as you can see the price made the Accumulation 2 Phase, after an identical +25.9% Bullish Leg, same as April's and by breaking below the 4H MA50 (blue trend-line), it hit the 0.236 Fibonacci retracement level.
As per the May 05 fractal hit, as long as the 4H MA100 (green trend-line) supports this Channel Up, the market should start Bullish Leg 3 towards Accumulation Phase 3 and eventually peak at around +43% from its start at $140000.
Do you think the pattern will continue to be repeated in the exact same order? Feel free to let us know in the comments section below!
-------------------------------------------------------------------------------
** Please LIKE 👍, FOLLOW ✅, SHARE 🙌 and COMMENT ✍ if you enjoy this idea! Also share your ideas and charts in the comments section below! This is best way to keep it relevant, support us, keep the content here free and allow the idea to reach as many people as possible. **
-------------------------------------------------------------------------------
💸💸💸💸💸💸
👇 👇 👇 👇 👇 👇

Bitcoin short setupBTC is ranging on top, this means next leg is preparing. Most traders are positioned long, that's why i think price will sink after a break below my key area. I will wait a break and a retrace before entering short, targeting the $109.000 area
Bitcoin: The Key Buying Level Near $112K Liquidity ZoneFenzoFx—Bitcoin consolidation extended into the bullish FVG, trading near $115,470.0. The 4-hour chart shows an indecisive candle, while the 200-day MA points upward, signaling bullish control.
The bullish outlook remains intact if price holds above the critical $112,000.0 support. However, current bearish momentum may drag price toward this level, potentially filling nearby FVGs.
Traders should monitor $112,000.0 for bullish setups, including break of structure and long-wick bullish candles.

BTCUSD 4HOUR TIME FRAME ANALYSISCurrently bearish on the 4-hour chart with lower highs and lower lows forming consistently.
Price Action: BTCUSD recently broke below a key support zone around 116,000, turning it into a fresh resistance. The market shows bearish momentum as price fails to reclaim above that zone.
Candlestick Patterns: Multiple bearish engulfing candles confirm selling pressure near the 115,500–116,000 area.

BTCUSD BUYING can expect a bullish move from bitcoin as it has dropped a fair amount and can extract a reversal to the up side due to being oversold
Will the low of this BTC zone be used as a buy point?We have an imbalance high being tested. We know that this also represents the consolidation range low where both TPs and long entries will be triggered.
Will this be enough to send us back bullish or will be need further correction of the imbalance? I think there's a high probability of this with DXY also running into it's daily bearish imbalance range.
BTCUSD bigshortBitcoin could technically fall. Demand has increased significantly due to regulatory requirements. This surge in participants is temporary and should level off over the next 3 months.

BTC #The chart depicts a 15-minute Bitcoin (BTC/USD)The chart depicts a 15-minute Bitcoin (BTC/USD) price action forming a cup and handle pattern, which is generally considered a bullish continuation pattern. The rounded base signifies consolidation, followed by a potential breakout above the $120,250 resistance zone (blue line). A breakout with volume could confirm upside momentum. The shaded grey area below (~$117,000) represents a support zone, crucial for invalidation of the pattern if breached.
thanking you

Use Base-Anchored Fibonacci Retracement Formula🔹 Step 1: Base-Anchored Fibonacci Retracement Formula
🧮 Retracementₓ = Base + (Range × x)
Inputs:
• 🟢 Base = $74,458.42
• 🔴 High = $112,006.33
• 📏 Range = $112,006.33 − $74,458.42 = $37,547.91
📐 BTC Retracement Levels (Upward from Base)
1️⃣ Fib 0.236
= 74,458.42 + (37,547.91 × 0.236)
= 74,458.42 + 8,862.92
= $83,321.34
2️⃣ Fib 0.382
= 74,458.42 + (37,547.91 × 0.382)
= 74,458.42 + 14,362.66
= $88,821.08
3️⃣ Fib 0.500
= 74,458.42 + (37,547.91 × 0.500)
= 74,458.42 + 18,773.96
= $93,232.38
4️⃣ Fib 0.618
= 74,458.42 + (37,547.91 × 0.618)
= 74,458.42 + 23,285.25
= $97,643.67
5️⃣ Fib 0.786
= 74,458.42 + (37,547.91 × 0.786)
= 74,458.42 + 29,597.78
= $104,056.20
6️⃣ Fib 1.000
= 74,458.42 + 37,547.91
= $112,006.33
🚀 BTC Extension Levels (Beyond High)
📈 Extensionₓ = High + (Range × x)
1️⃣ Fib 1.618
= 112,006.33 + (37,547.91 × 0.618)
= 112,006.33 + 23,285.25
= $135,291.58
2️⃣ Fib 2.618
= 112,006.33 + (37,547.91 × 1.618)
= 112,006.33 + 60,767.17
= $172,773.50
3️⃣ Fib 3.618
= 112,006.33 + (37,547.91 × 2.618)
= 112,006.33 + 98,249.08
= $210,255.41
📊 Final BTC Levels
🎯 Target 🧭 Fib Level 💰 Price
TP1 0.236 $83,321.34
TP2 0.382 $88,821.08
TP3 0.500 $93,232.38
TP4 (High) 1.000 $112,006.33
TP5 1.618 $135,291.58
EXT2 2.618 $172,773.50
EXT3 3.618 $210,255.41