Bitcoin - Trust the higher timeframe!⚔️Bitcoin ( CRYPTO:BTCUSD ) is still 100% bullish:
🔎Analysis summary:
For the past couple of months we have been seeing an overall consolidation on Bitcoin. But looking at the higher timeframe, Bitcoin remains in an underlying strong bullrun. Consolidations are always expected and no reason to freak out since everything is still bullish.
📝Levels to watch:
$100.000
🙏🏻#LONGTERMVISION
Philip - Swing Trader
BTCUSD.P trade ideas

Bitcoin Weekend ForecastIts in the middel of wave 4 correction, impulses are tradeable
Levels Highlighted in the chart
$BTCUSDT: Fictitious Fractal 136KSo. I see we are having a relatively difficult time.
My expectations are in this range for the next appx. 125 days - 365 days.
Downside: 68.6k-69.9k
Topside: 100k to 136k (round to 150k)
I drew this fractal by hand and I want to watch it closely.
I expect in the next few weeks we hit 100k and then do a nice rug to 69k range.
This is probably wrong.
I pretty much extrapolated the red brush circle into a weeks long fractal.
I am longing all the dips to 68k.
Enjoy.
Mr. Storm.

BTCUSD Daily Analysis – Golden Pocket Hold Before a Bullish?🧠 Chart Description & Market Structure:
The BTCUSD daily chart is showing a consolidation phase after forming a local high near $123,231. Currently, the price is retracing and approaching a key Fibonacci retracement zone between the 0.5 level ($115,557) and 0.618 level ($113,740) — also known as the Golden Pocket, which is often a strong reversal area.
---
📈 Bullish Scenario:
If the price holds within or just above the 0.5–0.618 Fibonacci zone (highlighted in yellow) and forms a bullish reversal candlestick (like a hammer, bullish engulfing, or pin bar), there’s a high probability for BTC to resume its uptrend.
Bullish upside targets include:
$119,842 as minor resistance.
$123,231 as the previous swing high and a key breakout confirmation.
A successful break above $123,231 could send BTC toward the next major targets around $128K–$132K.
---
📉 Bearish Scenario:
If the price fails to hold the 0.618 Fibonacci level ($113,740) and breaks down below the key psychological support at $111,500, a deeper correction may occur.
Downside targets:
$108K–$106K as the next major support zone.
A break below this could lead to the formation of a lower high structure and potentially trigger a bearish continuation.
---
📊 Pattern Observations:
Potential Bullish Flag or Rectangle Consolidation: The price action suggests horizontal consolidation after a strong rally — possibly a re-accumulation zone before a bullish continuation.
Golden Pocket Retest: Price is currently testing the Fibonacci 0.5–0.618 zone, often targeted by institutional buyers and technical traders as a potential entry point.
---
🧭 Key Levels to Watch:
Major Resistance: $123,231 (swing high)
Minor Resistance: $119,842
Fibonacci 0.5: $115,557
Fibonacci 0.618: $113,740
Key Support: $111,500
---
🔖 Conclusion:
BTC is currently in a decision zone. Price action within the $115,500–$113,700 range will be crucial. Will this be a healthy retracement before the next leg up — or the beginning of a deeper correction?
#BTCUSD #BitcoinAnalysis #CryptoTA #FibonacciRetracement #CryptoChart #BitcoinDaily #BullishSetup #BearishSetup #CryptoMarket

BTC/USD – 4H Technical and Fundamental AnalysisBTC/USD – 4H Technical and Fundamental Analysis
BTC/USD saw sharp downside pressure today, driven by a wave of long position liquidations—exceeding $800 million across the crypto market in the past 24 hours. The sudden shift triggered panic selling, dragging Bitcoin below its psychological and technical support near $116,000. Broader crypto market sentiment turned risk-off as large investors reduced exposure, accelerating the sell-off.
Fundamentally, the market remains cautious amid a lack of positive macroeconomic catalysts for risk assets. Speculation about stricter U.S. regulatory oversight and declining inflows into crypto ETFs also dampened sentiment. Combined with hawkish remarks from Fed officials, which keep interest rates elevated, appetite for high-risk assets like Bitcoin weakened further.
From a technical perspective, BTC/USD broke below the major support level of $116,000, confirming bearish pressure. This breakdown followed a period of consolidation, with price failing to maintain bullish momentum. A liquidity hunt appears to be underway, with price revisiting the zone to trap breakout traders before resuming its move.
We are now watching for a confirmed 4H candle close below the liquidity zone. Once confirmed, a short setup is validated, with targets aligned with the next key support zone.
📍 Sell Setup
Entry: Sell Limit at 115,980.00
Stop Loss: 117,985.00
Take Profit: 111,940.00
📌 Disclaimer:
This is not financial advice. Always wait for proper confirmation before executing trades. Manage risk wisely and trade what you see—not what you feel.


BTCUSDBTCUSD also fell from a high level, reaching a high of around 119700, only 300 points away from the target of 120k. The price after the decline is now around 118600. Buying at a low level is the main focus. The reference buying point is 118500-118000. The target is above 120k. Stop loss 117300
BITCOIN BULLISH WEDGE|LONG|
✅BITCOIN is trading in a
Strong uptrend and the coin
Has formed a massive bullish
Wedge pattern so we are
Bullish biased and IF we see
A bullish breakout we will
Be expecting a further
Bullish move up
LONG🚀
✅Like and subscribe to never miss a new idea!✅
Disclosure: I am part of Trade Nation's Influencer program and receive a monthly fee for using their TradingView charts in my analysis.

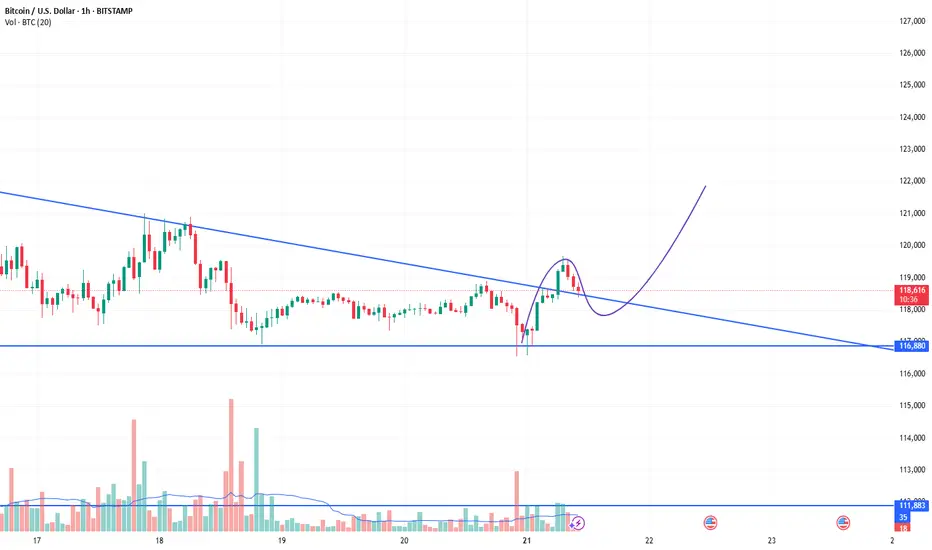
Continuation flag ?Looks like a continuation flag, thoughts?
ETH is in a pullback, BTC didnt have one,
looks like a strong bullish flag


Long -Market Moving in an uptrend
-Market consolidating at a support level
-Market has broken and tested counter down trend trendline.

BTCUSD LOST SHORT-TERM BULLISH POTENTIALBTCUSD LOST SHORT-TERM BULLISH POTENTIAL
Bitcoin has been trading sideways since July 15th within a range of 116,000.00-120,000.00. Indicators show no signs of a new bullish/bearish trend.
How to trade sideways movements or range?
It is better to wait for a price to come close to one of the levels (support or resistance), then open buy/sell order. Or just pace a limit order and wait. Take-profit may be above/below the support/resistance levels with a stop-loss behind these levels (below for the support and above for the resistance).
So, the price decline towards 116,000.00 is expected, where potentially the price may rebound once again.

BTCUSDT pauses before the next big moveAfter a strong breakout in early July, BTCUSDT is now consolidating within a clear range between 116,000 and 120,000 USD. The price has repeatedly bounced from the bottom and faced rejection at the top, forming a well-defined sideways pattern on the H4 chart.
The EMA34 and EMA89 are providing solid support to this accumulation phase. If the 116,000 support zone holds and volume confirms, Bitcoin could resume its previous uptrend and aim for the 124,000 level.
At the moment, this looks like a “breather” zone before the market picks its next direction.
Personally, I’m still expecting another bullish leg—how about you?

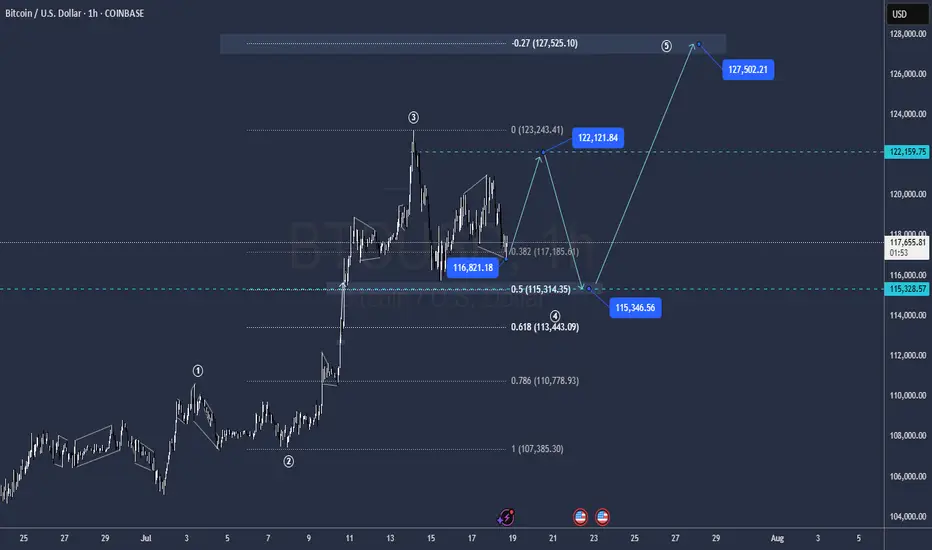
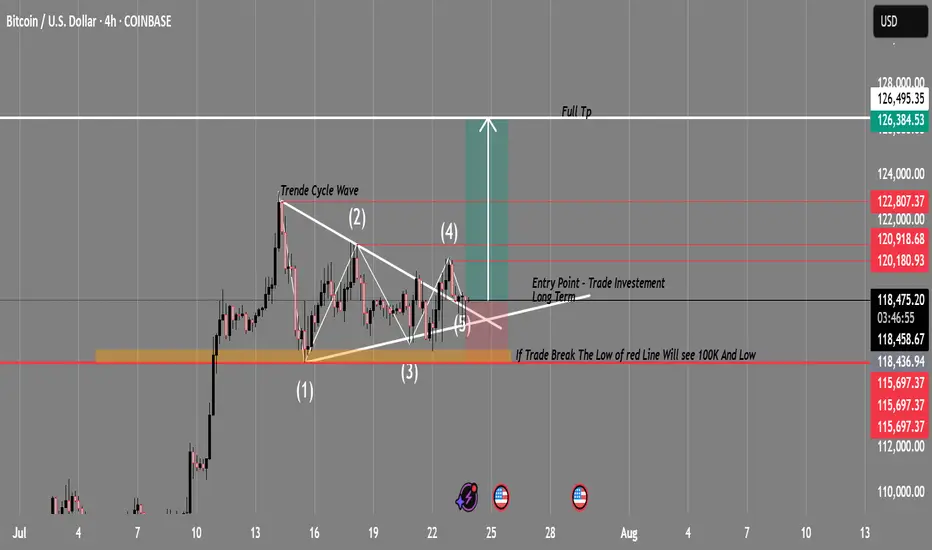
BTC/USD Swing Trade Setup | Breakout Imminent?Timeframe: 4H
Exchange: Coinbase
Strategy: Triangle Breakout + Wave Cycle Analysis
🔍 Technical Overview:
BTC is currently compressing within a symmetrical triangle pattern after completing a 5-wave cycle, suggesting a potential breakout is near. This structure indicates indecision — but also builds up momentum for a major move.
🔹 Wave Analysis: Complete cycle (1-5) within triangle
🔹 Support Zone: 115,697 (critical level — demand zone)
🔹 Resistance Breakout Target: 127,594 (measured move from triangle breakout)
🔹 Entry Point: Confirmed breakout above the triangle resistance (~118,500)
🔹 Invalidation: Strong 4H close below 115,697 = setup invalid
🔹 Risk/Reward: Favorable — breakout above resistance could trigger a strong bullish wave
🟢 Bullish Plan:
Entry: Break + Retest of upper trendline (~118,500)
Stop Loss: Below 115,697
Target 1: 122,800
Target 2: 126,384
Full TP: 127,594
🔴 Bearish Warning:
⚠️ “If price breaks the red support zone (115,697), BTC could drop sharply — possibly toward the 100K level and beyond.”
— a key invalidation level to monitor closely.
🧠 Conclusion:
This is a classic consolidation-to-breakout setup. Monitor volume and breakout confirmation before entering. If bullish momentum holds, this swing trade has great long-term potential.
💬 What do you think? Will BTC break bullish or drop to 100K? Drop your thoughts 👇
📌 Follow for real-time updates and future chart ideas!
BTCUSD Analysis is Ready BTC/USD 30-min chart shows a potential bounce from the support zone around 116,187.5, aiming for a bullish move toward the target at 121,640.6. Price may retrace before pushing upward.

btc . july . w4 . d3 yesterday was beautiful. dOpen was vorhersehbar. wednesday brings liquidity. the chart might not look like much, but i see movement coming. resistance is obvious, price target is violent.

BitcoinBitcoin has fallen below the support area, resulting in the expected quick decline. The price is currently testing the resistance area and must reclaim this level; otherwise, we may see downward movement again. The key level to reclaim is between $106,800 and $107,000.

Bitcoin (BTC/USD) Technical AnalysisBitcoin (BTC/USD) Technical Analysis – Daily Chart Overview
This chart shows a **bullish continuation setup** for Bitcoin, supported by **EMA structure**, **trendline**, and **support zone** validation. Here's the detailed breakdown:
**1. Trend & Structure**
* **Uptrend:** Price is in a clear uptrend, making higher highs and higher lows.
* **Trendline:** The ascending trendline confirms strong upward momentum. It has been respected multiple times, acting as dynamic support.
**2. Key Support Zones**
* **Recent Breakout Zone (\~\$118,000 – \$119,000):**
Bitcoin broke out above this horizontal resistance and is now **retesting it as support**. This is a classic bullish retest pattern.
* The chart suggests that as long as price holds above this zone, **bullish continuation** is expected.
**3. EMA Indicators (Exponential Moving Averages)**
* **7 EMA (Red) – \$118,386**
* **21 EMA (Blue) – \$114,042**
* **50 EMA (Black) – \$109,483**
All EMAs are **sloping upwards** and aligned in bullish order (7 > 21 > 50), confirming strong upside momentum. The price is currently above all EMAs, which supports a continuation of the bullish trend.
**4. Bullish Target**
* The green arrow suggests a projected bullish move with a potential target above **\$130,000–\$132,500**, assuming price holds the support and resumes upward.
**5. Risk Area**
* If BTC closes **below the highlighted support zone (\~\$118,000)**, it could invalidate the bullish structure temporarily and push toward the next support near **\$114,000–\$115,000**.
**Conclusion**
* **Bias:** Bullish
* **Actionable Insight:**
* As long as BTC remains above the \$118K support zone and trendline, **buy dips** or **hold longs**.
* A clean break and close above recent highs (\~\$121K–\$122K) could open the door toward **\$130K+** targets.

Wind up before the big pitch!The longer we coil here, the more vicious the move up will be. Put your tray tables in the upright position and prepare for takeoff...

BTCUSDBTCUSD needs some more correction before we continue the same trend.
Disclosure: We are part of Trade Nation's Influencer program and receive a monthly fee for using their TradingView charts in our analysis.

BTCUSD Bullish energy buildup supported at 114,850The BTCUSD remains in a bullish trend, with recent price action showing signs of a corrective pullback within the broader uptrend.
Support Zone: 114,850 – a key level from previous consolidation. Price is currently testing or approaching this level.
A bullish rebound from 114,850 would confirm ongoing upside momentum, with potential targets at:
122,900 – initial resistance
124,420 – psychological and structural level
126,250 – extended resistance on the longer-term chart
Bearish Scenario:
A confirmed break and daily close below 114,850 would weaken the bullish outlook and suggest deeper downside risk toward:
112,860 – minor support
110,825 – stronger support and potential demand zone
Outlook:
Bullish bias remains intact while the BTCUSD holds above 114,850. A sustained break below this level could shift momentum to the downside in the short term.
This communication is for informational purposes only and should not be viewed as any form of recommendation as to a particular course of action or as investment advice. It is not intended as an offer or solicitation for the purchase or sale of any financial instrument or as an official confirmation of any transaction. Opinions, estimates and assumptions expressed herein are made as of the date of this communication and are subject to change without notice. This communication has been prepared based upon information, including market prices, data and other information, believed to be reliable; however, Trade Nation does not warrant its completeness or accuracy. All market prices and market data contained in or attached to this communication are indicative and subject to change without notice.

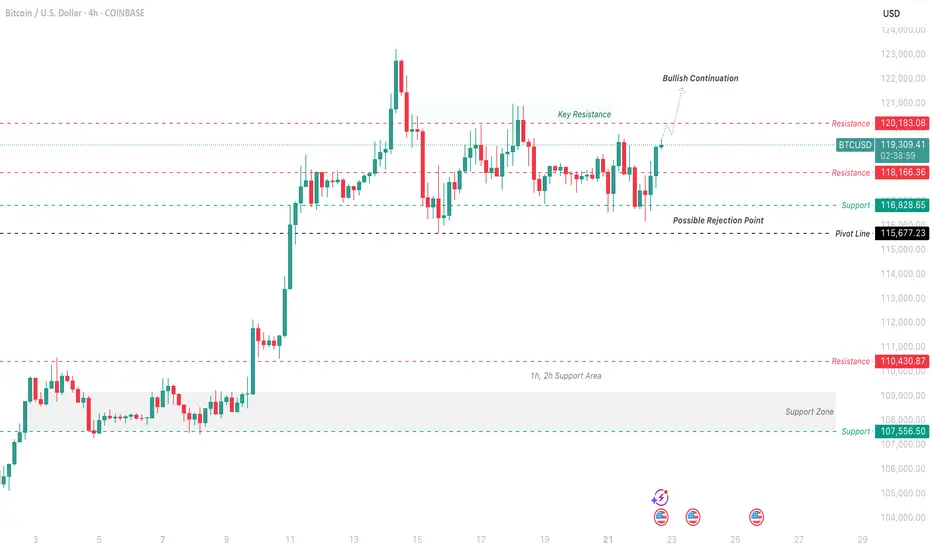
Bitcoin Price Analysis and Bullish Continuation PredictionThis analysis focuses on the Bitcoin/US Dollar 4-hour chart from Coinbase, highlighting a potential bullish continuation based on recent price action as of July 22, 2025. The chart shows a strong upward trend with a recent pullback, suggesting a possible rejection point near the pivot line at $115,672.23.
Putting myself in the reader’s shoes, I’d want to understand the key levels driving this prediction. The 1-hour and 2-hour support area around $107,656.23 has held firm, providing a solid base. The price recently approached the key resistance at $120,183.08, where it faced rejection, indicating a potential ceiling. If the price breaks above this resistance with strong volume, it could signal a continuation toward $123,000.00 or higher.
My thought process involves identifying the pivot point ($115,672.23) as a critical level. A bounce from this level, supported by the 1h/2h support zone, suggests bullish momentum. However, if the price fails to hold above $115,672.23 and drops below $107,656.23, it could invalidate this outlook, pointing to a deeper correction.
Profit Targets:
Short-term: $120,183.08 (key resistance)
Long-term: $123,000.00 (bullish continuation)
Stop Loss: $107,656.23 (below the 1h/2h support area)
These clearly defined targets and stop loss levels should help clarify the trade idea and manage risk effectively.
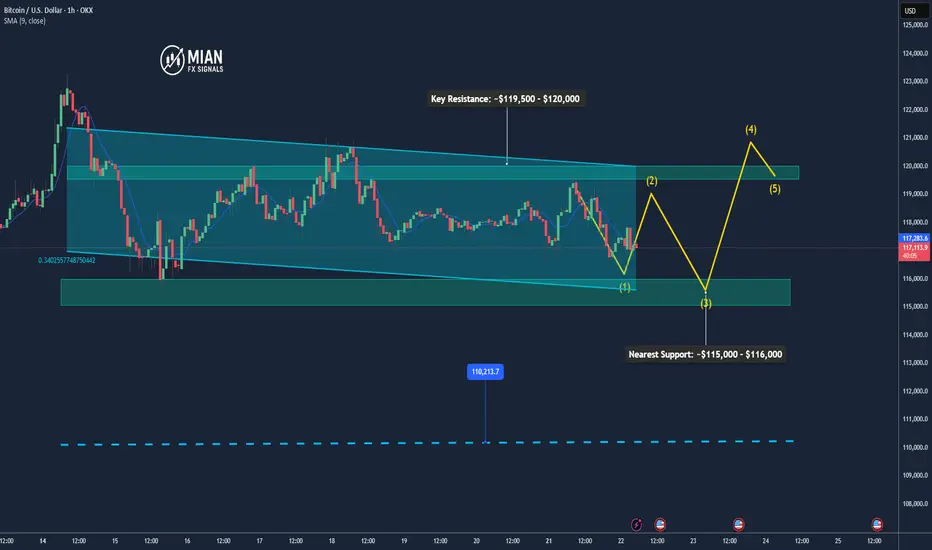
Bitcoin May Pull Back Slightly Before Resuming Uptrend📊 Market Overview
• Bitcoin is currently trading around $116,934, slightly down after hitting an intraday high of $119,524.
• The earlier rally was supported by inflows into Bitcoin ETFs, accumulation by major holders like Trump Media and MicroStrategy, and a pro-crypto regulatory stance in the U.S. (e.g., Genius Act, CLARITY Act).
• However, a surge in whale transfers to exchanges and declining BTC dominance suggests profit-taking and potential short-term volatility.
📉 Technical Analysis
• Key Resistance: ~$119,500 – $120,000 (intraday high and recent ATH)
• Nearest Support: ~$115,000 – $116,000, then $110,000
• EMA 09/20: Price is hovering around EMA 9/20 on H1–H4 timeframes, indicating a short-term uptrend but needing a pause or correction.
• Momentum / Volume: RSI is near overbought territory; falling volume hints at consolidation or a mild pullback. The overall trend remains bullish but slightly unstable.
📌 Opinion
Bitcoin is likely to pull back slightly in the short term toward the $115,000 – $116,000 zone due to profit-taking pressure, before potentially resuming the uptrend if it can break and hold above $119,500 – $120,000 with strong volume.
💡 Trade Setup
SELL BTC/USD at: $118,500 – $119,000
🎯 TP: $116,500
❌ SL: $120,000
BUY BTC/USD at: $115,000 – $116,000
🎯 TP: $118,500 – $119,500
❌ SL: $114,000