BTC Bulls Defend Key Zone Eyes on $123K Breakout ExtensionBitcoin has successfully completed a breakout above the prior weekly high structure, followed by a healthy pullback which is currently unfolding into a bullish pennant formation. The key highlight is how price is retesting the neckline zone with precision, which now doubles as a strong immediate buyback zone.
The reaction from this level is already showing strong bullish momentum, with price gearing up to challenge the previous ATH. A breakout above that resistance should unlock the path toward the projected $116.5k and $123.4k targets as shown on the chart. Failure to hold the Immediate Buyback Zone opens the door toward the Strong Demand Zone, which remains a valid re-accumulation point within this bullish cycle.
Stay sharp. The structure remains intact unless the neckline fails decisively.
BTCUSD.P trade ideas

Bitcoin Weekend ForecastIts in the middel of wave 4 correction, impulses are tradeable
Levels Highlighted in the chart
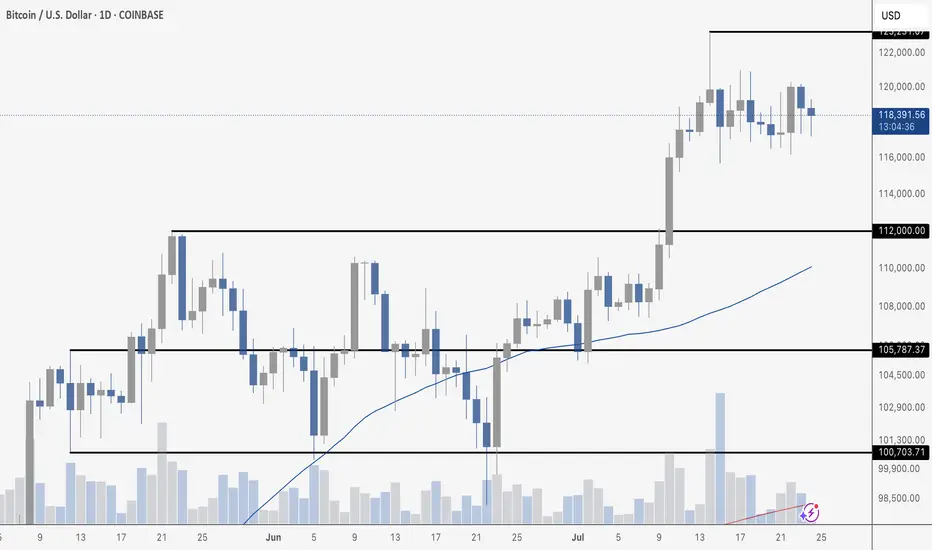
BTC CONSOLIDATESBitcoin is clearly consolidating after its recent breakout above $112K. Price is chopping between roughly $116K and $121K, taking a breather after last week’s rally. Tuesday marked the highest daily close in BTC history, but follow-through has been muted so far.
Volume is trending lower during this range-bound action, which is typical during consolidation. The 50-day moving average continues to rise and now sits around $110K, providing a strong cushion if price pulls back.
The structure remains bullish above $112K, but traders are watching for a breakout above $125K to confirm the next leg higher. Until then, expect more chop as the market digests gains.
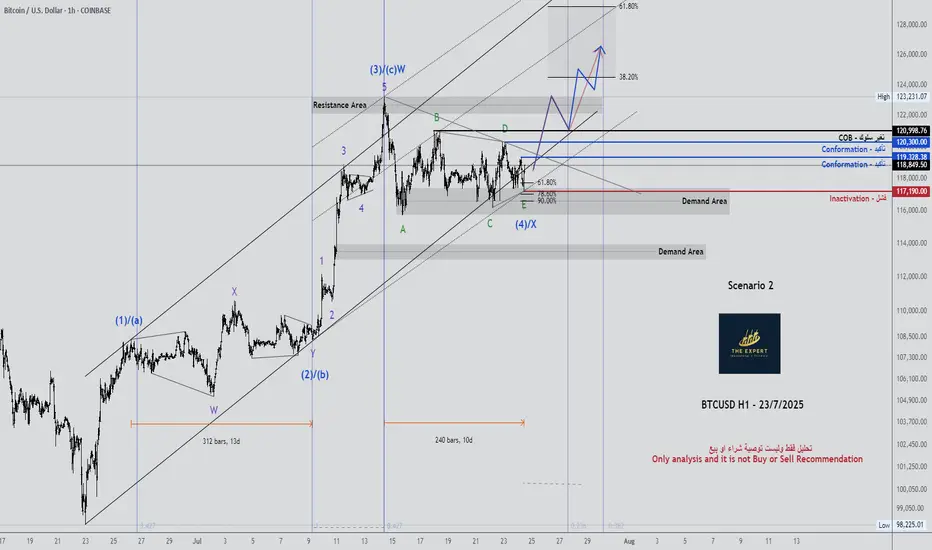
BTCUSD H1 - Updated 23/7/2025BTCUSD H1 - Updated 23/7/2025
chart has language
Only analysis and it is not Buy or Sell Recommendation.
Good-luck.
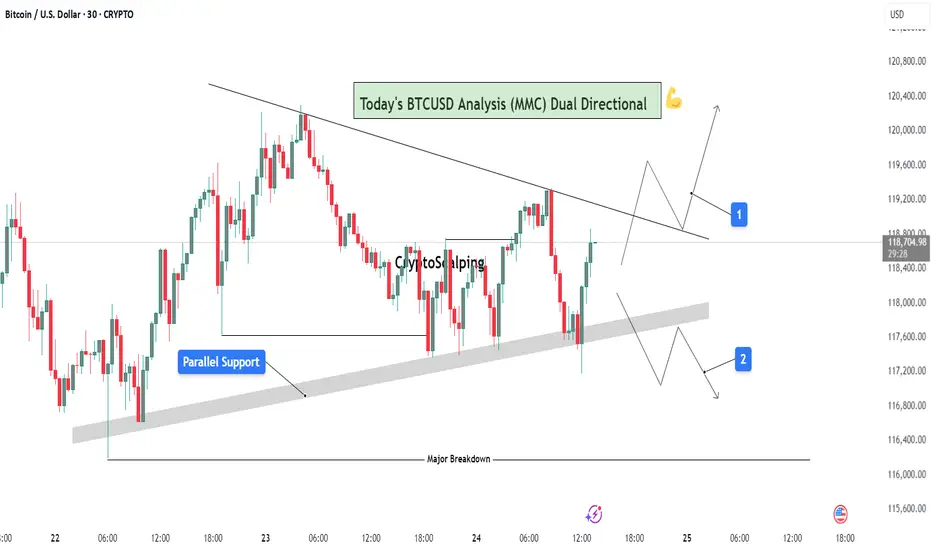
BTCUSD Analysis (MMC) : Dual Directional Outlook let's See🔍 1. Overview of Structure & Context:
On the 30-minute timeframe, BTCUSD is consolidating between two strong technical zones:
A descending trendline acting as resistance
A parallel rising support forming a compression zone
This wedge-like formation signals a potential high-impact move in either direction — a dual-directional outlook. Price is currently testing the midpoint between resistance and support, offering two reactive trade scenarios.
🟦 2. Key Zones Highlighted on Chart:
🔹 A. Parallel Support Zone (Dynamic Support):
A grey-shaded rising support has been tested multiple times.
Each bounce suggests buying strength near this diagonal zone.
This zone represents smart money accumulation potential under MMC concepts.
As price approaches this zone again, bulls are expected to step in if momentum aligns.
🔹 B. Descending Resistance Line (Supply Line):
The market is facing lower highs, a sign of bearish control at higher levels.
Each retest of this line has led to a rejection.
This line also acts as a liquidity magnet — price may spike above it to trap buyers before dropping (false breakout potential).
🧭 3. Scenarios and Trade Possibilities (Dual Directional Path):
✅ Scenario 1: Bullish Breakout – (Marked as Path 1)
If BTC breaks above the descending trendline with strong bullish volume, this confirms a structural breakout.
This setup targets:
First level: $119,600
Second level: $120,200
Once broken, the trendline can flip into support.
Ideal confirmation:
Bullish engulfing candle on breakout
Retest of broken resistance turning into support
Volume surge or momentum indicators turning bullish
⚠️ Scenario 2: Bearish Rejection & Breakdown – (Marked as Path 2)
If BTC fails to break resistance and breaks below the parallel support zone, it opens a bearish scenario.
Price may fall back to:
First level: $117,200
Final key support: $116,400 (Major Breakdown Zone)
This is a typical MMC-style mirror move: a structure break leading to liquidity run toward a previous demand zone.
Bearish confirmation:
Close below grey zone
Lower high formation near resistance
Increasing bearish volume / weak bounce
📐 4. Strategy & Trading Tips (MMC Application):
Under the Mirror Market Concepts (MMC), these zones are not just technical levels — they represent emotional price memory of both institutional and retail players.
Wait for the reaction, not prediction.
Use confluence tools (RSI divergence, volume, candle patterns).
Avoid trading inside the wedge — it's a trap zone.
Ideal entries are at breakout with retest confirmation or rejection from major zones.
📊 Risk Management Plan:
Entry Type Trigger Level SL Suggestion TP Range
Long Trade Break & retest above $118.8K Below $118.2K $119.6K → $120.2K
Short Trade Breakdown below $117.8K Above $118.2K $117.2K → $116.4K
🧠 Conclusion:
BTC is in a decision-making zone between a downward pressure line and strong support. A breakout could lead to a clean trend continuation, while a breakdown would trigger bearish momentum. The chart reflects precision MMC logic, offering a tactical map for day traders and scalpers to follow the smart money — not the noise.
Let the market decide direction. We just need to be prepared, not predictive.
BTCUSD LOST SHORT-TERM BULLISH POTENTIALBTCUSD LOST SHORT-TERM BULLISH POTENTIAL
Bitcoin has been trading sideways since July 15th within a range of 116,000.00-120,000.00. Indicators show no signs of a new bullish/bearish trend.
How to trade sideways movements or range?
It is better to wait for a price to come close to one of the levels (support or resistance), then open buy/sell order. Or just pace a limit order and wait. Take-profit may be above/below the support/resistance levels with a stop-loss behind these levels (below for the support and above for the resistance).
So, the price decline towards 116,000.00 is expected, where potentially the price may rebound once again.

A good time to reentry Short BTCAlways i nice to reentry in profits
entry level 119.000
targets 116.600 / 115.600
SL 119.600
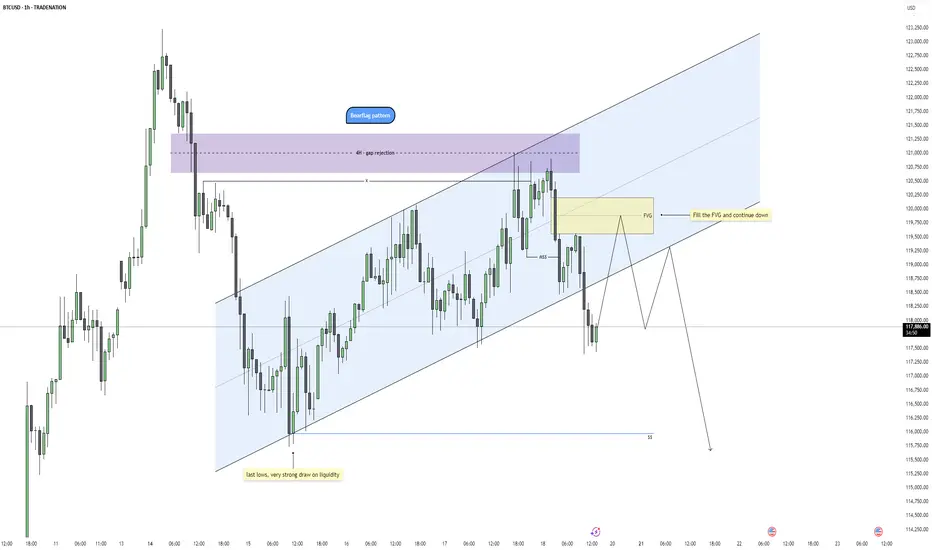
Bitcoin - Bearflag Structure Taking ShapeBitcoin is showing signs of weakness after a clean rejection from a 4H fair value gap, where price also swept the previous swing high. This aligns well with a broader bearish context as the market failed to sustain above the upper bounds of the trend channel, indicating potential exhaustion of the bullish correction.
Rejection Zone and Fair Value Gap
The rejection took place precisely within a 4H imbalance, adding confluence to the idea that this was a premium retracement in a bearish leg. The high formed inside that zone has now been swept, setting up conditions for distribution. A smaller 1H fair value gap was also left behind during the displacement move down, creating a clean area for price to return to and potentially react from.
Channel Structure and Bearflag Formation
Structurally, price has been climbing in a rising channel that resembles a bearflag pattern. The recent market structure shift broke the channel low, confirming that the rising structure is likely corrective. The rejection from the top of the flag and the subsequent breakdown align with a typical bearflag setup, suggesting a continuation move to the downside.
Short-Term Retracement Expectation
Before the next leg down, price may retrace to fill the unmitigated fair value gap while possibly sweeping the minor swing high that caused the current drop. This retracement would offer a premium shorting opportunity in alignment with the bearish bias, especially if internal structure remains weak on the lower timeframes during the return to the FVG.
Draw on Liquidity and Price Objective
The main objective for this setup is a sweep of the last equal lows near 115950, which represents a strong draw on liquidity. If the bearflag setup plays out fully, this area is highly vulnerable and could be the next significant target once the FVG is filled and lower timeframe distribution confirms.
Conclusion
Price has rejected from a 4H imbalance and swept liquidity to the upside, forming a clean bearflag structure. As long as price remains below the recent high and fills the 1H FVG without invalidating the shift, the path of least resistance looks to be down toward the liquidity resting below 115950. I’ll be watching for signs of weakness during the return to the FVG for a potential short trigger.
Disclosure: I am part of Trade Nation's Influencer program and receive a monthly fee for using their TradingView charts in my analysis.
___________________________________
Thanks for your support!
If you found this idea helpful or learned something new, drop a like 👍 and leave a comment, I’d love to hear your thoughts! 🚀
BuyRejection Level
Daily Volume
Market Structure Shift
London Session
Trend Line Break
Untapped Order Point
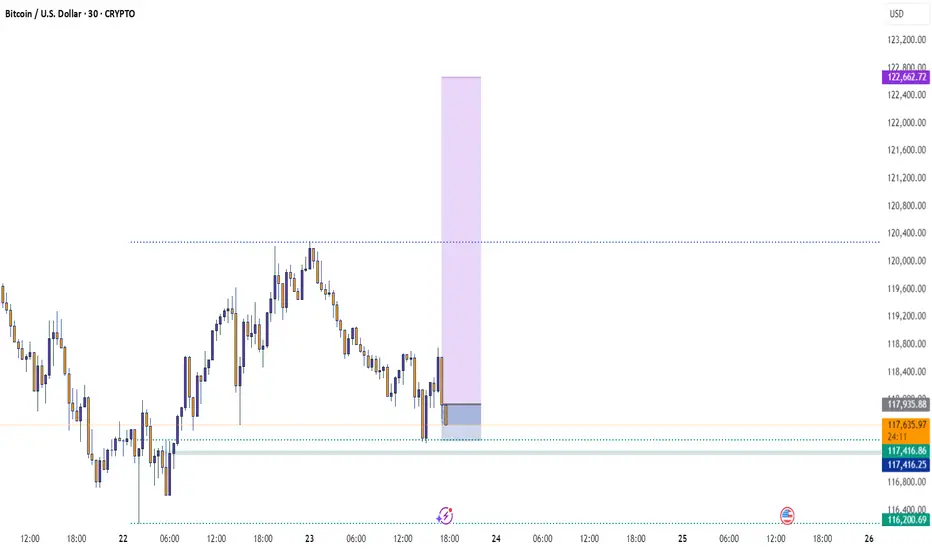
BTCUSD Analysis is Ready BTC/USD 30-min chart shows a potential bounce from the support zone around 116,187.5, aiming for a bullish move toward the target at 121,640.6. Price may retrace before pushing upward.

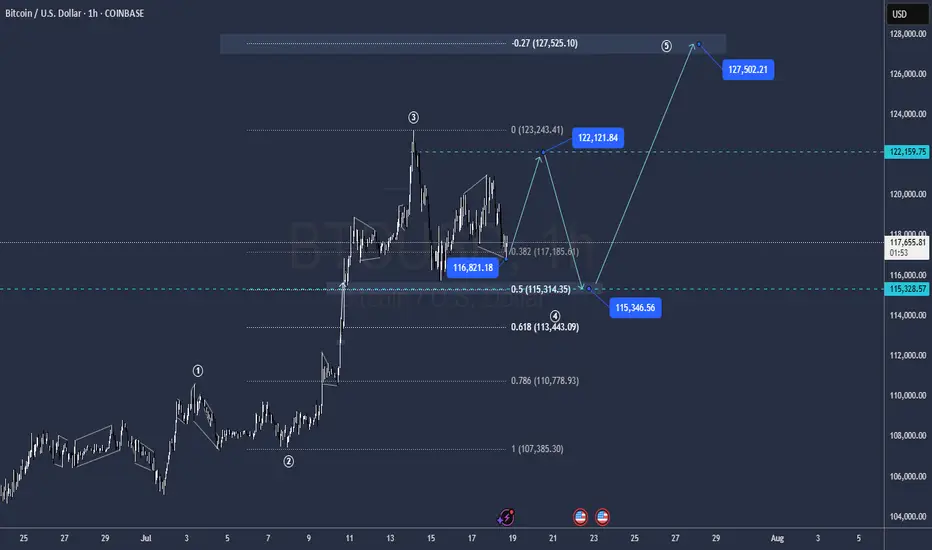
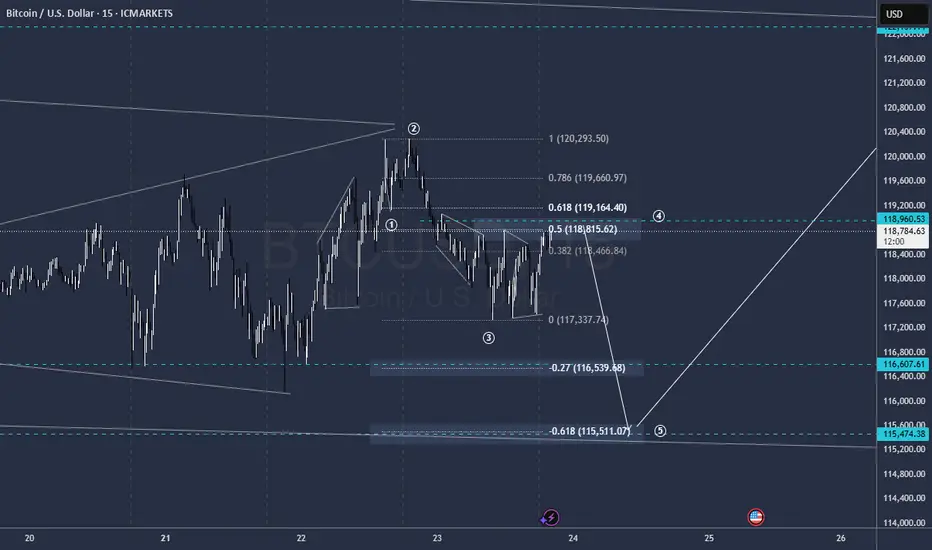
BTC Ready for the new impulse ? Elliott wave analysis 20/7/2025In my view, Bitcoin (BTC) has completed its micro correction and is now poised to move toward the $135,000–$139,000 target zone. This expectation is supported by the following factors:
1. Completion of the Sub-Waves in Wave (4)
My analysis of wave (4) indicates that it consists of an ABC correction, where wave B formed a WXYXZ pattern.
Additionally, I have counted the sub-waves within wave C of wave (4) and observed a complete 5-wave structure, suggesting that the fifth wave of wave C has ended, confirming the completion of wave (4).
2. Cypher Harmonic Pattern Pivot Point
I have identified a Cypher harmonic pattern with a pivot point around $116,600.
The termination of wave (4) occurred close to this pivot level, followed by a new impulsive move that made a higher high and formed a clear 5-wave structure—further confirming that wave (4) has likely ended.
3. Hidden Bullish Divergence on the 4-Hour Timeframe
A hidden bullish divergence can be observed on the 4-hour chart, particularly at the end of wave (a) and wave (c).
Historically, 4-hour hidden bullish divergences have often preceded strong bullish impulses. For instance, a similar setup occurred during the bullish rally from April 9, 2025, to May 22, 2025.
4. Failure to Make a New Low After Resistance Retest
The new impulse wave that emerged after the end of wave (4) has met resistance but failed to make a new low, suggesting that a fresh upward impulse is underway.
How Far Could Wave (5) Extend?
It is important to note that the wave (5) (blue) impulse is a sub-wave of wave (5) (purple).
The lengths of wave (3) (purple) and wave (5) (purple) are currently similar, which is unlikely because both are part of the major wave V (green), where typically only one wave should extend.
Since wave (3) has already completed, wave (5) is likely to be the extended wave, with a target length between 1.272 and 1.618 times the length of wave (3).
Interestingly, two Gann fan projections point to resistance levels in the $135,000–$139,000 range, which perfectly aligns with this 1.272–1.618 extension zone.
Invalidation Point
The invalidation level is around $117,000, as the micro correction within the new impulse should not drop this low.
If BTC falls below $117,000, it could imply that wave (4) has not yet completed and may be taking another corrective form.
For example, the wave (c) we currently see might only be wave 1 of a larger wave (c), or the correction in wave (b) may still be ongoing.
However, this scenario seems unlikely given the weight of evidence suggesting that wave (4) has already ended.

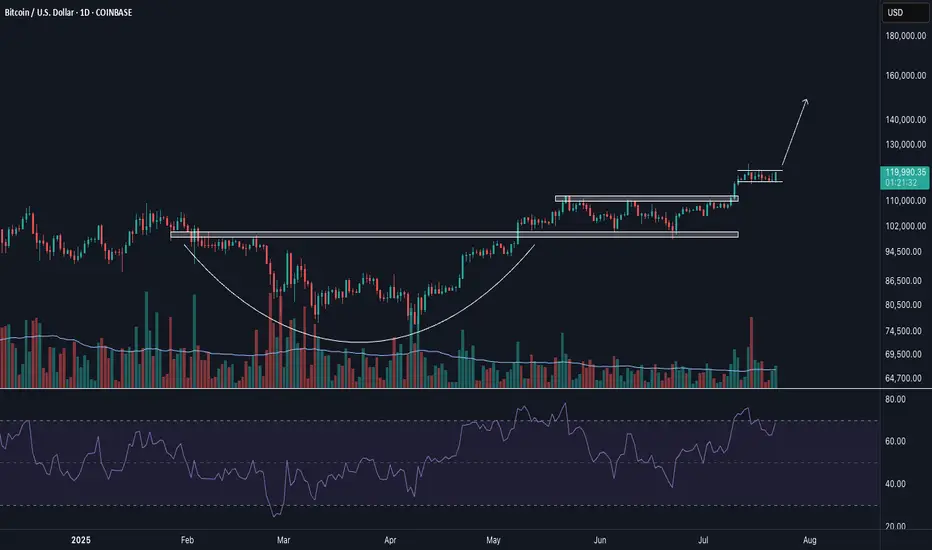
StairsteppingBitcoin ready for another breakout. If this is anything like previous cycles, likely see a 3-4 month uptrend that goes parabolic and off this screen.
Macro + regulatory tailwinds
BTCUSDBUY Call retest must
Quick trade setup 30min
Risk free your trade once reach point metioned
Looks bullish move

BTCStill range bound but the breakout is inevitable
Imho these are BTC last big moves.
And we get to do it all over again

Bitcoin profit booking at this Price level 119675 Bitcoin is making higher high and giving flag fathernow in a range bound zone due to profit booking and and Here we may take a short trade sell 119500, sl-121800, tgt 1108500, 99500🚩🚩

"BTC/USD Breakout Strategy: Identifying Bullish Momentum BTC/USD Technical Analysis – July 22, 2025
📈 Market Structure Overview:
The chart illustrates a recent Break of Structure (BOS) both to the upside and downside, indicating volatility and a shift in market sentiment. The price action formed a descending channel, followed by a breakout with strong bullish candles, suggesting a momentum reversal.
🧱 Support Zone (Demand Area):
Key Level: $116,400 – $116,900
This zone has acted as a strong demand level, with clear evidence of buying pressure pushing BTC higher after testing this area. The volume profile (VRVP) supports this, showing heightened trading activity at this price.
🔄 Bullish Breakout Confirmation:
A bullish breakout from the descending channel occurred just above the support zone, aligning with the label "Bullish Momentum".
The breakout candle has closed above minor resistance, which increases the probability of a trend reversal.
📍 Price Target:
The projection points toward $120,000, aligning with previous resistance and psychological round-number resistance.
This target is highlighted by an expected bullish leg after a possible retest of the breakout zone around $117,500 – $117,800.
🧭 Key Levels to Watch:
Support: $116,400 – $116,900
Retest Zone (Buy Opportunity): $117,500 – $117,800
Immediate Resistance: $118,400
Major Resistance / Target: $120,000
📊 Summary:
BTC/USD has shown a bullish reversal signal from a well-respected support zone after a descending correction phase. The current price structure, volume buildup, and breakout momentum suggest a high probability of continued upside movement toward the $120,000 mark. A successful retest of the breakout zone would provide a strategic entry for long positions with tight risk management.

Btcusd:Huge trading opportunities and ideasBTCUSD's rebound after touching the position near 116180 this time is fast. From the trend observation. BTCUSD is still in a high consolidation stage. It has not broken the oscillation range for the time being. It can maintain selling near 120k. Buying near 11600 for range trading. It is expected that there will not be many trading opportunities in the London market. It will take until the New York market opens to see better trading opportunities.

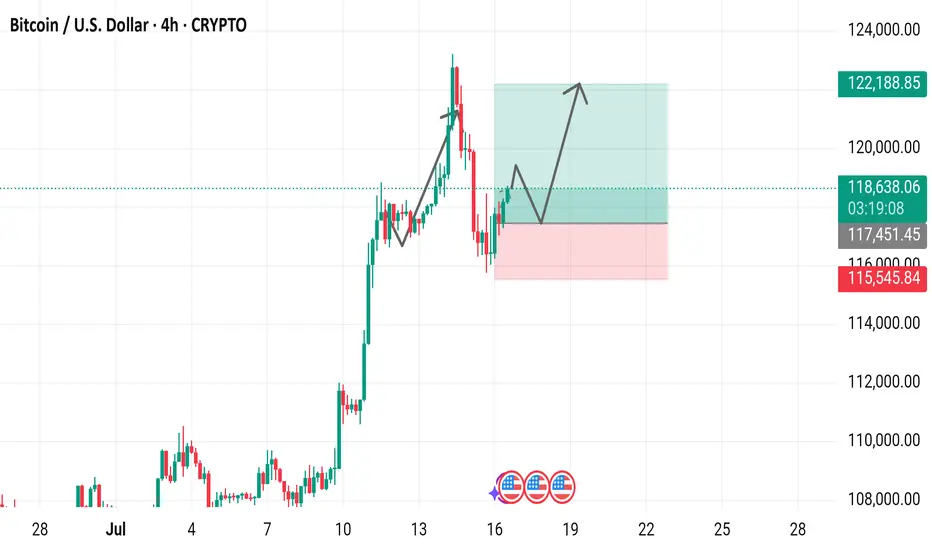
Bitcoin / U.S. Dollar 4-Hour Chart (July 2025)4-hour price movement of Bitcoin (BTC) against the U.S. Dollar (USD). The price has risen from 118,714.64 to 118,714.64 (+937.9 or +0.80%) over the period. Key levels include a support zone around 115,451.45 to 117,451.45 and a resistance zone near 120,000.00 to 122,188.85,
SellRejection Level
Daily Volume
Market Structure Shift
London Session
Trend Line Break
Untapped Order Point

Bitcoin ConsolidatesBitcoin continues to flex its strength, grinding higher and holding firm just below resistance at $123,231. After breaking out above $112,000 earlier this month with a burst of volume and momentum, price has cooled off slightly, consolidating in a tight range between $117K and $123K. This isn’t weakness – it’s digestion. A bullish pause. Traders are clearly eyeing the next move, and so far, the chart looks like it’s winding up for another push.
Support at $112,000 has held cleanly, and the 50-day moving average is trending steadily upward, now comfortably below price – a textbook sign of bullish structure. If $123K breaks, it could set off a new leg higher, potentially triggering another wave of FOMO. But even a drop back to $112K would keep the uptrend intact, with secondary support around $105K offering a strong safety net.
Volume tells the story too. It surged during the breakout and has since tapered off, which is exactly what you’d expect during a calm consolidation. In short: BTC looks healthy, poised, and still in charge. The next big move could be just around the corner – and right now, the bulls have the edge.

BITCOIN - Price can bounce up from support line to $125000Hi guys, this is my overview for BTCUSD, feel free to check it and write your feedback in comments👊
For a long time, the price was trading sideways inside a wide flat range between the $99000 support area and the $112000 resistance level.
After accumulating volume, bitcoin made a strong upward impulse and performed a breakout, pushing above the top of the flat.
Following this movement, the price action began to form a rising wedge pattern, moving between its clear support and resistance lines.
Recently, price tested the resistance line of the wedge and then started a predictable correction back down towards support.
Now, BTC is approaching the support line of the wedge, which aligns with the important horizontal support area around $112000-$113500.
I expect that the price can test this support line and then bounce up to the $125000 resistance line of the wedge.
If this post is useful to you, you can support me with like/boost and advice in comments❤️
Disclaimer: As part of ThinkMarkets’ Influencer Program, I am sponsored to share and publish their charts in my analysis.

Total to 5T & BTC to...?Morning fellas,
No way BTC is stopping here. People are gonna get reckt shorting, and are not gonna believe where this price action is gonna stop.
TOTAL must reach anywhere between 4.5T & 5T, this spread across all Alts.
It has been a long time coming, and the party hasnt even started yet.
Hold your horses and trade thirsty, my friends!

