Bitcoin: Setup Builds for a Run Back Towards the HighsBitcoin is coiling within what resembles a bull pennant pattern, hinting at another bout of consolidation before the rally resumes. Trading near the lower end of the recent range, Monday’s pullback offers an appealing entry point, allowing longs to be established around current levels with a stop beneath the July 15 low for protection.
The downtrend from the record highs looms as the first hurdle, sitting around $119,700 today. A break above that level could prompt an accelerated move towards the current record high just above $123,000—an appropriate target for the trade.
Good luck!
DS
BTCUSD.P trade ideas
BTC Bottom Regression Channel RevisitFisher is head south and a breakdown to the bottom of the regression channel is likely.

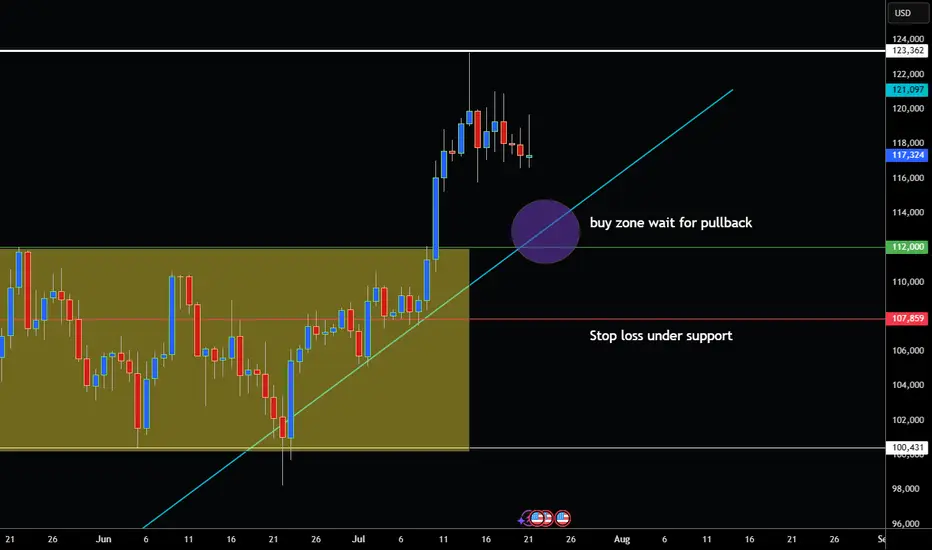
BITCOIN BTC/USD PULLBACK STARTED BACK TO BUYZONE?Hey Traders so today looking at Bitcoin showing a strong Uptrend since April this year. Now showing more bullish momentum after a break above the narrow sideways channel at 112,000. Breakouts normally get retested. Also the best place to buy imo is right at the trend line.
The way I like to trade it is don't chase the market let it come to you. It takes patience but you will always get the best price for your trade if you are willing to wait. However some might disagree with this strategy and say you may miss the move because the market doesn't come back.
I say Who Cares if the market comes back or if it keeps rallying! 🤣
There is always another train at the station (anotherwords there are always other trading opportunities so if we miss one big deal we will another one. Most importantly we will find another one with the best price!
Anyway enough of my rant so if your bullish watch for that pullack to around 112,00-113,000 and put a stop loss below support at 107,500. It looks like a safe level not to get stopped out at.
However if Bearish wait for close below support at 107,500 before considering to sell a rally imo.
Good Luck & Always use Risk Management!
(Just in we are wrong in our analysis most experts recommend never to risk more than 2% of your account equity on any given trade.)
Hope This Helps Your Trading 😃
Clifford
BUY BTCUSD now for 4h time frame bullish trend continuation BUY BTCUSD now for 4h time frame bullish trend continuation ...............
STOP LOSS: 115,836
This buy trade setup is based on hidden bullish divergence trend continuation trading pattern ...
Always remember, the trend is your friend, so whenever you can get a signal that the trend will continue, then good for you to be part of it
TAKE PROFIT : take profit will be when the trend comes to an end, feel from to send me a direct DM if you have any question about take profit or anything...
Remember to risk only what you are comfortable with... trading with the trend, patient and good risk management is the key to success here

BTCUSD - BEARISH DIVERGENCE DETECTEDCAPITALCOM:BTCUSD
BTCUSD has been in a bullish trend over the past few hours and is now approaching the resistance at 119,500.00.
On the hourly chart, a bearish hammer has formed alongside a stochastic divergence, signaling potential downside.
⚡ This signal is reinforced by a strong resistance level above, adding weight to a possible pullback scenario.
📉 If BTCUSD rebounds from this level, consider Sell setups with take profit at the nearest support.
📈 If it breaks out, look for Buy opportunities on confirmation.
⚡ We use Stoch (14) to spot potential reversals when it exits overbought or oversold zones — helping you catch clear, confident entries.

BTCUSDBTCUSD needs some more correction before we continue the same trend.
Disclosure: We are part of Trade Nation's Influencer program and receive a monthly fee for using their TradingView charts in our analysis.


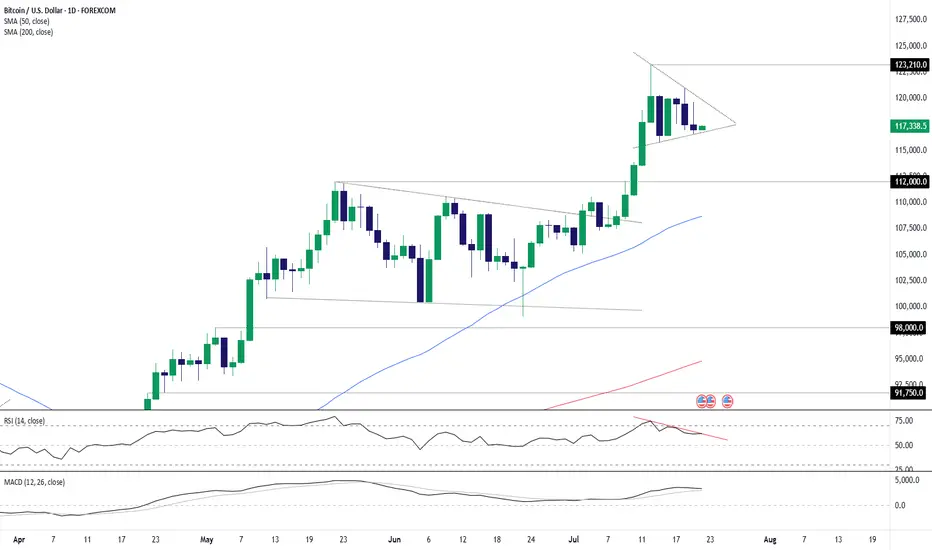
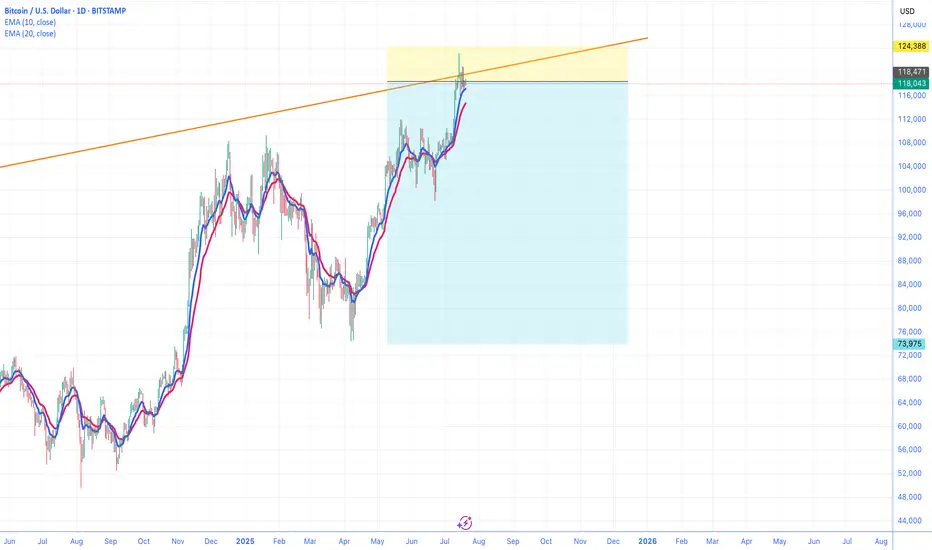
BTC CONSOLIDATESBitcoin continues to consolidate just below resistance after a strong multi-week rally, currently trading around $118,813. Last week’s candle was notably toppy, with a long wick to the upside that hinted at some exhaustion near the highs. Despite that, this week’s price action has remained relatively firm, suggesting the bulls are still in control for now. The key overhead resistance remains at $123,231 – a level that marked the recent high – and BTC has yet to close above it. Support at $112,000, previously a ceiling during the consolidation in May and June, has now flipped to critical support and must hold to maintain the bullish structure.
Volume has declined modestly since the breakout in early July, a typical sign of consolidation rather than distribution. The 50-week moving average continues to rise and now sits well below price around the $89,000 zone, confirming strong momentum. Still, traders should remain cautious here – failure to break above resistance or a close below $112,000 could lead to a deeper pullback toward the mid-$90K range. Until then, this remains a textbook consolidation just beneath resistance in a larger uptrend, with the potential for a breakout continuation if strength returns.

Find a recovery point to continue buying BTC✏️ CRYPTO:BTCUSD is trading near the all-time high. The trading strategy is to wait for some investors to take profit so that the price can return to the nearest support zones and continue to buy to the new all-time high zones.
📉 Key Levels
BUY Trigger: confirms the recovery from the support trend line 116000
BUY zone 112000 (Strong support zone)
Target 129000
Leave your comments on the idea. I am happy to read your views.
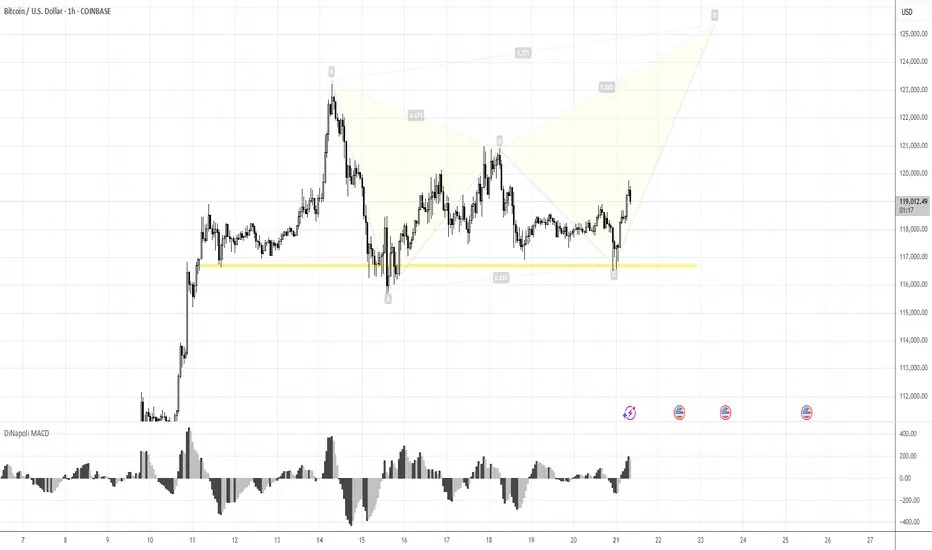
Risk 116. Target 123-125KMorning folks,
Prior 1H H&S was done, we were watching on 120K resistance area, as we said last time. Now, on 1H chart H&S is showing signs of failure - too extended right arm, no downside breakout. Price is taking the shape of triangle . All these signs are bullish. Because butterflies very often appear on a ruins of H&S, we suggest that this one could be formed here...
The risk level for this scenario is 116K lows - BTC has to stay above it to keep butterfly (and triangle) valid, otherwise, deeper retracement to 112K area could start.
Upside target starts from 123K top and up to 125K butterfly target.
Bitcoin: Genius is on the scene The U.S. House passed the Genius Act on July 17, following Senate approval in June. The bill sets comprehensive federal standards for stablecoins, clearing the way for banks and fintechs to issue them under clear reserve and audit rules. This represents a new milestone for the crypto market, and its leading coin - BTC. During the week, BTC managed to hold steady above the $118K. On Tuesday, there has been one attempt to push the price toward the $116, however, the price swiftly returned to the previous grounds. The highest weekly level reached was at $122,8K, reached on Monday, however, this level was also unsustainable. The majority of trades during the week were around $118,5K.
The RSI modestly moved from the overbought market side, ending the week at the level of 65. This could be an indication of a forthcoming price reversal, however, considering strong demand for BTC, such a move could be easily postponed. The MA50 started again to diverge from MA200, indicating that there will be no cross of two lines in the coming period.
BTC managed to hold levels above the $118K, which is an indication that investors are still not ready to sell in higher volumes, in order to take profits. The RSI is indicating potential for a short reversal, however, in the current circumstances, it might be postponed. A move toward the higher grounds is also quite possible, especially taking into account BTCs recent push toward the $122K. At this moment charts are pointing to equal probabilities for a move toward both sides. On one hand, the $116K support was indicated through price during the previous week, as well as the $122K. The start of the week ahead will determine which side will prevail in the week ahead.

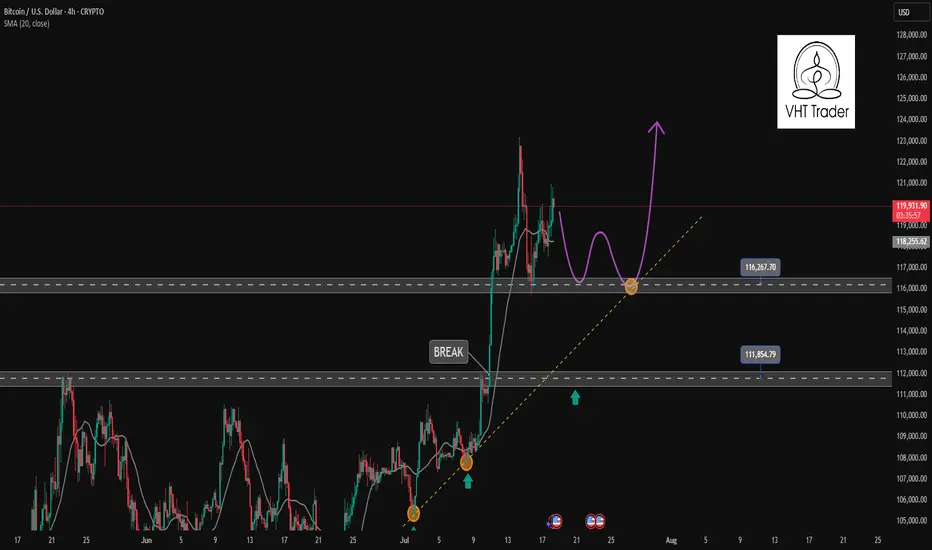
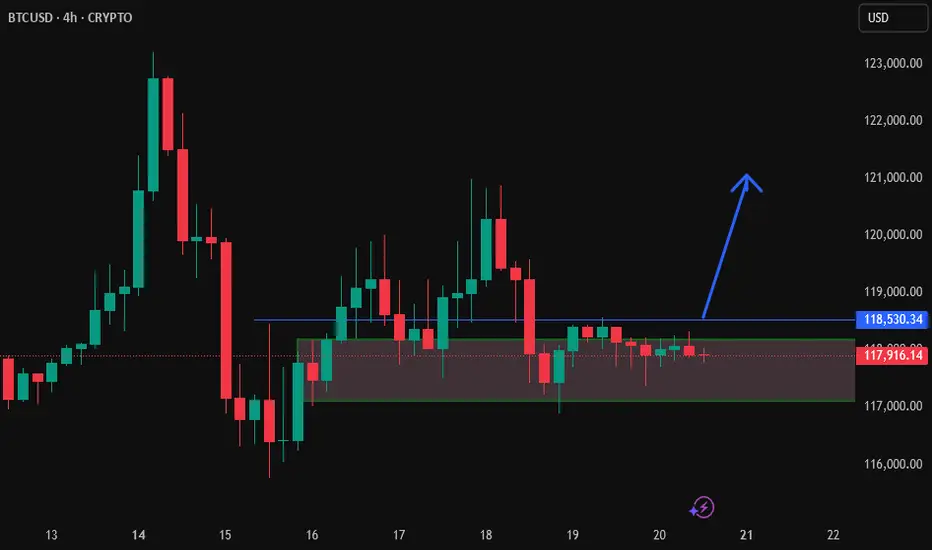
Bullish Bitcoin!BINANCE:BTCUSD : Nothing Changed, Still Bullish
BTC still maintains a strong upward momentum. Immediate strong support was found again near 116K.
It seems that the market has set a new low for BTC around this area for now. We think that as long as BTC stays above this area, there is a good chance that the increasing volume and buyers will increase further pushing BTC further, as shown in the chart, to 120,600; 122,400; 125,000 and 127,000.

Sell BTCUSDPrice had taken liquidity and broke cisd and mss. Trump also swears to make america great again...usd should grow stronger.
What say you?
BTCUSD has Breakout from major resistance of 110 K and now takinBTCUSD has Breakout from major resistance of 110 K and now taking pause by consolidation

TheKing Cycles- Nothing can be perfect in Life or in Trading, but you can always brighten up your day.
- Remember "Cycles are Cycles"
- Everything is in graph
- You can follow bears, predicting 10 years of recession, but we are in a big recession and for a long time already.
- You can fall in the deep and predict the darkness.
- i like to see the sunshine in the morning and i will always radiate warmth.
- Follow Hope, and always believe in your own judgement.
- Be Bold and do the opposite of what commons peoples think.
Happy Tr4Ding !

LONG BTC hello.
i m expecting to long from the w biSI
and the target is the projection
of course i will not go in without confirmation and 4 h bisi would be good
i will wait the price to give me an 4 h bisi then i will buy .targets are on the chart 1.62 fibo
is perfect

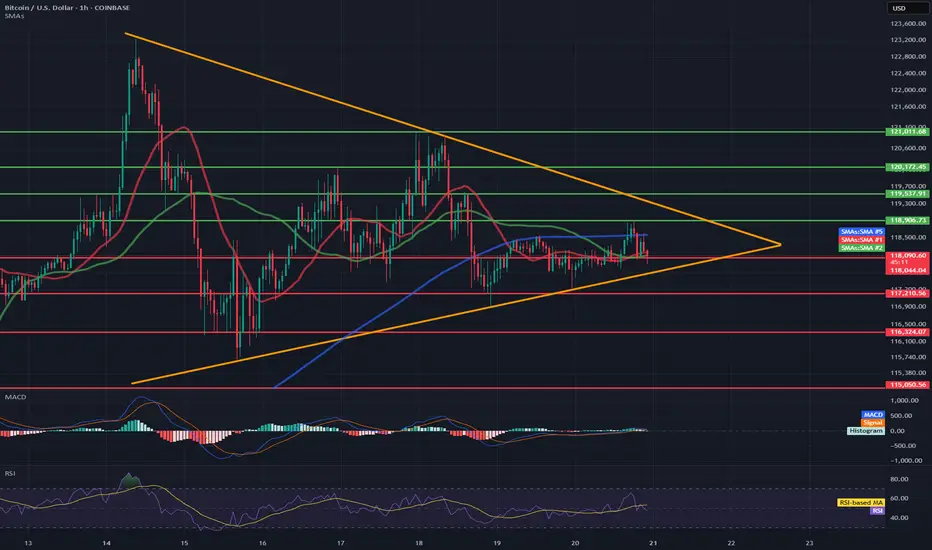
BTC/USD Short-Term🔷 Pattern: Symmetrical Triangle (Consolidation)
The price is inside the triangle formation (orange lines) and is approaching its completion.
An impending breakout (up or down) is highly probable within the next few hours.
📉 Support Levels (red lines):
117.210 – local horizontal support.
116.324 – 115.050 – strong demand zone (potential target in the event of a downward breakout).
📈 Resistance Levels (green lines):
118.900 – 119.700 – local resistance zone.
121.011 – 121.813 – higher target in the event of an upward breakout from the triangle.
📊 Technical indicators:
✅ RSI (Relative Strength Index):
Currently: 69.05 – close to overbought levels, but not yet at an extreme.
Potential for a short-term pullback unless a strong breakout occurs.
✅ MACD:
Signal lines are tightly intertwined, histogram flat → no dominant momentum.
Waiting for a breakout signal (bullish or bearish crossover).
✅ SMA:
Price currently below the 50 and 200 SMA for 1 hour → slight downward momentum.
The 50-SMA (red) is turning down, which may signal a continuation of the sideways or downward trend.
📌 Short-term conclusions (1–6 hours):
Scenario 1: Bullish breakout:
Confirmation: H1 candle close above 118,900.
Targets: 119,700 and potentially 121,000–121,800.
Scenario 2: Bearish breakout:
Confirmation: H1 candle close below 117,200.
Targets: 116,300, then 115,000–115,300.
📍 Watch for:
Breakout of the triangle boundaries with volume.
RSI behavior relative to the 70 level.
MACD crossover and histogram.
BTC Daily Outlook
In my opinion, Bitcoin looks like it might need a short pause here.
📉 It's sitting just below a key Fib level and may require some time to consolidate before making another attempt.
📌 Price is printing a possible second close below the BB center.
📉 SMA is below the BB center — not ideal.
📊 Volume saw a strong red spike on July 15
📉 OBV formed a lower high while price remains elevated (granted, it’s the weekend and volume tends to dip).
📉 RSI is below 70 and under its moving average.
Too early for a strong conclusion — but this is a caution signal.
Let’s stay alert and watch it unfold together.
Always take profits and manage risk.
Interaction is welcome.

btcusd sl;116.7k
Bitcoin is the first ever cryptocurrency to exist, which was created in 2009 by Satoshi Nakamoto and has since become the most valuable asset on the digital market. It operates without the need for intermediaries, relying solely on cryptography and netw
BTCUSD Outlook – Probabilistic Trade Setup in AI Liquidity Cycle
📈 BTCUSD Outlook – Probabilistic Trade Setup in AI Liquidity Cycle
🧠 WaverVanir DSS | VolanX Protocol | SMC x Institutional Forecast Alignment
We are now entering a pivotal BTC phase. Multiple timeframes and AI-backed forecasts converge on a low-volatility accumulation breakout, with price structure aligning for a leg toward $127K–134K. However, short-term model dispersion requires precise risk management.
🧠 Technical Confluence (SMC + Fib):
Clean BOS + CHoCH confirms bullish structure
Retest of equilibrium zone around $116.8K–$117.2K
Institutional FVG demand sits at $115.4K
Fibonacci extensions align with:
🎯 Target 1: $127,065
🎯 Target 2: $133,182
🎯 Max Extension: $134,397
🌐 Macro + Fundamental Catalysts:
Spot BTC ETF inflows remain net positive
AI liquidity theme continues to push institutional demand into BTC and ETH as non-correlated inflation hedges
Fed pivot odds increasing toward Q4 → expected risk-on environment
U.S. CPI cooling, potential for weaker dollar = BTC bullish
Bitcoin dominance holding near highs
🔐 Risk Metrics (WaverVanir DSS):
Metric Value
Forecast 30D Return +3.4% ($122,072.54)
Confidence Interval $105K – $125K
Model Agreement 2/9 Bullish
Prediction Volatility 14.45%
Sharpe Ratio 1.29
Max Drawdown (forecast) 32.9%
Direction Confidence 72.3%
🎯 Trade Setup (VolanX DSS Model + SMC Confluence):
Parameter Level
Entry $118,000–$117,200
Stop Loss $112,528 (4.7%)
Target 1 $120,443
Target 2 $122,072
Target 3 $127,065 (extended)
Target 4 $133,182–$134,397 (macro projection)
Position Size 25% of capital
Time Horizon 7–30 Days (Scalp + Swing Tiered Model)
📊 Probabilistic Scenarios (Next 30 Days):
Scenario Target Range Probability Notes
🔼 Continuation (DSS Base Case) $122K–$127K 60% Model + SMC aligned
⏸ Accumulation Zone $116K–$119K 25% Rangebound/Equilibrium trap
🔽 Breakdown <$112.5K 15% Triggered by macro shock or liquidity flush
📌 This setup is front-tested using the WaverVanir DSS system, institutional ensemble models, and real-time SMC structure. Not financial advice – for educational and strategic insight purposes only.
#WaverVanir #VolanXProtocol #BTCUSD #BitcoinForecast #CryptoStrategy #SmartMoneyConcepts #FibonacciTargets #AITrading #InstitutionalCrypto #MacroAnalysis #TechnicalSetup #RiskManagement #TradingSignals #QuantitativeModels #Bitcoin

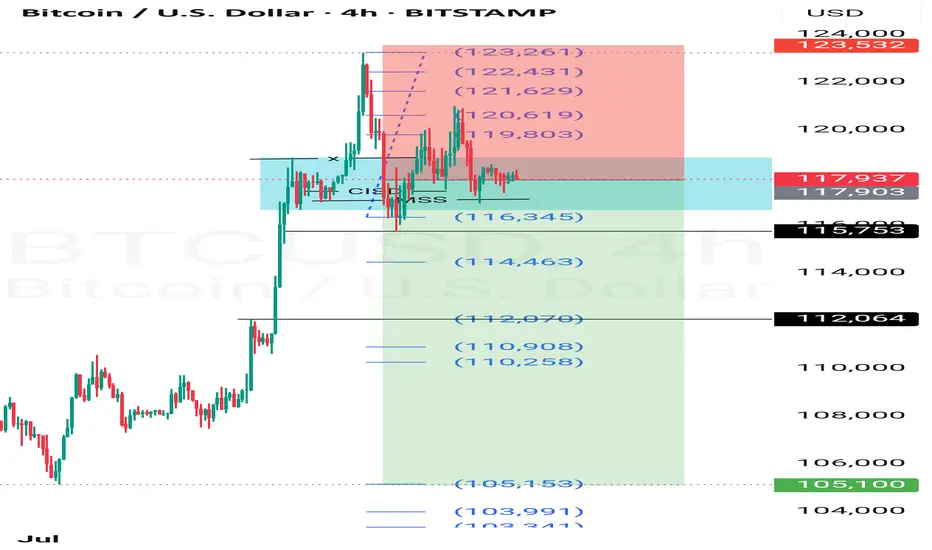
BTCUSD Technical Analysis | Smart Money Concept (SMC) BreakdownBTCUSD Technical Analysis | Smart Money Concept (SMC) Breakdown
🧠 Smart Money Market Structure Insight
📌 Key Elements Identified:
BOS (Break of Structure): Multiple BOS points indicate bullish intent early on. However, the latest BOS on July 14 followed by a significant drop signals a shift in momentum—possibly a distribution phase.
Liquidity Sweep: Price swept prior equal lows/liquidity before reversing, a typical Smart Money trap setup.
FVG (Fair Value Gap) / Imbalance: Identified around the mid-section of the chart—price filled partially but failed to hold, suggesting internal weakness.
Strong Support Zone (Demand Area): Marked between 115,000 - 114,640; this zone is anticipated to act as a springboard for bullish reversal.
📉 Current Price Action Observation:
BTCUSD is hovering around 118,152 - 118,560, moving sideways with lower highs indicating compression.
Price is projected to form a "W" pattern or double bottom in the shaded region.
Expected liquidity grab beneath 115,902 followed by potential bullish reaction targeting 121,562, as indicated by the white arrow.
🧩 Strategic Outlook & Potential Play:
🔻 Bearish Sweep First:
Market likely to sweep the support one more time, tapping into deeper liquidity pools between 115,000–114,640.
This is aligned with the concept of Smart Money hunting for retail stop-losses before reversing.
🔼 Bullish Recovery After Sweep:
Strong probability of bounce due to presence of:
Fair Value Gap (already tested),
Fresh demand zone,
Liquidity grab setup.
Projected Bullish Target: 121,562
Confirmation Needed: A strong bullish engulfing or BOS on lower timeframes near support.
🏷️ Conclusion:
This BTCUSD setup is a textbook Smart Money scenario: BOS ➝ Liquidity Grab ➝ FVG ➝ Reversal from Demand. Traders should wait for confirmation from the support region before entering long positions.

