Bitcoin Monthly - Structure Intact, Tension Rising?⊣
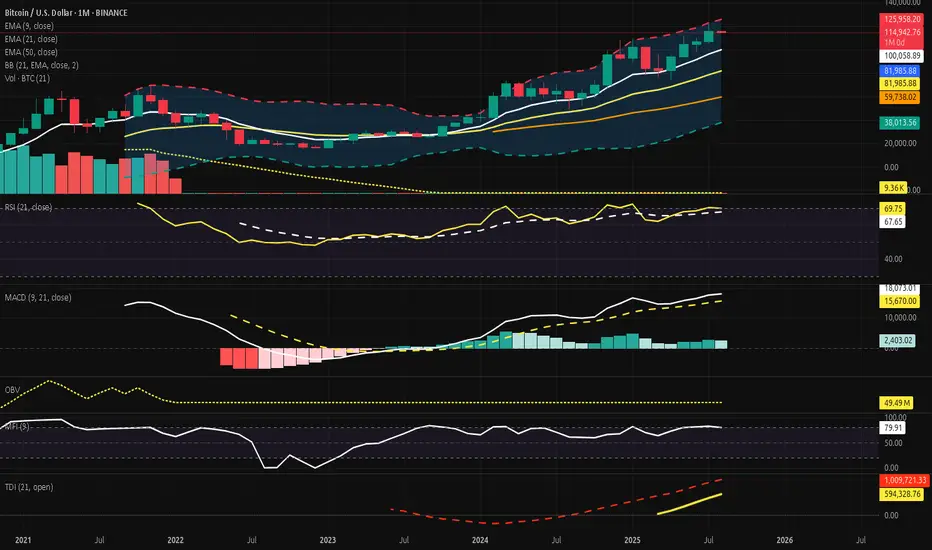
⟁ BTC/USD - BINANCE - (CHART: 1M) - (Aug 01, 2025).
◇ Analysis Price: $114,994.73.
⊣
⨀ I. Temporal Axis - Strategic Interval - (1M):
▦ EMA9 - ($100,069.29):
∴ Price holds 14.93% above this dynamic threshold, indicating momentum continuation but also positioning within an overheated range;
∴ The EMA9 structure is firmly ascending, representing the spine of the short-term bullish wave;
∴ July’s candle remains fully above the EMA without testing it - no wick beneath the line-marking dominance of buyers without internal correction.
✴️ Conclusion: The EMA9 governs the tempo of the current trend and stands untouched. Elevated, but structurally intact.
⊢
▦ EMA21 - ($81,990.60):
∴ A core support vector in the macrostructure, now 28.73% below price, suggesting strong bullish detachment from equilibrium;
∴ The line maintains a smooth, upward slope, echoing the recovery arc since late 2022’s structural low;
∴ Its alignment with the Bollinger Basis and Realized Cap forms a triad of reinforced technical stability.
✴️ Conclusion: EMA21 anchors the mid-term uptrend and guards the sanctum of continuation. No breach, no threat.
⊢
▦ EMA50 - ($47,983.10):
∴ Deep beneath price, resting at 58.27% below the current level - a relic of past cycles, yet still relevant as ancestral support;
∴ The EMA50 has curved upward subtly, signaling the final stage of long-term bear cycle recovery;
∴ Price has not interacted with this zone since late 2023, preserving its status as last-resort structural bedrock.
✴️ Conclusion: EMA50 serves as the sacred foundation of the macro trend - distant, but silently upholding the higher order.
⊢
▦ BB (21, 2) - ($81,990.60, $124,871.91, $39,109.29):
∴ The Basis of the bands aligns precisely with the EMA21, confirming equilibrium at ($81,990.60) - the mid-guardian of the macro cycle;
∴ The Upper Band is currently intersecting the candle body at ($124,871.91), marking an imminent volatility ceiling that may trigger either breakout or rejection;
∴ The Lower Band rests at ($39,109.29), far beneath the trend structure, now serving as a shadow chamber rather than an active field of probability.
✴️ Conclusion: The BB channels have opened widely, signaling expansion. With price nearing the upper rim, the phase is volatile but directional. The core remains intact through the EMA21 basis.
⊢
▦ Volume + EMA21 - (37.62B, 29.71B):
∴ Monthly volume for July reached $37.62 Billion, standing above the EMA21 of volume at $29.71 Billion, indicating an active expansion phase in market participation;
∴ This is the third consecutive monthly close above the EMA21, forming a sequence of rising activity that mirrors the price climb - suggesting healthy conviction behind the movement;
∴ The volume body also aligns with bullish momentum confirmation, as it occurs within an ascending slope of the EMA21, avoiding false divergence or exhaustion patterns.
✴️ Conclusion: Volume expansion supports the current trend. The flow is consistent, not speculative.
⊢
▦ RSI (21, 9) - (69.79, 64.71):
∴ The RSI main line stands at (69.79), nearing the classical overbought threshold but not breaching it, reflecting a strong yet controlled uptrend;
∴ The signal line (9-period smoothing) trails at (64.71), confirming positive pressure without showing divergence - both curves remain aligned and ascending;
∴ There is no crossover, no rejection, and no curvature breakdown - suggesting momentum still leans bullish, but the zone is tightening.
✴️ Conclusion: RSI reveals active strength under equilibrium control. Nearing the gates of exhaustion, but no conflict yet.
⊢
▦ MACD (9, 21, 9) - (4,172.31 / 3,423.95 / +748.36):
∴ The MACD Line remains well above the Signal Line, holding a spread of (+748.36), confirming an active momentum cycle;
∴ Both lines are above the zero axis, reinforcing a long-standing bullish wave with consistent inertia since late 2023;
∴ The Histogram is positive, though it shrinks slightly from previous months, suggesting a potential slowing of force - not a reversal, but a breath.
✴️ Conclusion: The MACD still flows in favor of the bulls. The pulse continues, yet shows first signs of contraction. Momentum remains, but vigilance awakens.
⊢
▦ OBV (21, BB2) - (10.27M / 9.82M / 11.19M / 8.45M):
∴ The OBV line rests at (10.27M), positioned above the Basis (EMA21 at 9.82M), indicating a net accumulation bias over the mid-term;
∴ It remains within the upper half of the Bollinger channel, but beneath the upper band, currently at (11.19M), suggesting accumulation without climax;
∴ The bands are widening, signaling expanding participation and heightened flow volatility - yet without destabilization.
✴️ Conclusion: OBV confirms active, steady inflow. Accumulation sustains the structure. Flow is present, but not yet euphoric.
⊢
▦ MFI (EMA9) - (79.90 / 74.63):
∴ The MFI registers at (79.90), resting near the upper saturation zone, traditionally viewed as overbought - but no rejection candle has occurred;
∴ The 9-period EMA smoothing line at (74.63) trails cleanly beneath, reinforcing directional alignment without divergence;
∴ This spread between the MFI and its smoothing curve affirms a persistent inflow dominance, though now nearing exhaustion thresholds.
✴️ Conclusion: The MFI reveals an environment of strong capital influx. Though high, it is not yet reversal-bound. Compression may precede contraction.
⊢
▦ TDI + EMA21 - (69.79 / 64.71 / / 62.00):
∴ The RSI Line (TDI core) sits at (69.79), nearing the volatility band’s upper arc, denoting strong upward rhythm but with limited expansion room;
∴ The Signal Line at 64.71 lags slightly, confirming the trend with no divergence or curvature weakness;
∴ The Volatility Bands (±10 around Signal) contain price action cleanly - upper band at (74.60), lower at (58.83) - showing moderate but controlled pressure;
∴ The EMA21 overlay at (62.00) forms the base layer, maintaining upward inclination and reinforcing long-term trend security.
✴️ Conclusion: The TDI remains bullish, harmonized, and stable. Momentum leads, volatility permits. No rejection yet, but expansion space is finite.
⊢
🜎 Strategic Insight - Technical Oracle:
𓂀 The monthly structure reveals a state of controlled elevation within a structurally sound uptrend, yet with rising compression near upper bounds. The convergence of indicators outlines a field that is both fortified and tense;
∴ EMA9, EMA21, and EMA50 remain fully aligned and ascending - the Exponential Trinity forms a resilient foundation, untouched by regression;
∴ Bollinger Bands (21) have widened, and price now hovers near the Upper Band, suggesting that the volatility channel is at maximal stretch; further price advance may trigger short-term exhaust or rejection;
∴ Volume + EMA21 confirms that market participation has expanded meaningfully across three consecutive months - a sign of conviction rather than speculation;
∴ RSI (21, 9) and MFI (EMA9) hover in elevated zones, signaling latent overextension, yet without immediate signs of breakdown - still ruled by strength, not fear;
∴ MACD (9, 21, 9) retains bullish momentum, though its histogram begins to contract slightly, marking a potential early shift in impulse rhythm;
∴ OBV confirms accumulation without climax, and the TDI shows synchrony, yet the volatility band ceiling is near - a gateway, or a wall.
✴️ Synthesis Technical: The structure is strong, but stretched, all trend anchors remain intact, and no macro-reversal signal is present. However, the cluster of elevated oscillators and narrowed volatility envelopes warns:
∴ The next impulse will define the phase - either breakout beyond resistance ($125K+) or pullback to base zones near EMA21 (~$82K).
⊢
∫ II. On-Chain Intelligence - (Source: CryptoQuant):
▦ Realized Cap - UTXO Age Bands - ($437.6B):
∴ Capital density remains clustered in the 3m / 12m range, signifying strong mid-term holders anchoring price memory beneath $90K;
∴ The realized cap has risen steadily, confirming new capital commitment and reinforcing the EMA50 region as the “Arcane Bedrock”;
∴ No abrupt aging shift - holders have not fled, nor distributed heavily.
✴️ Conclusion: The realized cost base is lifting upward; Structure is strong beneath price.
⊢
▦ Whale to Exchange Transactions (Binance) - (Rising):
∴ Transfer spikes occurred in mid and late July, echoing pressure near technical ceilings;
∴ Whale flow to exchanges signals potential supply reloads, though no persistent distribution trend is confirmed;
∴ Activity suggests readiness, not execution - threat held in silence.
✴️ Conclusion: Whales signal tension, not aggression; Movement is tactical.
⊢
▦ MVRV Ratio + EMA9 - (2.257 / 2.039):
∴ The MVRV ratio holds above 2.0, implying price trades at over twice the realized cost basis - historically a zone of caution;
∴ No divergence from the EMA9; both slope upward - valuation expansion continues, but no climax;
∴ Price remains above the line of equilibrium, but not in parabolic distortion.
✴️ Conclusion: MVRV confirms overvaluation, but not detachment; Risk is elevated, but contained.
⊢
▦ Exchange Net Position Change (BTC) - (–35,871 BTC):
∴ Net outflows persist, with 35,871 BTC withdrawn in the last monthly cycle;
∴ This behavior aligns with strategic cold storage accumulation, reducing circulating pressure;
∴ On-chain confirms technical's: price rises on supply contraction, not mere speculation.
✴️ Conclusion: Bitcoin leaves the field; Supply retracts as price ascends; Structure reinforced.
⊢
🜎 Strategic Insight - On-Chain Oracle:
𓂀 The on-chain field reveals a fortified structure of conviction beneath the surface of price. Flow, cost basis, and behavior of dominant agents all signal a phase of controlled strength, though shadowed by rising valuation pressure;
∴ The Realized Cap ascends in harmony with price - an uncommon convergence. It suggests that new capital is not merely speculating, but embedding itself into the very structure of the network. The UTXO Age Bands reveal no panic rotation - holders remain;
∴ Whale Transactions to Exchanges rise in key moments, particularly around technical compression points. They do not yet dominate the flow, but stand ready - guardians or destroyers, in silence;
∴ The MVRV Ratio, though elevated, does not deviate violently. It warns, but does not collapse. It reflects a price above cost, but not a mania;
∴ The Net Exchange Position continues its descent. Bitcoin leaves the field; Supply contracts; This is not exit liquidity; This is strategic withdrawal.
✴️ Synthesis Technical: The network breathes in accumulation, not inflation; The participants anchoring this cycle are deliberate; On-chain structures confirm that value is migrating into dormancy, not into exits. The risk is not in structure collapse, but in overvaluation compression - a tightening halo around price.
⊢
⧉ III. Contextvs Macro-Geopoliticvs - Interflux Economicvs - (Jul 31, 2025 - Post-FOMC Strategic Decoding):
▦ FOMC Decision - (July 31, 2025):
∴ The Federal Reserve held its benchmark interest rate steady at (5.50%), marking the fourth consecutive pause - a clear stance of vigilant hold;
∴ The tone was neutral-hawkish, acknowledging progress on inflation while leaving the door open for future hikes if data demands;
∴ No mention of cuts. The Fed maintains narrative control - a message to both markets and sovereigns: we're not done yet.
▦ Jerome Powell’s Address:
∴ Powell reiterated the “data-dependent” framework, but expressed concern over sticky inflation in services and housing;
∴ He praised the resilience of the labor market, signaling no urgency to ease policy;
∴ His delivery was measured, ambiguous by design, injecting uncertainty - fuel for volatility, not clarity.
▦ Market Response - (Traditional Finance):
∴ The DXY (Dollar Index) swung sharply, but closed neutral, reflecting indecision over the Fed’s path;
∴ The S&P500 and Nasdaq attempted intraday rallies but reversed lower - a reaction to Powell not being “dovish enough”;
∴ Gold and Silver caught bids - hedges moved in, not out.
▦ Bitcoin (BTC/USD) Response:
∴ Bitcoin spiked on initial Fed release, tagging the upper Bollinger Band (1M) before retreating slightly - not a rejection, but a breath;
∴ No capital flight occurred. The response was measured and strategic, not speculative;
∴ On H4, Bitcoin touched the EMA200, reinforcing it as a post-FOMC decision point.
✴️ Macro Synthesis: The Fed sheathed the blade but did not lower the shield; Powell’s message: discipline remains. Markets flinched but did not panic; Bitcoin stood firm. This was not a moment of collapse - this was a moment of calibration.
⊢
⌘ Codicillus Silentii - Strategic Note:
𓂀 Let this note be written in the margin of all oracles, beneath the seals and above the motion: This is a cycle governed not by noise, but by intent restrained; The silence between macro movements, the calm in on-chain flows, and the geometry of structure all speak one truth:
The system is waiting;
There is no breakdown;
There is no climax;
There is only a tightening coil - one that neither confirms euphoria nor accepts rejection.
∴ Bitcoin holds above its sacred averages;
∴ The on-chain breath is slow, but pure;
∴ The macro field is firm, yet not soft.
⟁ The next force will not be a whisper - it will be a break or a roar.
✴️ Let no position be based in hope;
✴️ Let no assumption ignore volatility’s patience;
✴️ Let silence guide the strategy, not emotion.
⊢
𓂀 Stoic-Structural Interpretation:
∴ In the mirror of the arcane chart and the silence of on-chain flow, the Stoic lens reveals not merely price action - but the nature of motion itself;
∴ All movement is governed by tension and release, control and surrender. This cycle is no different;
∴ The trend holds, but does not rise arrogantly. It is disciplined;
∴ Capital flows, but not chaotically - it retreats where needed and commits only in strength;
∴ The macro world tempts chaos, but Bitcoin walks with its own gravity - unmoved unless chosen;
∴ Indicators show power without delusion, and pressure without collapse.
This is not a time for euphoria;
This is not a time for panic;
This is a time to observe structure, act with clarity, and remain unshaken.
✴️ The Stoic sees the signal beneath the storm:
Structure is intact;
Trend is valid;
Valuation is tense;
Strategy must remain cold.
⟁ Therefore, the Stoic does not chase candles; He waits for break of structure, or confirmation of continuation; No action is better than misguided motion.
⊢
✦ Structure: Bullish - (Controlled Phase).
∴ All key exponential moving averages - EMA9, EMA21, and EMA50 - remain aligned and ascending, with no curvature breakdown or crossover threat;
∴ Momentum indicators (MACD, RSI, TDI) are positive and synchronized, with no bearish divergence or rejection confirmed;
∴ Price holds above the EMA9 and remains well above the Bollinger Basis, signaling ongoing trend dominance;
∴ Volume exceeds its 21-month moving average, reflecting conviction, not hollow motion.
⟁ However:
∴ The structure is technically stretched - several oscillators approach saturation thresholds, signaling compression, not collapse;
∴ This is a bullish structure, but under strategic tension, not euphoria.
✴️ Final Judgment: Bullish Structure, currently in a compressed expansion state, preparing for either breakout continuation or technical correction - but showing no signs of structural reversal.
⊢
⧉
· Cryptorvm Dominvs · MAGISTER ARCANVM · Vox Primordialis ·
⚜️ ⌬ - Silence precedes the next force. Structure is sacred - ⌬ ⚜️
⧉
⊢
BTCUSD.P trade ideas
BTC is likely to resist falling below $112000BTC is likely to resist falling below $112000
If the confluence between the yellow trendline and the top green horizontal support level dont hold strong, we are likely to see BTC retrace to $100K
Please trade with care.
My thoughts are shown on the chart technically
I hope to connect with you.
Please like, share, comment and follow me.

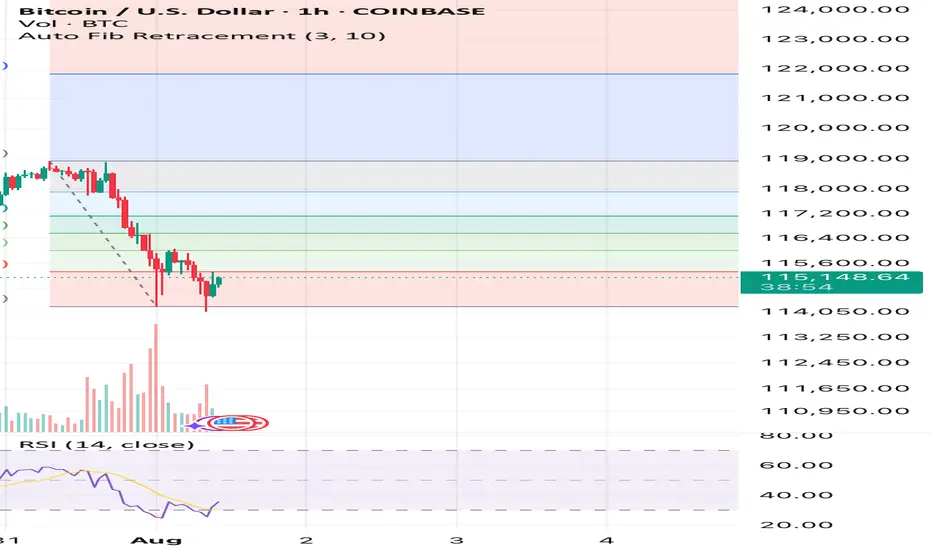
Bitcoin has an upside to it if we hold above $14,900See what you think it’s simple Auto Fib Retracement and RSI. That’s all I’m using here and also past times and other data outside of this image but inside the CRYPTOCAP:BTC market.
What you think? Up to $118k again before down or sideways? Or will this be the end of the large bull flag formation? We’ll soon find out!
Liquidity sweep to $111,000 then bounce to new ATHBTC must see a liquidity sweep down to the previous resistance level of around $111k wiping out the over leveraged longs before a push to new highs. We are seeing this slowly unfolding now where a push down to $114k has just happened. Soon a momentary push down to $111k hitting old resistance levels and the currently 50 day moving average will occur with a quick bounce back to $114-$115k.
THIS IS WHEN WE WILL SEE NEW ATH’s🚀🚀

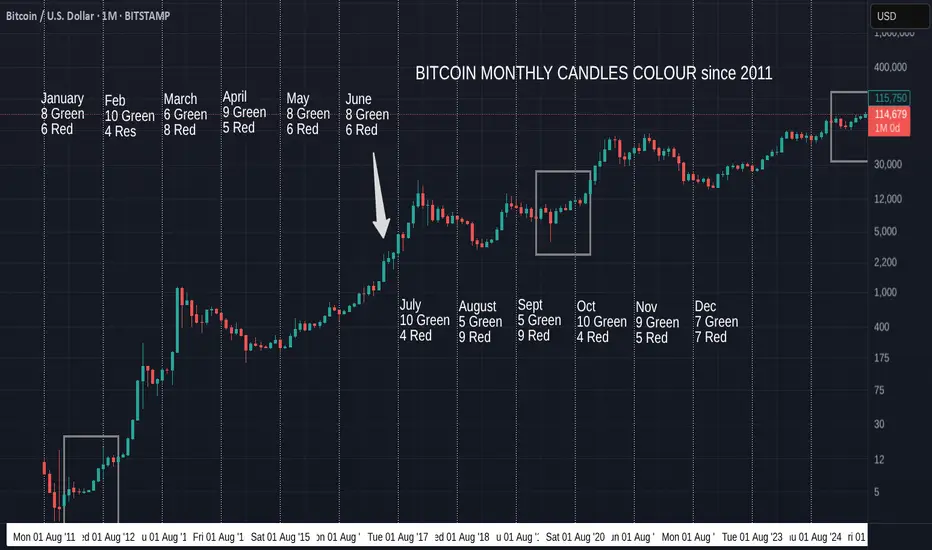
Bitcoin Monthly Candle Colour patterns and Colours since 2011
We got the expected GREEN July and so, amazingly, we continue to repeat the pattern from January to July 2012. ( Left Box )
It is almost the same pattern as 2020, apart from the Red May candle in that Year. (Right box)
The Large Arrow points towards another occasion where we had a series of consecutive Green candles from March to July, though these candles sizes are nothing like the ones we are currently experiencing.
The Boxes show us The only 2 occasions where we have had a Green December, Red January, Red February, Green March, Green April.
Then we had a Green May 2012 and a Red May 2020
Then both repeated a Green June, Green July.
The thing to note here is how all these are en-route to Cycle Highs.
So, August count currently is 5 Green to 9 Red, so the Odds are, while looking at BTC History, that we will get a RED August
HOWEVER, if we continue this run of following previous patterns, we will see a GREEN August.
In fact, 3 of those 5 Green August closes were in these 3 patterns mentioned.
Every single one of the 5 Green previous August followed a Green July, the last time was in 2021.
As mentioned in last months report, the size of the candles currently in this pattern are more like those in 2020 than the other 2 patterns talked about here.
With this in mind, we may expect a smaller Green candle close for August , Followed by a small Red candle in September. This did also happen in 2017 ( Arrow).
This August has opened Red but so far this year, many month opens were red and then changed.
So, My expectation id for a small Green August as markets cool off over the holidays and we wait for the start of Q4 in October.
We will have to wait and see as ever
Stay safe
BTC?
Hi,
How do you stay bullish, when price is moving lower.
Ofcoz,
With knowledge & own research
Securitizing you entries.
Example:
Yest.. price was about to break, failed.
I'm thinking
www.investing.com
What USD is doing (DXY), it's retesting LOW that had broken in May 2025
check yourself pls.
POSITIONING SELF:
I'm willing to take bullish moves.
i) Bearish Trendline broken
ii) Bullish pattern
Might repeat, few times with stops.
Because, pattern only give you higher % probability not CERTAINTY.
And money management IS ONLY thing you could control.
Not a guru
All the best

BTCUSD ShortBTCUSD is now net short on the regression break.
I am hedging out my cold wallet holdings.

Please comment your opinion Greetings and respect to the analysts
This btcusd chart is on bitstamp I know the general analysis of what exists in the market, but please comment your opinion on this chart and the fractal and ascending channel that the price has always respected.

Bitcoin Go 135kBitcoin has not yet reached the channel ceiling and should bounce back after the resistance.
Bitcoin
Tp1:128000
To2:130000
Tp3:133000
Tp4:135000

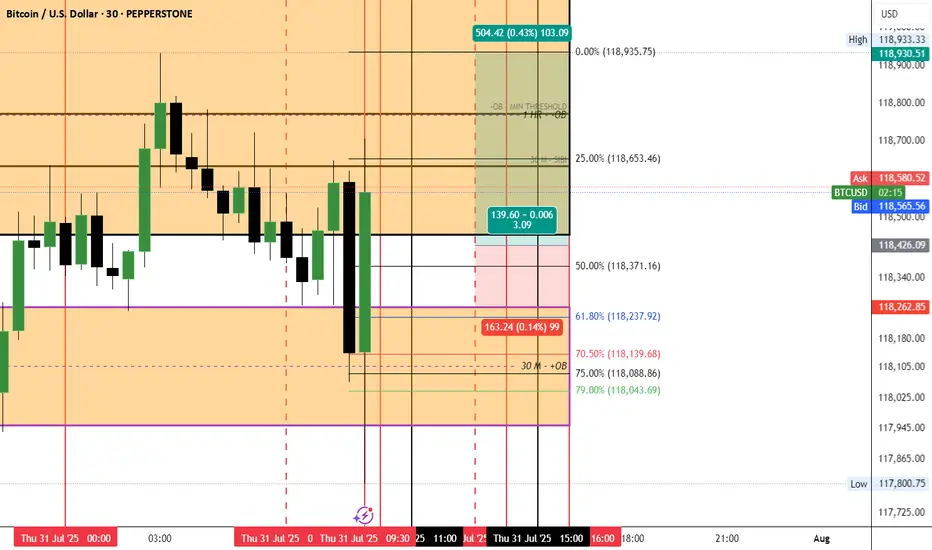
BTC LONG IDEA
My short term analysis of a long BTC Setup
ENTRY @ PRICE = 118,422
SL @ PRICE = 118262
TP @ PRICE = 118930
A rocket is fueling on the launch padNever before has Bitcoin so thoroughly built a launch pad. Retail interest is still low after the 2024 top and corporate/governmental interest is through the roof. This is going to be a massive bubble playing out over the next 3-6 months, possibly even over $300k Bitcoin at the end as the narrative shifts from "BITCOIN IS SPECULATIVE" to "BITCOIN IS A MUST HAVE ASSET" and retail will FOMO in as they always do.
The higher it goes, the more brutal the bear market will be. in late 2026-2027 the narrative will be "CRYPTO IS A SCAM". Corporate treasuries that jumped in late will be dumping bitcoin from their balance sheet and all these leveraged longs will fully unwind. Whales will start to accumulate and the 2029 cycle will be epic.
I'll believe cycles are dead when i see evidence of it. I haven't yet. Play this one right boys! Life changing money is coming.


Bitcoin (BTC) Price Analysis – Short-Term vs. Long-Term Outlook"Bitcoin (BTC) Update:
4H Trend: Bearish below $119,500.
30M: Squeezing—prepare for a breakout!
15M: Double Top warning below $118,250.
Trade Plan:
Buy if BTC holds above $119,500.
Sell if it breaks $118,250.
#Bitcoin #Trading #Crypto"*
BTC USD Long 205,000 TargetI think it will reach the 200,000 range during August/ September 2025.
Update when needed.

BTCUSD INCREASES Bitcoin looking to be targeting new highs and I’m simply following the trend and keeping trading simple
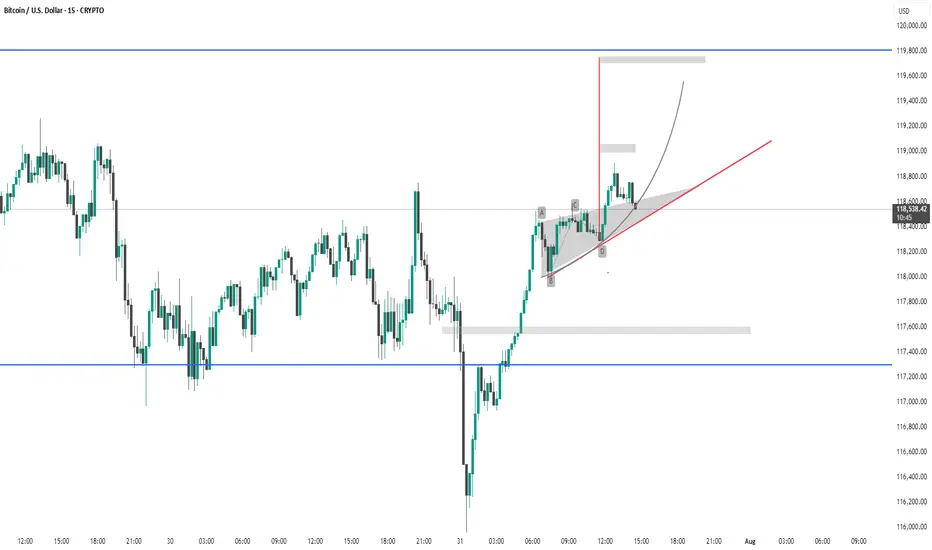
BTC #This 15-minute chart of Bitcoin (BTC/USD) This 15-minute chart of Bitcoin (BTC/USD) shows a strong bullish recovery from the support zone near 117,200 (blue horizontal line). Price has formed a bullish continuation pattern (potential ascending triangle or flag) supported by the red trendline. The gray curved arrow suggests a projected bullish breakout toward the 119,600–119,800 resistance area. The breakout above the shaded demand zone and consolidation near the highs indicates strong buying interest. Watch for a clean breakout above recent highs for continuation.
BTC USDHI GUYS.
update on daily path, weekly path to incoming serious sells.
on the right we see h4 buys to clear upper area. then i expect sells soon with h2,h1 double top price action incoming

Btcusd techinical analysis.Btcusd techinical analysis next move posibale at h1 time frame not finchinal.

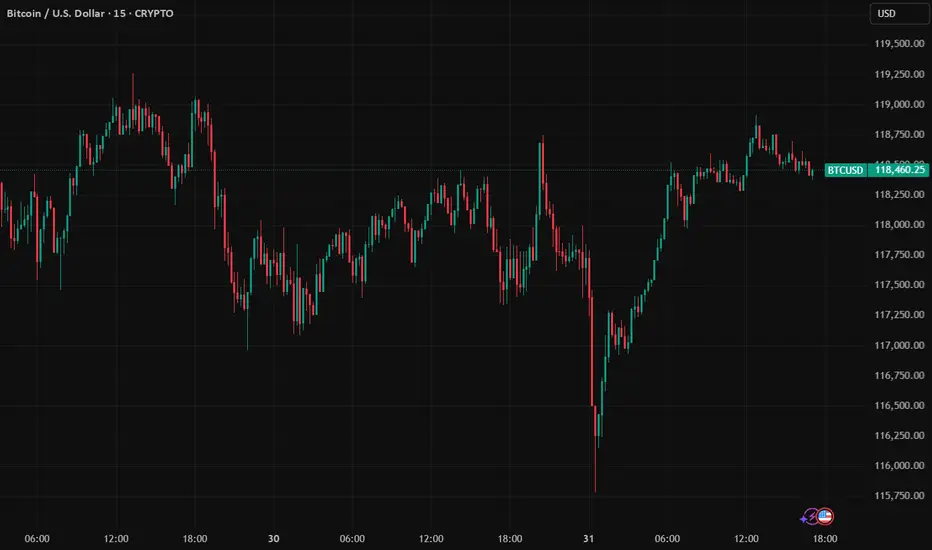
Potential Long Scalp Trade for BTCBitcoinUSD is testing support at $116,400. Depending on this 1HR close, we could have a long trade scalp opportunity for it to reach PoC @ $118,000 to test resistance there. Stop loss would be set below wick @ $115,700. Open Interest for shorts and longs has gone up at this candle. If support holds, shorts will be underwater and liquidation will push prices up.

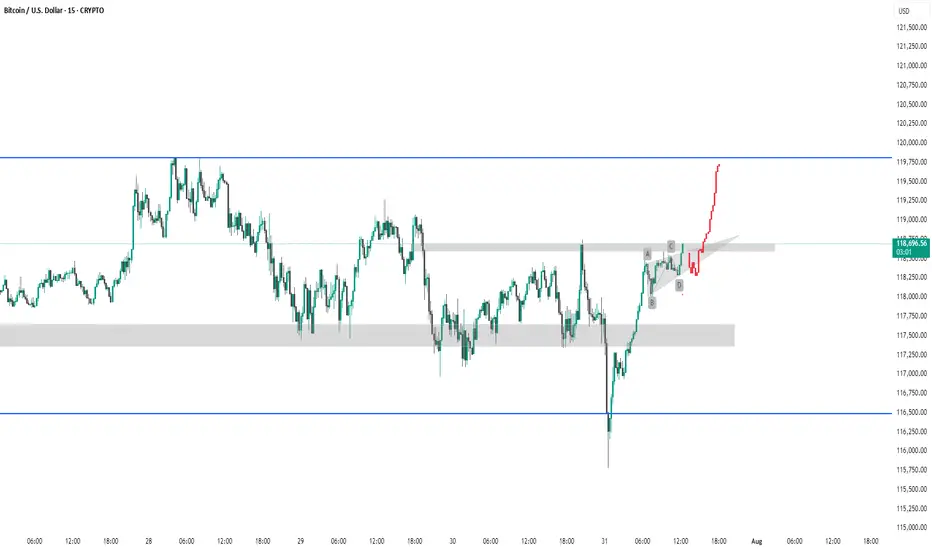
BTC #This is a 15-minute Bitcoin (BTC/USD) chart showingThis is a 15-minute Bitcoin (BTC/USD) chart showing a potential bullish breakout scenario. Price has broken above a key resistance zone (gray shaded area) and is forming a possible bullish continuation pattern (ABCD structure). The red projection indicates a bullish price target towards the 119,750–120,000 USD resistance area (blue line). Confirmation of breakout and sustained momentum above the gray zone would validate the bullish outlook.
thanking you

#BTCUSD 31st July View#BTCUSD Hasn't taken out its recent high, where all the other alt coins particpated in another high. Now it it fails and panic in 3-7 swing we will continue to buy for target of 132000$++ BINANCE:BTCUSD
