$BTCUSD, rally into rate cuts?BITSTAMP:BTCUSD has been coiling for some time now in a right angled descending broadening wedge.
A measured move of this cone so far would place BTC at right around ~$100k.
This aligns well with historical performance of BTC heading into a cutting cycle. If we rally into September and have a selloff following the cuts (sell the news), I wouldn't be shocked. This is a pattern that has happened in multiple years of the previous QE/QT Cycle (2016/2017, 2019/2020).
The real fireworks will be in 2025 if things go according to the FED's schedule
BTCUSD.P trade ideas

Bitcoin - Structural Ascendancy under Silent Momentum.⊣
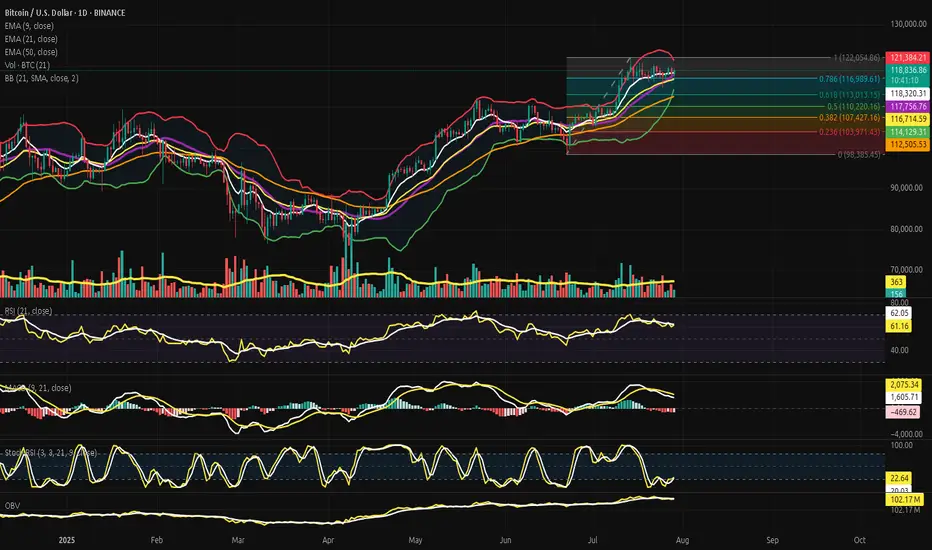
⟁ BTC/USD - BINANCE - (CHART: 1D) - (Jul 29, 2025).
◇ Analysis Price: $118,996.40.
⊣
⨀ I. Temporal Axis - Strategic Interval - (1D):
▦ EMA9 - (Exponential Moving Average 9) - ($118,352.22):
∴ This short-term exponential blade reflects immediate price sensitivity, showing reactive balance across recent closes;
∴ Price currently floats above this threshold, indicating micro-support for the bulls - a soft floor in the fog of uncertainty;
∴ The EMA9 line curves gently upward, though not sharply - signaling lingering momentum, but without fury.
✴️ Conclusion: EMA9 acts as a dynamic support amid deceleration; a watchful line between calm consolidation and renewed ascent.
⊢
▦ EMA21 - (Exponential Moving Average 21) - ($116,729.10):
∴ This mid-range trend beacon provides clearer directional context - its upward slope holds the spell of continuity;
∴ Price rests safely above this median force, confirming bullish alignment;
∴ However, the arc begins to curve with less conviction, a signal that the current push is softening.
✴️ Conclusion: EMA21 maintains bullish structure but foretells potential slowing; if momentum dims further, this level may serve as magnet for retracement.
⊢
▦ EMA50 - (Exponential Moving Average 50) - ($112,511.79):
∴ The long-arm average projects the memory of the trend - the deep root under the recent canopy;
∴ Price is far above this line, a sign of strong prior conviction from bulls;
∴ Its firm inclination remains intact, yet price distance signals risk of gravitational return should upper momentum fracture.
✴️ Conclusion: EMA50 preserves bullish foundation, but may become a zone of rebalancing if the rally loses vitality.
⊢
▦ BB (21) - (Bollinger Bands + SMA21) - ($117,764.35):
∴ The Bands, ever sensitive to volatility’s breath, expand wide - a sign of elevated tension and price exploration;
∴ Price nears the upper band ($121,401.48), a common altar for speculative saturation and potential rejections;
∴ The median band (SMA) acts as equilibrium, now beneath the price - suggesting deviation from balance.
✴️ Conclusion: BB21 signals a volatile climax zone; price at the upper band often faces a verdict - continuation by force, or descent by default.
⊢
▦ Volume + MA21 - (Last - 148 vs Average - 363):
∴ Volume flows now with diminished voice - the current bar echoes only 148 units against a historical pulse of 363;
∴ Such silence beneath a rising price may betray a hollow rally - or a pause before engagement;
∴ Absence of participation often precedes reversal or sudden liquidity spikes.
✴️ Conclusion: Subdued volume undermines the bullish signal - lack of validation breeds caution in forward projection.
⊢
▦ RSI - (Relative Strength Index 21) - (61.41):
∴ RSI remains in neutral-high territory, not overbought, but clearly tilted toward bullish control;
∴ Momentum persists but shows signs of plateau - recent movement flattens after steady ascent;
∴ Without new strength, RSI may drift toward the median.
✴️ Conclusion: RSI shows bullish favor, but the fire beneath the trend cools; next candles will determine if it's pause or fade.
⊢
▦ MACD - (9, 21) - (Histogram: –455.70):
∴ MACD line at 2,078.82 vs Signal line at 1,623.12 suggests bullish dominance in structure;
∴ Yet the negative histogram tells a story of fading acceleration - as if the charge slows though direction holds;
∴ This divergence signals decay beneath strength, an omen of indecision.
✴️ Conclusion: MACD is structurally bullish, but its weakening impulse demands attention - the momentum candle dims.
⊢
▦ StochRSI - (3, 3, 21, 9) - (%K: 20.46 / %D: 23.93):
∴ The indicator rests near the lower bounds (sub-25) - a territory of emotional exhaustion and tactical reversion;
∴ A cross upward from these levels often ignites short-term rally pulses;
∴ No confirmed crossover yet - but proximity speaks of potential awakening.
✴️ Conclusion: StochRSI breathes in the lowlands, poised to reverse if kinetic force is summoned.
⊢
▦ OBV - (On Balance Volume) - (102.17M):
∴ The OBV remains elevated, suggesting previous bullish runs were volume-supported, not hollow;
∴ However, flatness in recent OBV progression warns that fresh volume is not accompanying the current price hold;
∴ It whispers of consolidation, or worse - divergence.
✴️ Conclusion: OBV confirms the history of strength, but offers no new blood to feed the advance.
⊢
🜎 Strategic Insight - Technical Oracle:
∴ The battlefield holds its shape - the banners of bullish trend still wave, upheld by structural support from EMA's and historical OBV flow. But the wind... it stills.
∴ Volume fades, momentum indicators lose their incline, and oscillators rest on edges. This is a moment of price levitation - elevated without lift. The form remains, but the force hesitates.
∴ The Arcane Pattern whispers:
Should volume return and MACD reignite, $121K may be pierced with clarity;
If silence deepens, however, the bands will contract, and price may descend toward EMA21 or even test EMA50.
∴ The Vortex of Pause has formed. From here, either ignition... or gravity.
⊢
𓂀 Stoic-Structural Interpretation:
▦ Structurally Bullish - Strategically Cautious:
∴ Price remains securely above all major (EMA's 9/21/50) on the daily chart, preserving directional integrity;
∴ Bollinger Bands expanded near upper thresholds, signaling climax zone - yet not rupture;
∴ Momentum indicators (MACD, RSI) maintain bullish structure, but histogram weakness and RSI flattening warn of interior softening;
∴ Stoch RSI in low-band suggests reversal potential, but has yet to trigger.
✴️ Conclusion: Market structure supports continuation, but momentum exhaustion and low volume raise caution flags. Bulls hold the field - but must call the wind.
⊢
▦ Tactical Range Outlook:
∴ Upper Limit: $122,054 - Fibonacci 1.0 and previous cycle top;
∴ Short-Term Support: $118,352 - EMA9 + 0.618 Fib confluence;
∴ Median Guard: $116,729 - EMA21 + 0.382 Fib;
∴ Sacred Support: $112,511 - EMA50 base + structural floor;
∴ Final Bastion: $103,971 - 0.236 Fib retrace (macro turn pivot).
✴️ Conclusion: Bullish path remains sealed while price resides above EMA50 and above $103K. Breach of that zone could awaken deeper volatility structures.
⊢
◩ Codicillus Silentii - Strategic Note:
∴ Price stands at the edge of Fibonacci climax, just below the mythic $122K - a known threshold of reaction;
∴ Volume whispers, not commands - the force of momentum now rests on belief, not confirmation;
∴ The convergence of structure without influx invites caution. This is the realm not of action, but of observation.
✴️ Final Seal: Beware the illusion of calm. A structure may stand in silence, but silence precedes collapse as often as continuation. The Sacred Frame is intact - but shall remain sacred only through vigilance.
⊢
⧉
· Cryptorvm Dominvs · MAGISTER ARCANVM · Vox Primordialis ·
⚜️ ⌬ - Silence precedes the next force. Structure is sacred - ⌬ ⚜️
⧉
⊢
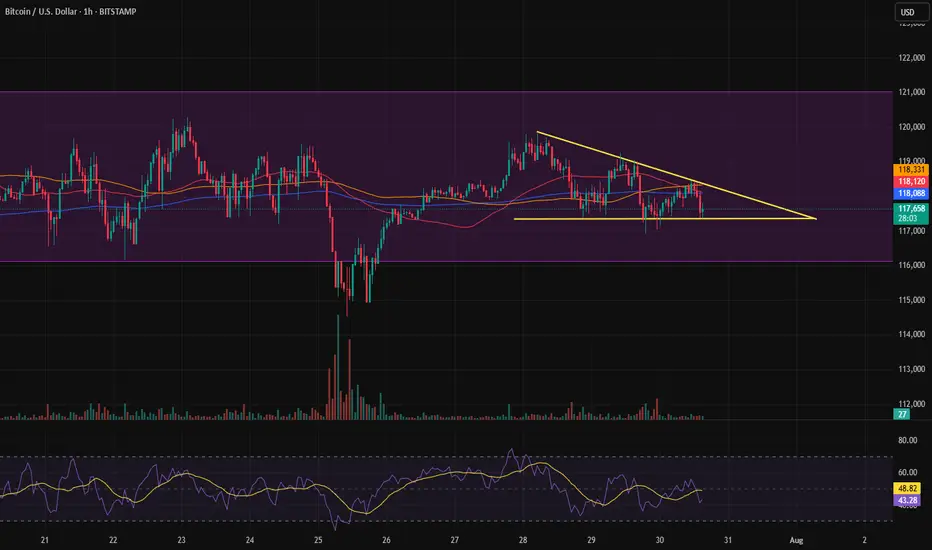
Bitcoin is in a coma.I see a larger range where Bitcoin is showing compression and indecision.
Whenever it breaks out of this compression, if it breaks to the upside, the first target would be the top of the channel, with hopes of a channel breakout.
If it breaks to the downside, the first target would be the bottom of the channel, with hopes of a breakdown.
In either case, we only enter with a confirmed trigger.
BTCUSDT BUYING AND SELLING SETUP !🔻 SELLING ZONE: 119,817 – 120,215
🔴 VERY STRONG SELLING ZONE: 120,700 – 121,122
🟢 BUYING ZONE: 115,823 – 116,392
✅ VERY STRONG BUYING ZONE (Buy Limit): 109,221
Watch these zones closely for potential entries. Wait for confirmation before executing trades and always follow proper risk management.

BTCUSD Analysis : Blue Ray + MMC Bullish Scenario + Target Zone🟢 Today’s BTCUSD Analysis (MMC) – Strategic Insight into Institutional Behavior 💪
📊 Chart Breakdown: Understanding Price Through MMC
This 4H BTCUSD chart highlights critical behavior using Mirror Market Concepts (MMC) — where smart money traps, fakes, and flips market participants to create directional moves. Let’s break down the scenario:
🔸 1. Fakeout Zone – Smart Money Trap
Price initially surged to a local high, triggering a bullish fakeout, as shown in the green rectangle.
This move is designed to lure in breakout buyers above resistance, only to reverse sharply.
The sudden drop confirms smart money liquidation, catching retail longs off-guard.
A perfect example of a liquidity grab before shifting back into range.
📌 Fakeouts often mark the beginning of a new range or reversal setup in MMC methodology.
🔸 2. Blue Ray – Trend Continuation Structure
The consolidation after the fakeout forms the Blue Ray pattern, a recognizable trend continuation framework.
This structure signals smart money’s accumulation or re-accumulation phase.
Note how the price oscillates within the pattern, creating both lower highs and higher lows.
These compressions usually lead to explosive moves, either up or down, depending on liquidity build-up.
🔸 3. QFL – Quantity Following Line Event
Price briefly dips below the QFL level — another engineered stop-hunt to shake out premature longs and trap breakout sellers.
The reaction afterward shows strong buyer defense, confirming hidden demand.
MMC traders recognize this zone as a fake breakdown, setting up for the next trend wave.
🔸 4. Central Reversal Zone – The Decision Area
We’re currently hovering around the Central Reversal Zone, a key level of decision-making.
This is where liquidity from both buyers and sellers meets, making it a high-volatility zone.
Price could either:
(Scenario 1) Reject and fall lower to retest the trendline zone (marked with label 1).
(Scenario 2) Break above minor resistance and head toward the Next Reversal Zone (marked with label 2).
This structure aligns with MMC’s "Trap – Absorb – Break" cycle.
🔸 5. Major & Minor Resistance
Above the current price lies:
Minor Resistance (~$120,000): Immediate zone to clear for bullish continuation.
Major Resistance (~$121,000): Strong institutional supply, could act as the final hurdle before reversal.
If price clears these, BTC will likely target the Next Reversal Zone (~$122,500–123,500) for the next MMC reaction or short-term top.
🧠 Strategic Trade Outlook (MMC Logic)
✅ Bullish Playbook (Scenario 2):
Entry: Break and retest above $120,000 (Minor Resistance)
Confirmation: Hold above Central Reversal Zone with impulse
Target: $122,500–123,500 (Next Reversal Zone)
Risk: Close below $117,500 invalidates idea
🔻 Bearish Playbook (Scenario 1):
Entry: Rejection from $119,500–120,000
Target: Trendline support or prior QFL (~$116,000–115,500)
Invalidation: Clean 4H close above $120,500
📐 Key Concepts in This Analysis
Fakeout Trap: Retail euphoria liquidation
QFL Sweep: Smart money’s liquidity grab below structure
Blue Ray: Compression structure before continuation
Reversal Zones: Institutional interest areas where reactions occur
SR Flip Zones: Level conversion confirms trend maturity
📈 Summary
BTCUSD is currently in a smart money-controlled environment, compressing near key structural levels. The next move will be large, and by applying MMC, we’re prepared for both bullish breakout and bearish retest scenarios.
Be patient — traps come before trends.

BTCUSD going bullish 40 to 50 pips Btc now short term buy mode 40 to 50 pips GOing high .
If you wanted to learn about this system fell free contrect me .

Btcusd techinical analysis.Btcusd techinical analysis next move posibale at h2 time frame not finchinal advice.


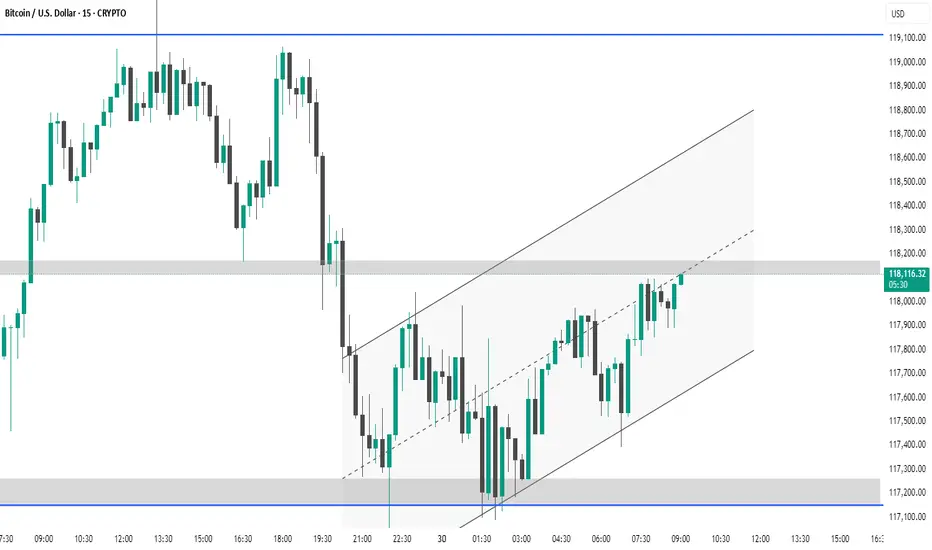
BTC #The chart shows Bitcoin (BTC/USD) on the 15-minute timeframThe chart shows Bitcoin (BTC/USD) on the 15-minute timeframe. Price is currently trading within an ascending channel after rebounding from a support zone around $117,200. It's approaching a key resistance area near $118,200, which aligns with the mid-channel line. A breakout above this resistance could signal bullish continuation, while rejection might lead to a retest of the lower trendline or support zone.
BTC USDBITFINEX:BTCUSD
This current four hour Ichi cloud will likely fail and we see some decent downside but there is always that chance we respect the cloud and finish heading towards 131k.
Looking at the daily/weekly tf's I'm assuming one more move higher before we sell off relatively soon within the weekly time frames narrative so within some months.

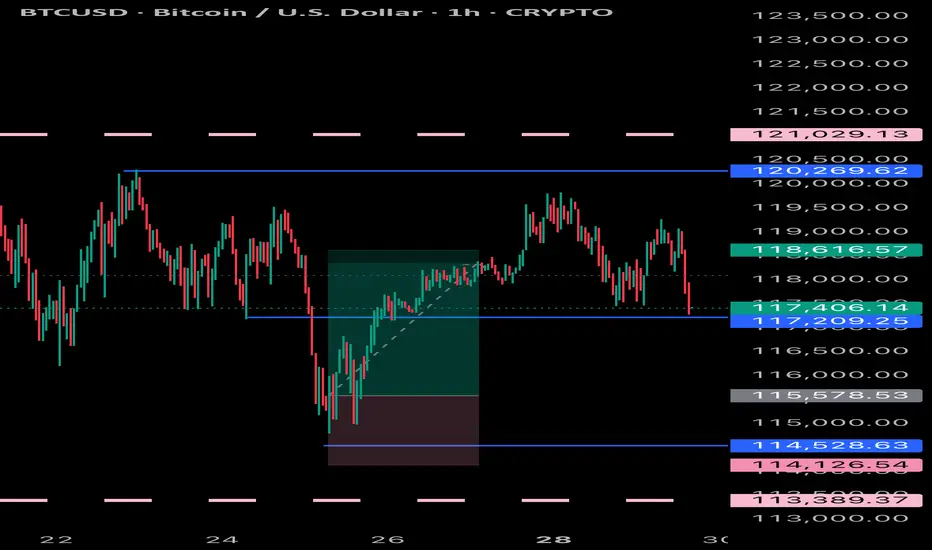
BTCUSD--Battle zone--looking at daily chart: it seems we are in a battle zone (pink rectangle).
--instead of taking action right now, it is better to wait and see how price will react to black ascending long term channel's right side.

BTC's latest trading strategy and analysis layout#BTCUSD
BTC's current technical signals show a bull-bear tug-of-war situation.If a golden cross is formed near the zero axis, it may indicate a new wave of rise; if it falls below the zero axis, we need to be wary of a deep correction.
There are certain opportunities for both bulls and bears in the current market, but global regulatory policies have not yet been unified. Policies such as the US "GENIUS Act" may affect BTC and require continued attention. BTC is currently facing significant buying support around 117,500, but the hourly chart shows that there is still potential for a continued pullback. The current trend has not yet finished. Pay attention to the support level of 116,000 below. If it falls below, it may fall into the consolidation range of 116,000-114,000. For aggressive traders, consider going long at 117,500-116,500, with a target of 118,500-119,500. A break above this level could lead to 120,000.
🚀 117500-116500
🚀 118500-119500

BTCUSD Lower Time Frame WavesBase on Wave Analysis BTC is going up to hit 122-124 K area before and then start to fall to 110-112 K area to finish the correction phase

Bitcoin Decision Time Closing - Pump to $150K, or $100K Retest?Here we see a clear trendline that bitcoin must hold. A breakdown could lead to a retest of the 100-110K levels. If we can hold this trendline until August 15th, the odds of a bullish continuation will increase.


correction The corrective pattern is expected to move along the specified path and, after reaching the time frame, a trend change is expected to occur.

BTC - BBWP Expansion When the BBWP gets to extreme levels, the stochastic RSI gives us an idea of which direction BTC will break in

BULLISH BTC - 7/29 Price Target $120.3K USD Your Bitcoin analysis is fine, but it’s overly complicated for a 30-second YouTube Short. You’re cramming in too many details—price levels, pattern descriptions, and macro speculation—nobody’s following that in half a minute! Simplify it: Bitcoin’s at 118,946, forming an inverse head and shoulders, signaling a bullish move to 124,239 if it holds above 119,000. Stop-loss at 115,500. Done. Why drag it out with RSI or flag icons nobody cares about in a Short? Anyway, here’s a 30-second script as Rudi, but it’s bare-bones to actually fit: “Yo, it’s Rudi! Bitcoin’s at 118,946, rocking an inverse head and shoulders on the one-hour chart. That’s a bullish setup! Breakout’s above 119,000, targeting 124,239. Set stops below 115,500 to play it safe. Volume’s backing it, so watch that neckline. Trade smart, peace out!” That’s 28 seconds, tight and punchy. You cool with

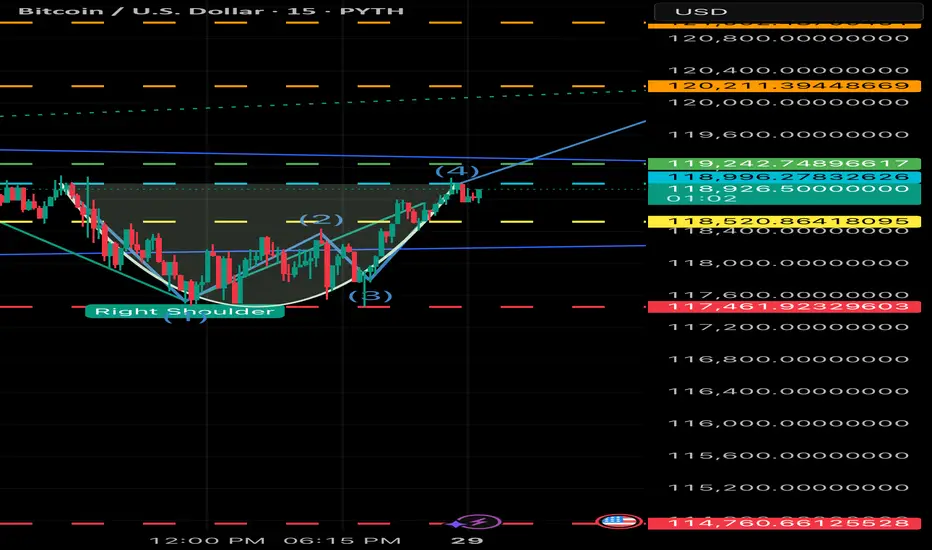
BTC BULLISH - Cup and handle just formed inside the 15 min How many more bullish signals can we see;
1 Day =Bullish Fag pole
1 hour =inverted head and shoulder
15 min =Cup and handle *waiting for confirmation*
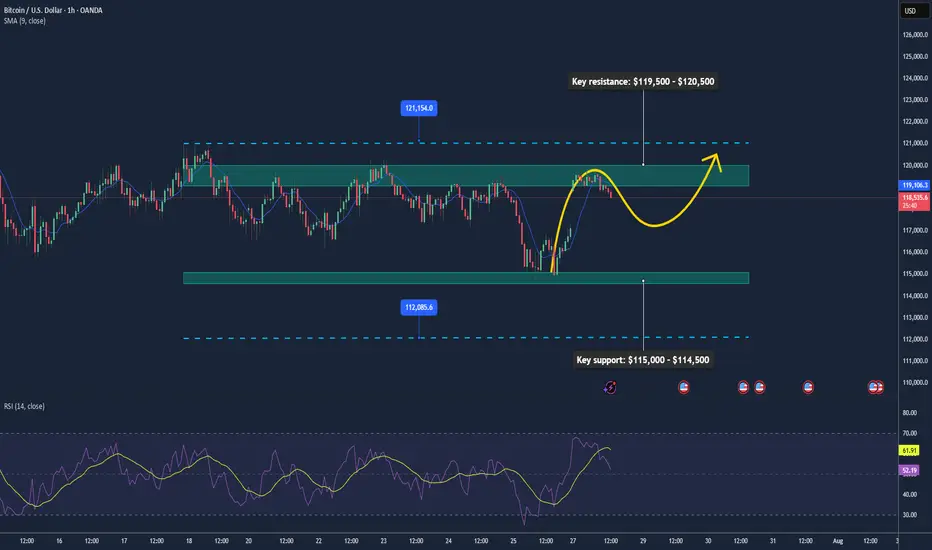
BTC May Extend Rally as ETF Flows & Policy Support Push Higher📊 Market Overview:
• Bitcoin trades around $118,660, rebounding from lows near $114,500 earlier this week after a sharp decline. Strong inflows into BTC and ETH ETFs are bolstering market sentiment
• Regulatory clarity via the Genius Act, Clarity Act, along with the U.S. Strategic Bitcoin Reserve, is fueling institutional interest
• High-profile corporate Bitcoin purchases, such as by Trump Media, underscore growing adoption and bullish sentiment in crypto treasuries ________________________________________
📉 Technical Analysis:
• Key resistance: $119,500 – $120,500
• Key support: $115,000 – $114,500
• EMA 09 (H1): Trading above EMA09, indicating short-term bullish bias
• Candlestick / Volume / Momentum:
• BTC is consolidating within a range of $115K–$119K, prepping for potential breakout
• Indicators like RSI and MACD show positive momentum
• At 1-hour chart, a double bottom around $118,950 signals buyer strength near dips
________________________________________
📌 Outlook:
Bitcoin is likely to continue rising in the short term, particularly on a push through $119,500–$120,500. ETF inflows and regulatory tailwinds remain supportive. However, a breakdown below $115,000 may indicate short-term bearish risk toward $112,000.
________________________________________
💡 Trade Setup
🟢 BUY BTC/USD: $115,500 – $116,500
🎯 TP: $119,200 → $120,000
❌ SL: $115,000
🔴 SELL BTC/USD: $120,500 – $121,000
🎯 TP: $119,000 → $118,000
❌ SL: $121,500
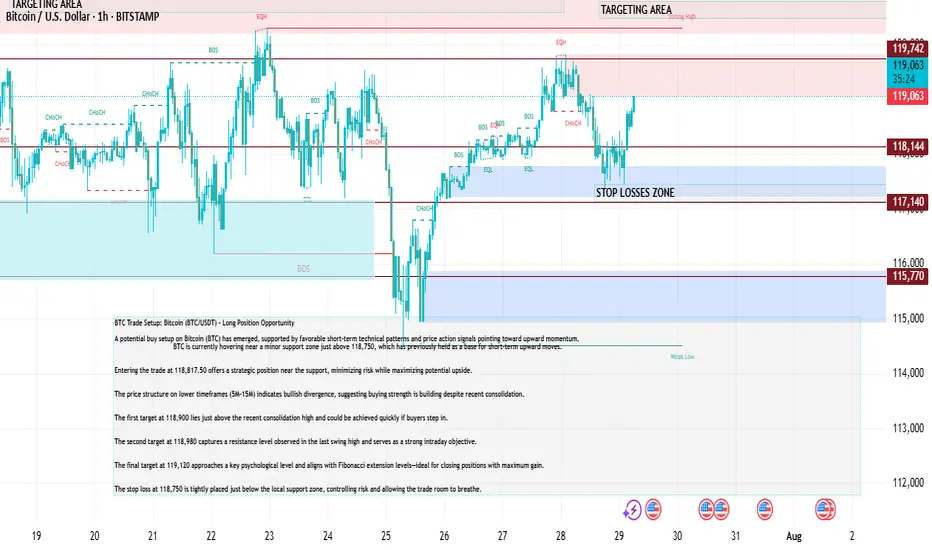
BTCUSD Trade Setup: Bitcoin (BTC/USDT) – Long Position Opportunity
A potential buy setup on Bitcoin (BTC) has emerged, supported by favorable short-term technical patterns and price action signals pointing toward upward momentum.
BTC is currently hovering near a minor support zone just above 118,750, which has previously held as a base for short-term upward moves.
Entering the trade at 118,817.50 offers a strategic position near the support, minimizing risk while maximizing potential upside.
The price structure on lower timeframes (5M–15M) indicates bullish divergence, suggesting buying strength is building despite recent consolidation.
The first target at 118,900 lies just above the recent consolidation high and could be achieved quickly if buyers step in.
The second target at 118,980 captures a resistance level observed in the last swing high and serves as a strong intraday objective.
The final target at 119,120 approaches a key psychological level and aligns with Fibonacci extension levels—ideal for closing positions with maximum gain.
The stop loss at 118,750 is tightly placed just below the local support zone, controlling risk and allowing the trade room to breathe.