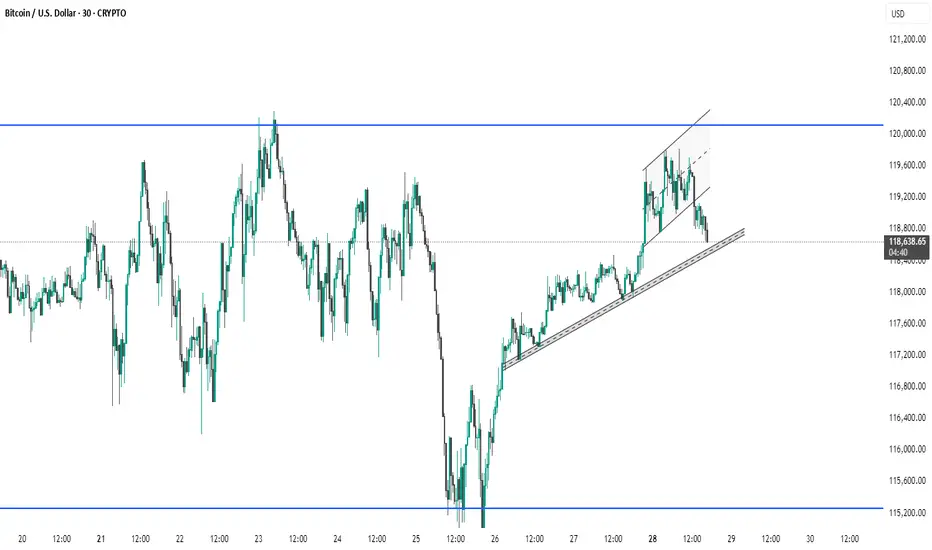
BULLISH - BTC Breakout Imminent The breakout confirmation in the context of the inverse head and shoulders pattern depicted in the provided chart refers to the validation of a bullish reversal signal, indicating a potential shift from a downtrend to an uptrend. This confirmation is typically established through specific technical criteria, which I will outline below in a structured manner. Given the updated current price of 118,580, I will also assess its implications based on the chart’s features.
Key Elements of Breakout Confirmation
1. Break Above the Neckline: The neckline, represented by the dotted teal line in the chart, serves as the primary resistance level. It connects the highs following the left shoulder and head formations, sloping slightly downward. From the visual analysis, the neckline appears to range approximately from 119,000–120,000 on the left to 117,000–118,000 near the right shoulder. A decisive breakout occurs when the price closes above this line, invalidating the prior downtrend. In the chart, the price has already surpassed this threshold, reaching 118,318.57 at the time stamp of 23:23.
2. Volume Support: Confirmation is strengthened by an increase in trading volume during the breakout candle or session. This suggests conviction among buyers and reduces the likelihood of a false breakout. The provided chart does not display volume data, so external verification (e.g., via exchange metrics) would be necessary for full assessment. Absent this, price action alone provides preliminary evidence.
3. Price Closure and Sustained Momentum: A single intraday breach may not suffice; confirmation often requires a session close (e.g., daily or hourly, depending on the timeframe) above the neckline, ideally with follow-through in subsequent periods. Additional supportive factors include:
• No immediate retest or pullback below the neckline, which could signal a trap.
• Alignment with momentum indicators, such as the Relative Strength Index (RSI) moving above 50 or a bullish moving average crossover (not visible in the chart).
4. Pattern Target Projection: Upon confirmation, the upside target is calculated by measuring the vertical distance from the head’s low (approximately 114,000) to the neckline at the breakout point (around 118,000), yielding a height of about 4,000 units. Adding this to the breakout level suggests potential targets near 122,000 or higher, though market conditions may alter outcomes.
Assessment at Current Price of 118,580
At 118,580, the price remains above the estimated neckline breakout point (approximately 118,000 at the right shoulder), extending the upward trajectory shown in the chart. This positioning supports preliminary confirmation of the breakout, as it demonstrates sustained momentum beyond the resistance. However, for robust validation:
• Monitor for a close above this level on the relevant timeframe.
• Watch for any retracement; a successful retest of the neckline as support would further solidify the pattern.
• Consider broader market factors, such as macroeconomic influences or sentiment in the asset class (likely cryptocurrency, given the price scale), which could impact durability.
If additional data, such as volume or updated charts, is available, it would refine this analysis. Should you require further details or evaluation of related indicators, please provide specifics.
BTCUSD.P trade ideas

BTCUSD Turning Bearish – Eye on 115,200 Target- The price is approaching a supply zone near 119,450 – 120,000, where previous selling pressure
existed.
- Structure shows a potential lower high formation, signaling bearish momentum could continue.
- Risk-to-reward ratio looks favorable if entry triggers at 119,450 and target is 115,200.
- Confirmation with bearish candle rejection at the supply zone is recommended before
entering.
This is a sell setup aiming for a 420–450 pips move. Wait for price action confirmation near 119,450. If rejected, short positions may target 115,200.

BULLISH - Where do you think it’s going to go?How can you not be bullish with this? Breakout to $130k

BTCUSD H1 Outlook Market gave you BOS after BOS — but ChoCh changed the game.
Entry: 118,349
Stop Loss: 119,495
Target: 115,349
RR: 🔥 1:3+ setup
Smart money doesn’t guess — it reacts.
This is how liquidity pays the patient.

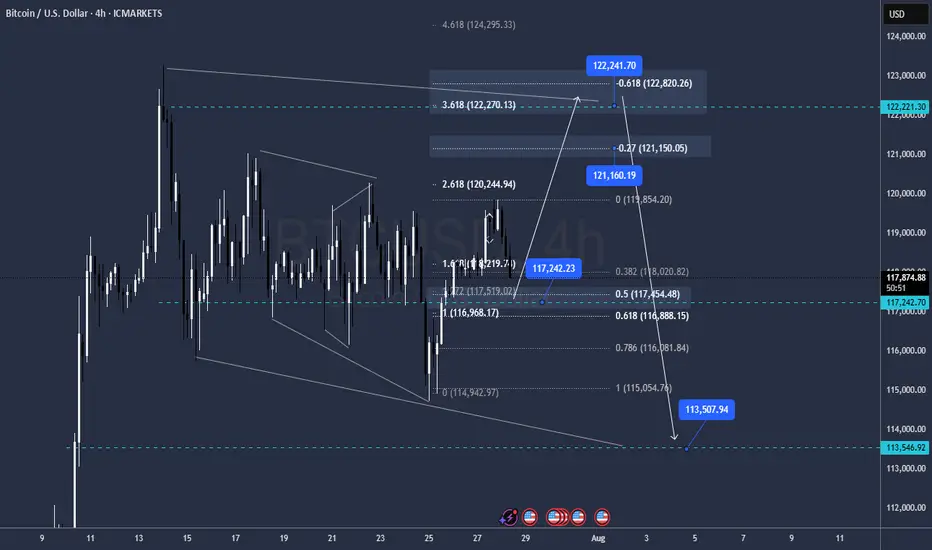
BTC- Following the TrendLine since YEARS, ExactlyYear on Year , each cycle BTC is adhering to this trend line, and also hit the 2 FIB EXACTLY for now - rejected there. It must cross this to test higher levels, but that may need a few weeks more of sideways moves. Keep a watch cause another rejection at this trend line will probably indicate we are not going higher.

BTCUSD 7/28/2025Just so you can see what I see... We read Candles over here!
_SnipeGoat_
_TheeCandleReadingGURU_
#PriceAction #MarketStructure #TechnicalAnalysis #Bearish #Bullish #Bitcoin #Crypto #BTCUSD #Forex #NakedChartReader #ZEROindicators #PreciseLevels #ProperTiming #PerfectDirection #ScalpingTrader #IntradayTrader #DayTrader #SwingTrader #PositionalTrader #HighLevelTrader #MambaMentality #GodMode #UltraInstinct #TheeBibleStrategy


BTC new meassuresokay impulse is pretty much clear
buy level 117.250 Targtting 121.100 / 122.200 / 122.800
Sell level 122.200 targetting 113.500
Re buy level 113.500 targetting 127.500 / 133.000
GG
BTC Short Scalp TradeBitcoin has reach the top of downtrend channel which seems to be holding as significant resistance @ $119,600. The Volume Area High is also located at this level. This gives opportunity for a short scalp trade with TP at $118,200 where a NPoC and PoC of Volume Profile is located. Stop Loss is 0.67% above entry with $7.4M of Sell Book order volume.
NPoC

Bitcoin Go 133000Bitcoin prepares to attack the ceiling of the 133,000 range channel after some suffering
Bitcoin tp1:126000
Tp2:128000
Tp3:133000

Bitcoin's next target is $133,000Bitcoin prepares to attack the ceiling of the 133,000 range channel after some suffering
Bitcoin tp1:126000
Tp2:128000
Tp3:133000

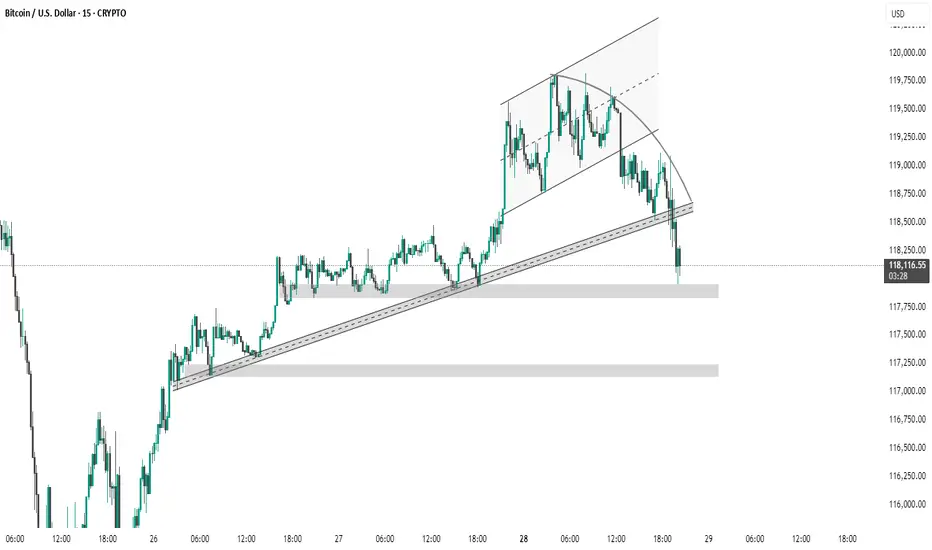
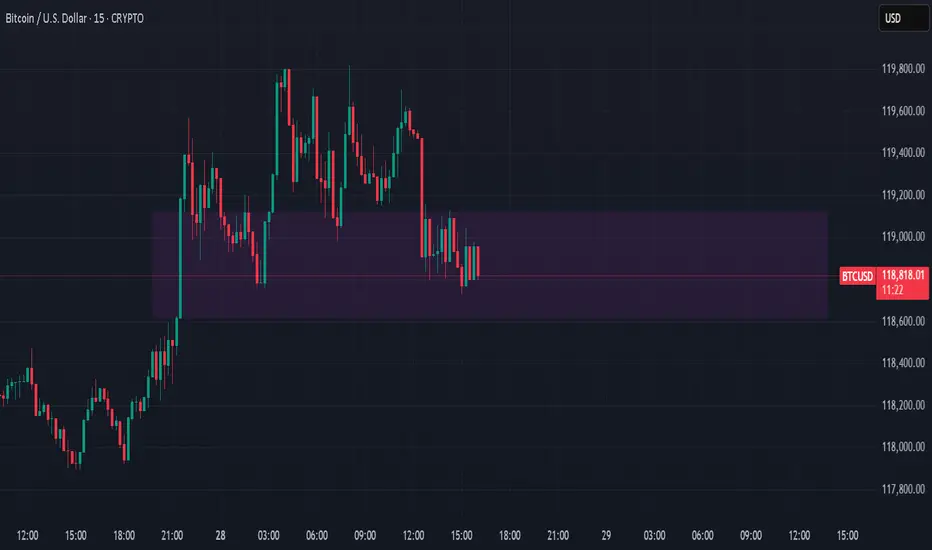
BTC #15-minute BTC/USD chart This 15-minute BTC/USD chart shows a clear breakdown from a rising channel, followed by a retest and rejection at the former support trendline. The price has now broken below key trendline support and is testing a demand zone near 118,000 USD. If this level fails to hold, the next support lies around the 117,250–117,000 USD zone. This indicates a potential shift in market structure from bullish to bearish in the short term.
BtcUsd targetting 40 to 50 pips next level will be 119000📊 Market Analysis:
Bitcoin (BTCUSD) is currently showing a minor bullish momentum, and based on the current price structure, we are expecting a 40–50 pip move to the upside, targeting the $119,000 level as the next key resistance.
📈 Technical Highlights:
Price is pushing upward with steady momentum.
Forming higher lows, signaling buyer control.
RSI staying above the midline – bullish strength confirmed.
Price aiming to break minor resistance to head toward $119,000 zone.
🎯 Next Target:
Immediate Move: +40 to +50 pips.
Major Resistance Level: $119,000 – watch for potential breakout or reversal there.
📉 Risk Management:
Invalidation below recent low or support zone.
Set tight stop-loss for intraday trades.
🕒 Timeframe: Short-term intraday move – Scalping or quick swing.
#BTC #Bitcoin #Crypto #BTCUSD #Scalping #ShortTermTrade #TradingView

Btcusd Going down 40 to 50 pips BTCUSD Going down cuple of hours and you can take profit 40 to 50 pips

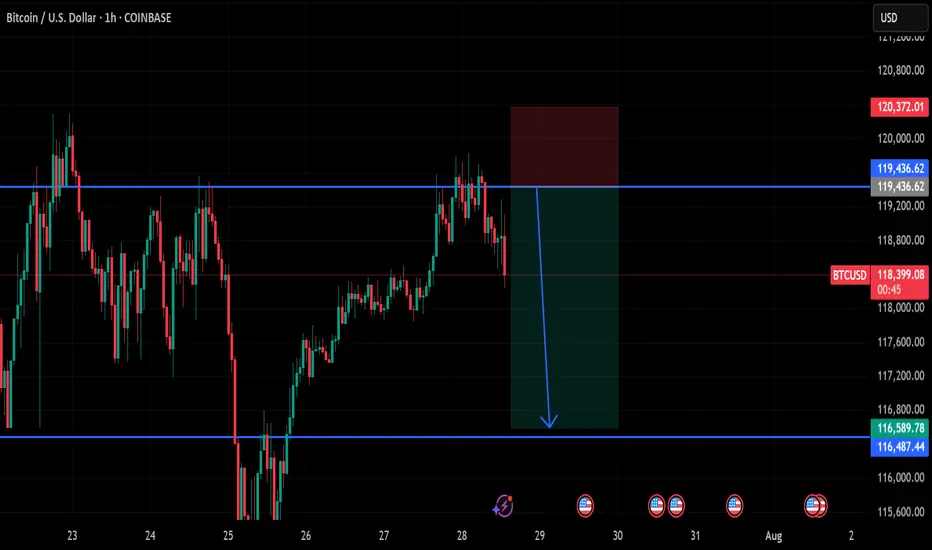
btc on selling#BTCUSD on multiple price rejection at 119k,now we await final touch before a fall below 116487-110k.
Sell at 119436, target 116487-110k, stop loss 120372.
Bullish range isn't strong
BTC #Bitcoin (BTC/USD) on a 30-minute timeframe. The chart shows Bitcoin (BTC/USD) on a 30-minute timeframe. Price recently broke down from a rising channel and is currently testing a key ascending trendline for support around $118,600. A break below this trendline could signal further downside, while a bounce may lead to another test of the $120,000 resistance level. Traders should watch closely for a confirmed move below or a reversal signal at this support zone.
Bitcoin Cycles Signal Major Move — BIT500 on What Comes NextBitcoin’s historical price action is known for its cyclical behavior — driven not only by supply dynamics like halving events, but also by global macroeconomic forces. This week, leading crypto macro analyst TechDev released a widely discussed model projecting that Bitcoin may be entering a new explosive phase, closely linked to a shift in monetary policy, global liquidity cycles, and risk asset rotation.
At BIT500, we see this as more than a theory — it’s a playbook. Understanding macro-driven crypto cycles gives institutional and high-net-worth investors a clear advantage. And, when used properly, it can become the foundation for consistent alpha generation in the digital asset space.
TechDev’s Model: Liquidity as the True Driver
According to TechDev, Bitcoin’s major uptrends are synchronized with global liquidity expansions. In particular, the model links Bitcoin price surges with:
Falling real interest rates,
Expanding global M2 money supply,
Weakening U.S. dollar (DXY decline).
This pattern played out in 2016–2017 and again in 2020–2021. As global central banks prepare to shift toward more accommodative policies — especially amid slowing GDP growth and rising debt burdens — similar conditions may be taking shape for late 2025 and into 2026.
BIT500 analysts agree: the macro landscape is increasingly favorable for risk-on positioning, especially in hard assets like Bitcoin.
On-Chain Indicators Confirm the Thesis
Supporting the macro thesis is a growing set of on-chain signals. Our internal models — as well as public indicators like Dormancy Flow, MVRV ratio, and Realized Cap metrics — show long-term holders are accumulating, while short-term holder activity has flattened.
The decline in exchange reserves, increased self-custody trends, and decreased miner selling pressure all align with prior pre-bull market phases. This combination of tightening supply and macro liquidity can act as fuel for the next leg up — one that could catch passive investors off-guard.
How BIT500 Capitalizes on Bitcoin Cycles
At BIT500, we convert insights into execution. Our team applies cycle-based, quantitative strategies to capture asymmetric upside while managing downside risk.
Here’s how we turn macro analysis into market performance:
Phased Capital Deployment
We deploy capital in staggered allocations, entering during compression phases and scaling in as trend confirmation emerges — minimizing exposure during volatility and maximizing return during expansions.
Volatility Harvesting
We implement delta-neutral and volatility-arbitrage strategies across Bitcoin derivatives markets, generating income in all phases of the cycle — especially when price is range-bound.
Multi-Asset Rotation Models
Based on cyclical rotation, we dynamically adjust exposure between Bitcoin, Ethereum, and select altcoins. These models are tested to outperform static portfolios across halving-based and macro cycles.
Custom Risk Monitoring Systems
BIT500 clients benefit from our proprietary Cycle Risk Dashboard, which sends alerts when market structure shifts — enabling proactive rebalancing rather than reactive trading.
Conclusion
Bitcoin’s next major price movement is likely to be shaped not just by crypto-native factors, but by broader shifts in global liquidity, interest rates, and investor sentiment. TechDev’s research confirms what BIT500 has long modeled — that understanding economic cycles is key to anticipating large-scale Bitcoin breakouts.
For investors seeking not just exposure but performance, the coming months represent a rare window of opportunity. At BIT500, we don’t just track cycles — we build strategies to monetize them with discipline and precision.
Bitcoin ConsolidatesBitcoin continues to chop sideways, consolidating below the all time high. Demand is high, RSI is dropping as price goes sideways. This will break out again eventually and all eyes will be back on the honey badger.

Watch this FVG for retracement zone for price action trenWatch this FVG for retracement zone for price action trend
Bitcoin, Politics, and Security: This Week in CryptoThis week brought a series of headline-making moves in the crypto space, reflecting the growing maturity and complexity of the digital asset landscape. From massive Bitcoin buys to cybersecurity initiatives and political implications, here's what stood out — and why it matters.
Strategy Buys $740M in Bitcoin
Institutional players continue to accumulate Bitcoin — but the scale and structure of Strategy’s recent purchase caught the attention of analysts. According to filings with the SEC, the firm added 11,000 BTC, bringing total holdings to 186,000 BTC — worth over $11 billion.
What’s notable is that Strategy appears to be financing these purchases using bond issuance, effectively applying low-interest leverage to increase crypto exposure. This marks a shift in how corporations are approaching Bitcoin — as both a reserve asset and a financial instrument.
Trump Media Discloses $2B in Digital Assets
In a surprising disclosure, Trump Media & Technology Group, the parent of Truth Social, revealed it holds $2 billion in digital assets — including USDC, Ethereum, and small allocations to Solana and Chainlink.
The move has sparked debate within both financial and political circles, given Donald Trump’s renewed activity as a U.S. presidential candidate. Such a significant crypto treasury tied to a politically active entity raises concerns about market influence and regulatory scrutiny.
CoinDCX Launches $1M Bug Bounty Program
Indian crypto exchange CoinDCX announced a $1 million bug bounty program, inviting white-hat hackers and security researchers worldwide to find vulnerabilities in its platform. This marks a shift toward proactive cybersecurity in the crypto exchange industry.
The company also plans to launch an open-source vulnerability-sharing platform to facilitate threat intelligence across exchanges — a move that could standardize Web3 security practices.
Bottom Line
This week underscored the increasingly strategic posture of major crypto market players. From treasury management and structured crypto financing to cybersecurity and institutional-grade governance, the digital asset sector is evolving rapidly.
For savvy investors and ecosystem participants, this complexity brings more opportunity than ever before — but also demands sharper focus, real-time analytics, and risk-aware strategies.
If you need these articles tailored for a newsletter, blog, or investor deck — just let me know!

Bitcoin Stalls Ahead of Fed and ETF DataAt the time of writing, Bitcoin is trading in a narrow band between $66,000 and $67,800 — showing price stability but lacking directional momentum. This consolidation phase comes ahead of several major catalysts: the upcoming Federal Reserve interest rate decision, quarterly earnings from top tech firms, and updates on inflows and outflows from U.S.-based spot Bitcoin ETFs.
Macroeconomic Pressure: All Eyes on the Fed
The U.S. Federal Reserve will meet on July 31 to discuss interest rates. While most analysts expect the central bank to hold rates steady, markets are focused on the Fed’s tone. Any suggestion of easing or a future rate cut — possibly in Q4 — could trigger renewed appetite for risk assets, including crypto.
Tech Earnings: Nasdaq Sentiment Spillover
Major tech firms including Apple, Amazon, and Google are scheduled to report earnings this week. These reports are closely tied to broader market sentiment, especially for the NASDAQ and S&P 500 — both of which show increasing correlation with crypto. Positive earnings could strengthen risk-on sentiment and give Bitcoin a short-term boost.
ETF Flows: A Silent Market Driver
Since the beginning of the year, spot Bitcoin ETFs have shown mixed behavior — strong inflows in Q1, followed by periods of cooling and outflows. Investors are now awaiting updated flow data from major asset managers like BlackRock and Fidelity to assess whether institutional interest in Bitcoin remains intact.
A return to consistent inflows could serve as a catalyst to push BTC out of its current range. Conversely, continued stagnation or net outflows may trigger a breakdown below $65,000 — a key support level.
Technical View: Calm Before the Storm
According to BBDelta, $66,500 is acting as a short-term equilibrium point between buyers and sellers. Open interest in Bitcoin futures remains elevated, indicating that traders are bracing for significant movement once market catalysts emerge.
Conclusion
Bitcoin is currently in a state of “wait and see,” and the next several days could be pivotal. The convergence of macroeconomic updates, tech-sector earnings, and ETF flow reports is likely to set the tone for crypto markets through August.
For professional investors and active traders, now is the time to prepare. BBDelta advises clients to structure scenario-based strategies, focusing on key levels and volatility hedging. Sideways markets offer opportunities for precision entries, capital protection, and disciplined positioning — all critical before the next major impulse move.
Bitcoin - Will Bitcoin continue its upward trend?!Bitcoin is above the EMA50 and EMA200 on the four-hour timeframe and is in its medium-term ascending channel. Bitcoin’s current upward momentum has the potential to reach its previous ATH. If it corrects, you can look for Bitcoin buying opportunities from the identified support area, which is also at the intersection of the bottom of the ascending channel.
If this support is lost, the decline will continue to around $113,000, where you can again buy Bitcoin with a better risk-reward ratio.
It should be noted that there is a possibility of heavy fluctuations and shadows due to the movement of whales in the market, and capital management will be more important in the cryptocurrency market. If the downward trend continues, we can buy within the demand range.
Last week, a group of U.S. senators released an initial draft of a new legislative proposal aimed at creating a clearer regulatory framework for the digital asset industry in the United States. The proposal builds on the recently passed CLARITY Act in the House of Representatives and focuses on strengthening market structure, enhancing consumer protection, and expanding regulatory oversight.
According to the senators, the bill addresses key areas such as banking, disclosure requirements, securities classification, and measures to combat illicit financial activity.Senator Lummis, in highlighting the proposal, stressed the urgent need for legal clarity to support the growth of this emerging industry within the U.S. The legislation aims to facilitate the integration of digital assets into banking services and would allow financial holding companies to provide services based on such assets.
The draft also includes measures aimed at preventing illegal financial activities, such as improving regulatory standards and boosting inter-agency cooperation to identify and block misuse of digital assets.
In addition, the senators have issued a “Request for Information” (RFI) to support the legislative process and have invited the public to share their opinions on more than 35 related topics, encouraging broader engagement in shaping the bill.
Meanwhile, in Asia, Japan-based firm Metaplanet announced that it has added 780 BTC worth $93 million to its digital holdings. This acquisition brings the company’s total Bitcoin reserves to 17,132 BTC, valued at roughly $2 billion. Metaplanet is fast becoming one of the largest institutional Bitcoin treasuries in the region—potentially serving as a model for other firms across Asia.
At the same time, publicly traded U.S. companies have significantly ramped up their Bitcoin holdings. By the end of Q2 2025, these companies had accumulated nearly 900,000 BTC, marking a 35% increase over the previous quarter. This surge, driven primarily by firms such as MicroStrategy, has sent demand for Bitcoin soaring.
Some analysts believe that the $1.5 trillion in free cash flow held by companies within the S&P 500 index could spark a new wave of institutional Bitcoin buying.
Looking ahead, the upcoming week is packed with critical U.S. economic data. Alongside the Non-Farm Payroll (NFP) employment report and inflation metrics via the Personal Consumption Expenditures (PCE) index, the initial estimate for Gross Domestic Product (GDP) and various other indicators will be released—potentially offering a clearer picture of where the U.S. economy is heading.
The Federal Reserve remains primarily focused on inflation and labor market dynamics. June CPI data indicated signs of inflationary pressure caused by tariffs. If Thursday’s PCE report—particularly its core reading—confirms a similar trend, the Fed may decide against a rate cut in September. As a result, financial markets have priced in only about a 65% chance of a rate cut at that meeting.

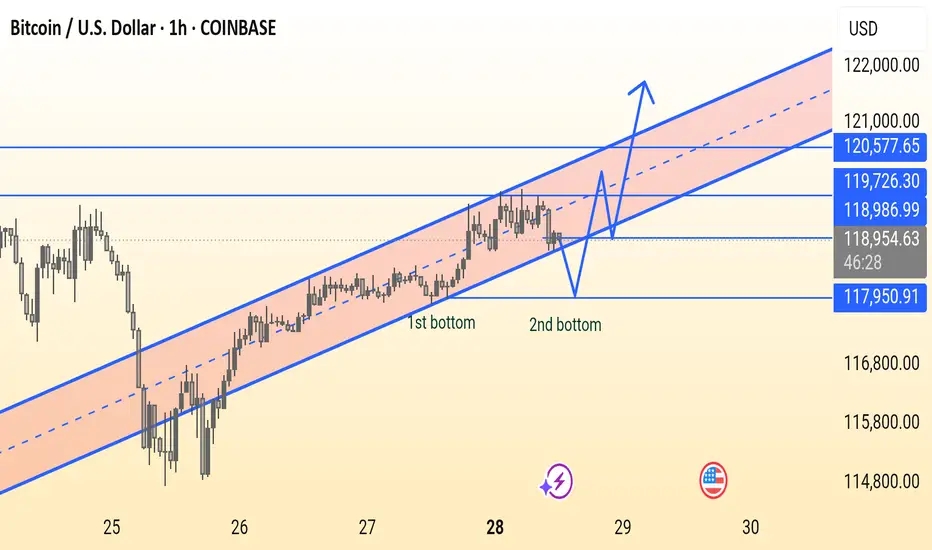
BTC/USD Double Bottom Forming in Uptrend ChannelThis BTC/USD 1-hour chart shows Bitcoin trading in an ascending channel, forming a potential double bottom near support around $118,950. A breakout above $118,986 could lead to a bullish move toward $120,577. Key support lies at $117,950 — holding this level is crucial for bullish continuation.