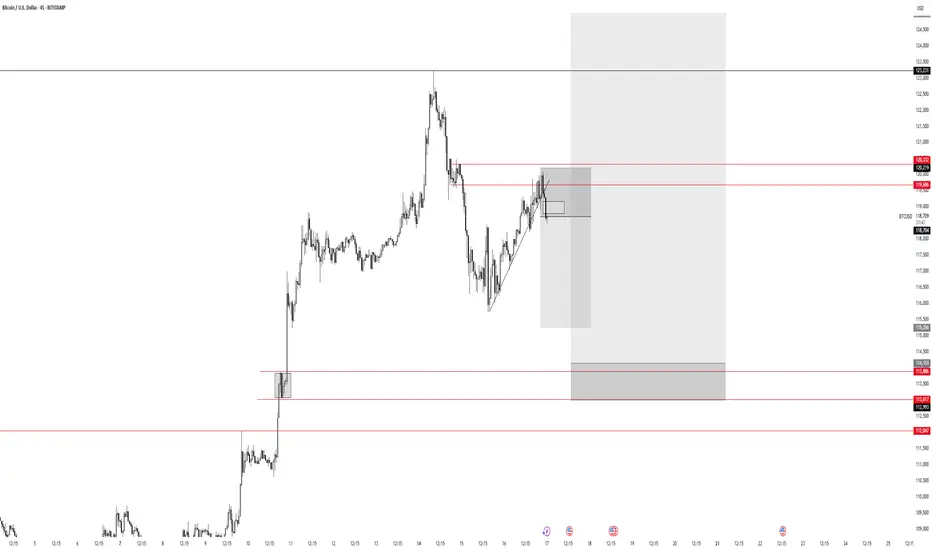
16.07.2025 #BTCUSDSELL 119000.00 | STOP 124000.00 | TAKE 114000.00 - 112200.00 | Downward price movement.
BTCUSD.P trade ideas

BTCUSD – Pullback Imminent?📉 BTCUSD – Pullback Imminent?
Buyers beware ⚠️ — The bullish FVG on the daily chart is no longer holding. Price has shown signs of rejection from the premium zone , and a deeper pullback toward the Fair Value Area at 111,740 seems likely.
🧠 Let the market breathe... we’ll catch the real ride from below.
👀 Eyes on the Monthly FVG (T2,4) as the ultimate demand zone if price accelerates lower.

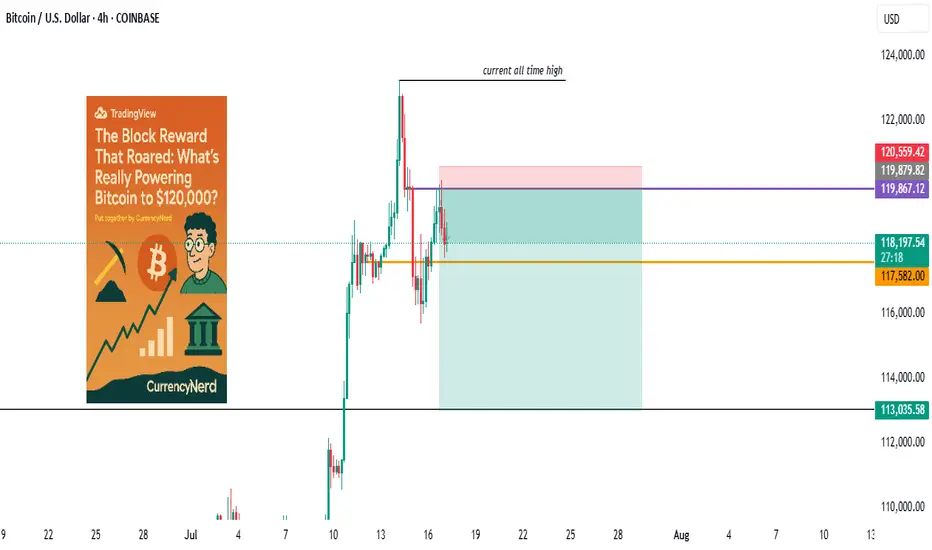
wall Street has set camp on Satoshi's backyard...Bitcoin didn’t just wake up and choose violence. It chose velocity.
As BTC blasts through the six-figure ceiling and fiddles $120k with laser precision, everyone’s pointing to “the halving” like it’s some magical switch. But let's be real, Bitcoin bull runs don’t run on fairy dust and hope. They run on liquidity, macro dislocations, structural demand shifts, and a pinch of regulatory chaos.
Here’s the nerdy breakdown of what’s really driving the Bitcoin Rocketship (and why this one’s different):
1. The Halving Effect (Not Just the Halving)
Yes, the April 2024 halving slashed miner rewards from 6.25 to 3.125 BTC. But this time, the reflexivity is louder. Miners now have to sell less, and buyers (especially ETFs) have to beg for more.
Miners = Reduced Sell Pressure.
ETFs = Constant Buy Pressure.
That’s a one-way order book squeeze. Simple math, but powerful dynamics.
2. ETF Flows: The "Spot" That Launched a Thousand Rallies
When the SEC finally gave the green light to Bitcoin spot ETFs, TradFi didn’t walk in—they stormed in.
Think BlackRock, Fidelity, and friends becoming daily buyers. It's not retail FOMO anymore, it's Wall Street with billions in dry powder doing dollar-cost averaging with institutional consistency.
🧠 Nerd Note: The top 5 U.S. spot ETFs alone are now hoarding more BTC than MicroStrategy.
3. Dollar Liquidity is Leaking Again
Despite Fed jawboning, real rates are still under pressure and global liquidity is quietly creeping back. Look at the TGA drawdowns, reverse repo usage, and China’s stealth QE.
Bitcoin, being the apex predator of liquidity, smells it from a mile away.
“In a world flooded with fiat, Bitcoin doesn’t float. It flies.”
4. Sovereigns Are Quietly Watching
El Salvador lit the match. Now, Argentina, Turkey, and even Gulf countries are tiptoeing toward a Bitcoin pivot, hedging USD exposure without broadcasting it to CNN.
Central banks don’t need to love BTC to stack it. They just need to fear the dollar system enough.
5. Scarcity Narrative Goes 3D
With 99% of BTC supply already mined and over 70% HODLed for over 6 months, every new buyer is bidding for a smaller slice of the pie. ETFs and institutions are trying to drink from a faucet that only drips.
This is not a market with elastic supply. This is financial physics with a scarcity twist.
6. Market Microstructure is Fragile AF
Order books are thin. Real liquidity is fragmented. And the sell-side has PTSD from getting blown out at $70k.
This creates a “skateboard-on-a-freeway” scenario, when a few billion in inflows hit, prices don’t just rise. They gap.
Nerdy Bonus: The Memecoin Effect (No, Really)
The memecoin mania on Solana, Base, and Ethereum has been injecting dopamine into degens—and their profits are increasingly flowing into the OG digital gold.
It’s the 2021 cycle all over again, just with more liquidity bridges and fewer inhibitions.
Nerdy Insight: The Bull Run Has Layers
What’s driving BTC to $120,000 isn’t a single headline. It’s a stacked convergence of macro, structure, psychology, and coded scarcity.
Bitcoin isn’t “going up” just because of hope or halving hype. It’s going up because it’s the cleanest asset in a dirty system, and now both retail and institutions agree.
Still shorting? That’s not “fading the crowd.” That’s fighting thermodynamics.
Stay nerdy, stay sharp.
put together by : @currencynerd as Pako Phutietsile
Crypto Week in the U.S. – Bitcoin SurgesCongressional Crypto Week: Bitcoin Hits All-Time Highs in a Decisive Week for the U.S.
Ion Jauregui – Analyst at ActivTrades
Bitcoin (BTCUSD) is back in global headlines after breaking above $123,203 this Tuesday, setting a new all-time high in the same week. So far in July, the leading cryptocurrency has surged 17%, fueled by a combination of institutional inflows, political momentum, and evolving regulation. This week, Washington is hosting “Crypto Week,” a key event that may define the legal and financial future of digital assets in the United States. At the same time, institutional backing shows no signs of slowing down—Bitcoin ETFs continue to set records for net inflows, particularly BlackRock’s IBIT, now managing over $85 billion in assets.
ETFs, Trump, and Regulation: All Roads Lead to Crypto
BlackRock’s spot Bitcoin ETF, IBIT, attracted $729 million in net inflows last week alone, setting a historic milestone by becoming the fastest ETF ever to reach $80 billion in assets under management—just 374 days, compared to over 1,800 days for the previous record held by the Vanguard S&P 500 ETF. The growing institutional interest—with over 265 funds and entities now actively investing in BTC—not only validates the asset class but also tightens supply: BlackRock reportedly acquired an average of more than 860 bitcoins per day last week. This persistent demand is directly contributing to the price momentum.
A Legal Framework in Progress
Three major bills are on the Congressional agenda this week:
The Genius Act: Aims to regulate stablecoins and has already passed the Senate with bipartisan support.
The Clarity Act: Seeks to define which cryptocurrencies qualify as securities or commodities, clarifying regulatory oversight.
The Anti-CBDC Act: Proposes restricting the government’s ability to issue an official digital currency, favoring decentralized ecosystems.
This regulatory push is seen by the market as a sign of institutional consolidation in the crypto space, paralleling the already advanced European MiCA framework.
Technical Analysis of BTCUSD
On the daily chart, Bitcoin broke decisively above the previous ceiling at $112,000 on July 12 and has since been validating a consolidation pattern near the $120,000 level—forming a bullish pennant on the 1-hour chart. The RSI remains overbought at 64.92%, but with no current signs of bearish divergence. The next technical target lies in the $130,000–$135,000 zone, while the nearest support is found at $118,000. A daily close below that level could trigger a technical correction toward $108,000–$109,000, marking the base of the current impulse. The point of control sits far lower at $85,195, although the current move appears to be unfolding within the third of three key volume profile levels. The MACD continues to support price expansion, though trading volume appears to be declining. Delta level indicators suggest strong resistance near current price highs, meaning another push may be needed—possibly triggered by continued regulatory momentum.
*******************************************************************************************
The information provided does not constitute investment research. The material has not been prepared in accordance with the legal requirements designed to promote the independence of investment research and such should be considered a marketing communication.
All information has been prepared by ActivTrades ("AT"). The information does not contain a record of AT's prices, or an offer of or solicitation for a transaction in any financial instrument. No representation or warranty is given as to the accuracy or completeness of this information.
Any material provided does not have regard to the specific investment objective and financial situation of any person who may receive it. Past performance and forecasting are not a synonym of a reliable indicator of future performance. AT provides an execution-only service. Consequently, any person acting on the information provided does so at their own risk. Political risk is unpredictable. Central bank actions can vary. Platform tools do not guarantee success.

SellRejection Level
Daily Volume
Market Structure Shift
London Session
Trend Line Break
Untapped Order Point
Head And Shoulder Pattern

Bitcoin Buy analysis/ideaThis analysis is based on the 4-hour and 1-hour timeframes and executed using Supply and Demand trading and trend formation. Complete explanation in the video!

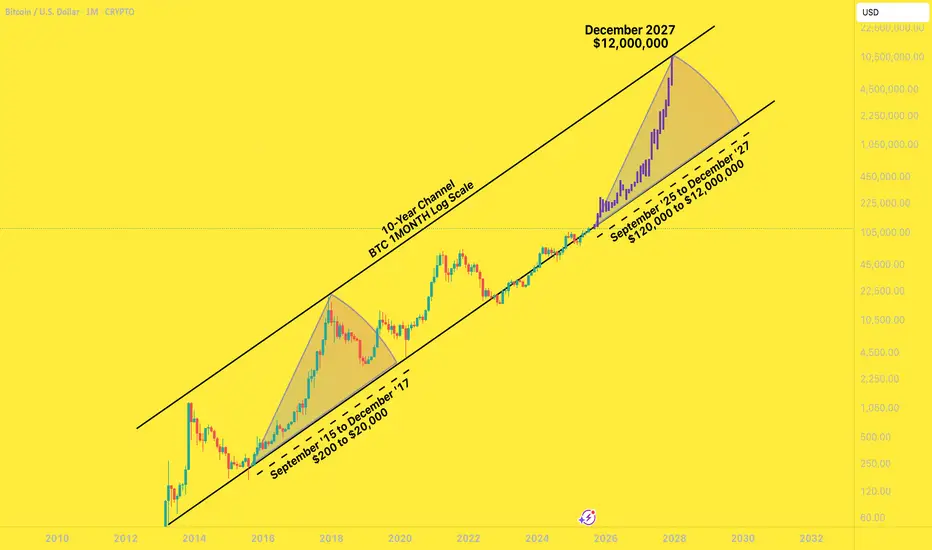
BTC to $12,000,000 December '27I had a years-old bookmarked chart from @MillionaireEconomics that I wanted to update and pick a random, extremely bullish candle pattern from the last time BTC came off the bottom channel to slap on it.
Riddle me this:
Why shouldn't Bitcoin go to $12,000,000 by December 2027?
Saylor continues to lead the way for global companies to scramble to build their own BTC warchests. These early adopters are having investor money dumped into them by the truckload.
Countries are stacking BTC
The BTC ETFs are a smash hit
Trump is all for making his own multi-billy family bitty stack
Mid-curvers will sell far too early, for far too little.
In the next two years, you'll be bombarded with countless, seemingly good reasons to sell your Bitcoins for hundreds of thousands of dollars - and then millions of dollars.
A shocking number of people will be far too early to sell. They will wake up in a cold sweat, night after night, haunted by their "could-have-been" stack, the number that updates in their head ten times a day, going up by six or seven figures a day .
... until they FOMO right back in at $11,999,999.
BTCUSD 7/16/2025Come Tap into the mind of SnipeGoat, as he gives you a Full Top-Down Analysis with a Deep Dive Down into the 30min Timeframe. This is One you don't want to miss.
_SnipeGoat_
_TheeCandleReadingGURU_
#PriceAction #MarketStructure #TechnicalAnalysis #Bearish #Bullish #Bitcoin #Crypto #BTCUSD #Forex #NakedChartReader #ZEROindicators #PreciseLevels #ProperTiming #PerfectDirection #ScalpingTrader #IntradayTrader #DayTrader #SwingTrader #PositionalTrader #HighLevelTrader #MambaMentality #GodMode #UltraInstinct #TheeBibleStrategy

BTCUSD – Potential Head & Shoulders Forming⚠️If and only if the price break below $115,000
⚠️ BTCUSD – Potential Head & Shoulders Forming
Pair: BTC/USD
Timeframe: 4H
Pattern in Focus: Head and Shoulders
Key Neckline: ~$115,000
Confirmation Trigger: Only valid if price breaks below the neckline zone with strong volume
🧠 Idea Summary:
Bitcoin has formed what appears to be a classic head and shoulders pattern. The right shoulder is completing, and the neckline is clearly respected. A break below $115K could confirm this bearish setup, with a measured move pointing toward the demand zone between $108K–$109K.
📌 Watch for:
Volume spike on breakdown
Retest of neckline turning into resistance
Potential long setups only if price reclaims $119K+
Bias: Bearish if $115K breaks. Neutral until then.

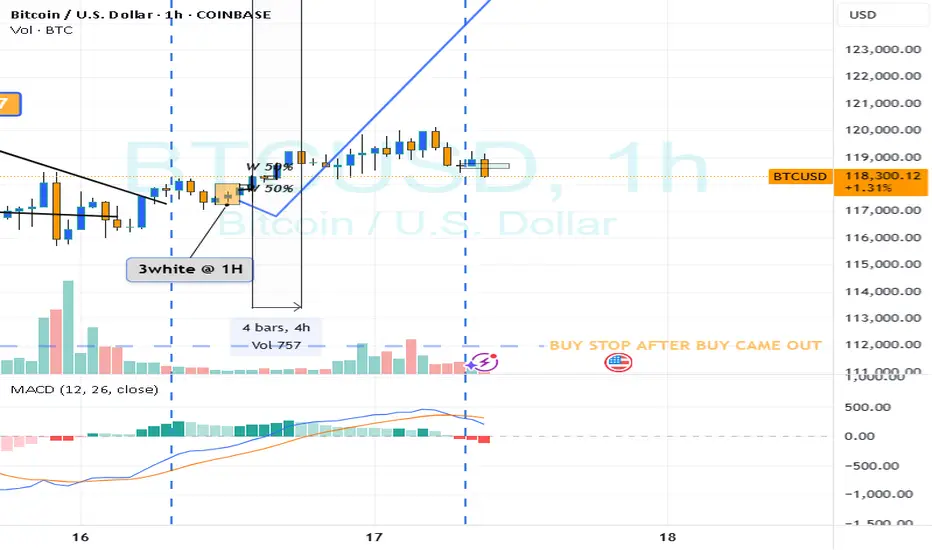
BTC intra? RECAP
Hi
Hope yest was a successful day trading for you.
Initial Bias for the DAY was up
I found : 3 white soldiers
Instant entry at found
or wait for retrace and my stop was below pattern
Profit. take when satisfied
So very important what risk i put in
say 100$ for a trade would be happy at 200$-300$
1:2 /3
or whatever i'm willing
adjusting to every trade
Easier said than done; your confidence will suddenly peak
You'll push your luck .. n risking way more than should
Be discipline
I hope the force will be with you.. n be lucky in 99.999% of the time
Not a guru
*& sharing is not a sin
nb/ all guru can slideee :)
Looking for your nx entry???
Bullish Patterns - will be in pdf in www
If new; print it
trade when see one (forexbee.co)
Do 20-50 trades.
Journal it.
Then your report card; positive or negative
pass or fail, is the pattern in web telling you the truth or lie
You decide
I hope your confidence will spike and won't depend on anyone anymore.
It's like learning to walk..
BTC FORECASTExpected push to the downside(below 114,400 region)
Breakout above current marked high.
Expected ATH(125,000) as target.
Best Regards,
Gideon Stephen (GS)
#bitcoin #crypto
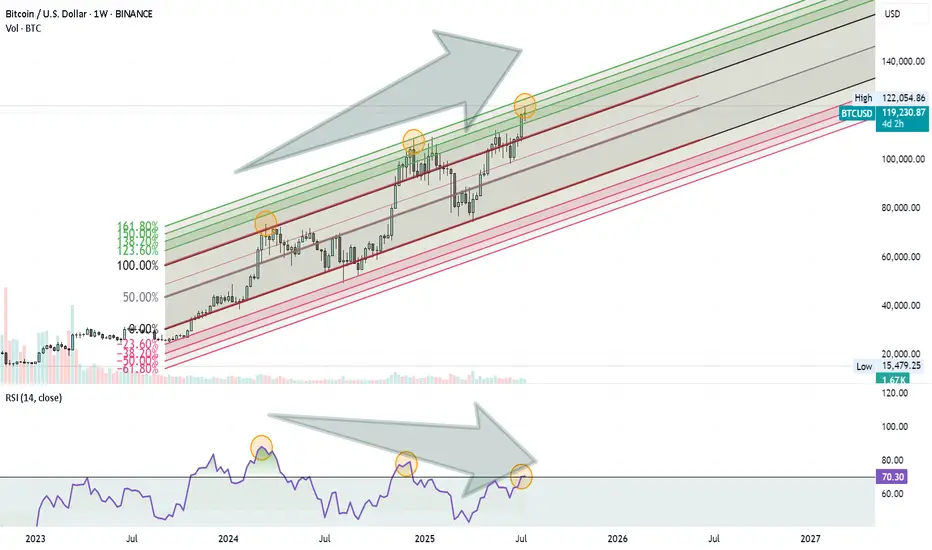
Bitcoin Rally Losing Steam?Bitcoin might be approaching a Turning Point . Here’s what I’m seeing on the weekly chart:
Price is moving inside an ascending Fibonacci channel.
It’s getting close to the 1.60 (160%) extension level, which has acted as a reversal zone before.
At the same time, the RSI is showing a clear negative divergence, suggesting that momentum is weakening.
These signs combined could mean we’re not far from a significant correction.
Nothing is confirmed yet, but it’s a setup worth keeping an eye on.
BTC USDT 135k TARGET. BTC USDT going to cross the 135k mark by the year end before cooling off.
HISTORY REPEATS ITSELF.

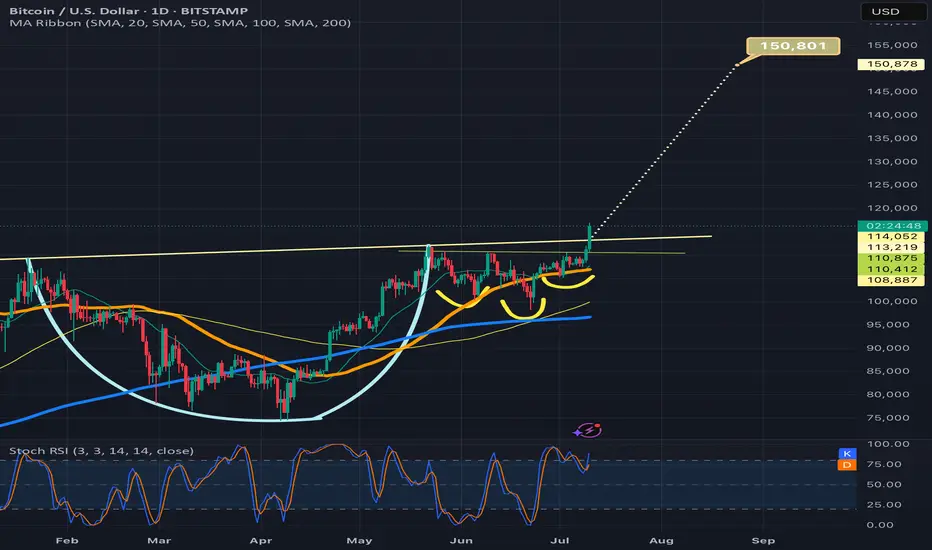
Btcusd breaking above cup and handle necklineIf it confirms the bullish breakout the target is 150k. Also by breaking above 116k and solidifying that level as strong support, we will trigger an even bigger inverse head and shoulders pattern (not shown here) with a breakout target around 208k! I will provide a link below to the chart I posted of that pattern. Thanks for reading, liking, and following. *not financial advice*
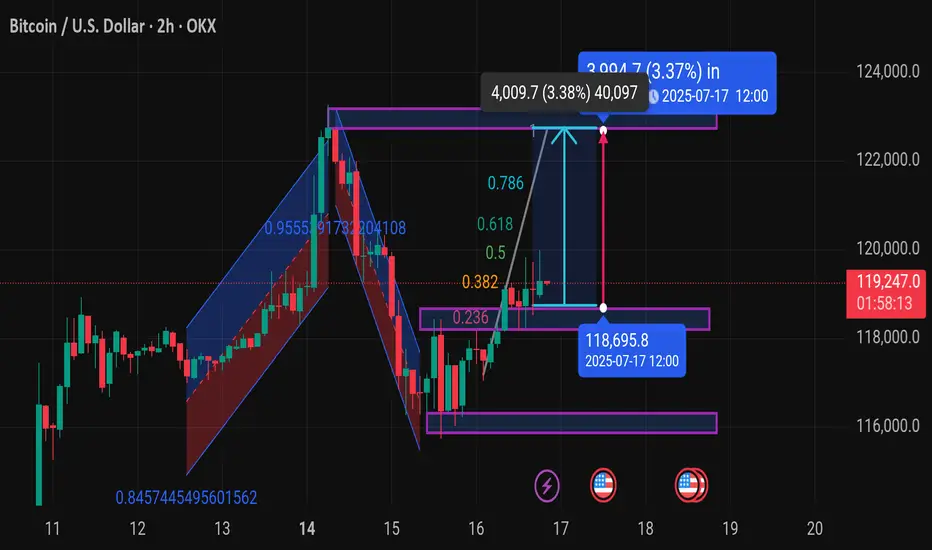
Btcusd techinical analysis.Chart Overview (BTC/USD - 2H, OKX):
Current Price: $119,240.5 (+1.23%)
Key Zones:
Support Zone: Around $118,695.8 (highlighted for July 17, 12:00)
Resistance/Target Zone: Around $123,250 (based on the measured move)
Fibonacci Levels: Drawn from the recent swing high to swing low
Important retracement levels: 0.236, 0.382, 0.5, 0.618, 0.786
Price is currently testing the 0.5–0.618 zone, which is a common area for potential breakout or rejection
Potential Price Move:
Bullish Projection:
Upside target of $4,009.7 (3.38%) from the breakout area
Reaching the $123,250 range by July 17 at 12:00 (UTC)
Technical Patterns:
It looks like you're tracking:
A potential bullish breakout from a consolidation range
Possibly a bullish flag or continuation pattern
Momentum is shifting after a clean bounce off the 0.236 zone
---
Let me know if you want:
A deeper analysis (e.g., RSI, MACD, volume)
Confirmation for long/short entries
Risk management suggestions
What’s your goal here — are you planning to trade this move or just analyzing the pattern?

BRIEFING Week #29-30 : BTC stalling, ETH & then Alts ?Here's your weekly update ! Brought to you each weekend with years of track-record history..
Don't forget to hit the like/follow button if you feel like this post deserves it ;)
That's the best way to support me and help pushing this content to other users.
Kindly,
Phil

BITCOIN- MONSTER ORDERS IN THE BOOK -> You Know What This Means COINBASE:BTCUSD “Monster orders” are exceptionally large buy-limit orders clustered roughly 7 % beneath the current market price.
Large buy-limit walls can act like a price magnet—deep liquidity attracts algos and traders hunting fills, often pulling price straight toward the level.
Once the wall absorbs the selling pressure, the magnet flips: liquidity dries up, supply thins, and price can rip away from that zone with force.
They create a visible demand wall in the order book, signalling that whales / institutions are ready to absorb a dip and accumulate at that level.
Price will often wick into this zone to fill the wall, then rebound sharply—treat the 7 % band as potential support or entry.
Such walls can act as liquidity traps : market makers may push price down to trigger retail stop-losses before snapping it back up.
Confirm that the wall persists as price approaches and that spot + derivatives volume rises; if the wall disappears, it may have been spoofing.
Always combine order-book context with trend, momentum and higher-time-frame support for higher-probability trades, Just like the extremely powerful indicators on the chart.
🚀 Marty Boots | 17-Year Trader — smash that 👍, hit LIKE & SUBSCRIBE, and share your views in the comments below so we can make better trades & grow together!

Bitcoin positive diversion to $131,000Using fibonacci retracements for price targets based off of positive divergences on the 15 min time frame and hourly time frame. I am utilizing 2 ioscilating indicators: RSI length is 36 with smma at 50 and the Chande momentum oscillator with a length of 24. My conservative estimate is $131,000 for a safe trade close. $132,400 exact area for pullback to $128,500?

Bitcoin -> The bullrun is not over!📣Bitcoin ( CRYPTO:BTCUSD ) is still totally bullish:
🔎Analysis summary:
A couple of months ago Bitcoin broke above the previous all time high. This was basically just the expected creation of new highs, perfectly following the underlying cycles. With respect to the long term rising channel formation, this bullrun on Bitcoin is just starting.
📝Levels to watch:
$100.000
🙏🏻#LONGTERMVISION
Philip - Swing Trader

Bullish Correction Complete — Targeting 125,500–126,000Market Overview:
After a strong bullish impulse, BTC retraced to the 116,000–117,000 support area and is now showing renewed momentum. The current price action suggests a move toward the 125,500–126,000 target zone.
Technical Signals & Formations:
— Completed ABC corrective structure
— Weekly support held at 116,000–117,000
— Price bouncing from 144 EMA
— Break above local resistance confirms bullish continuation
Key Levels:
Support: 117,000, 116,000
Resistance: 123,300, 125,500–126,000 (target zone)
Scenario:
Primary: holding above 119,000 opens the way toward 125,500–126,000
Alternative: break below 117,000 could lead to a deeper pullback toward 115,000

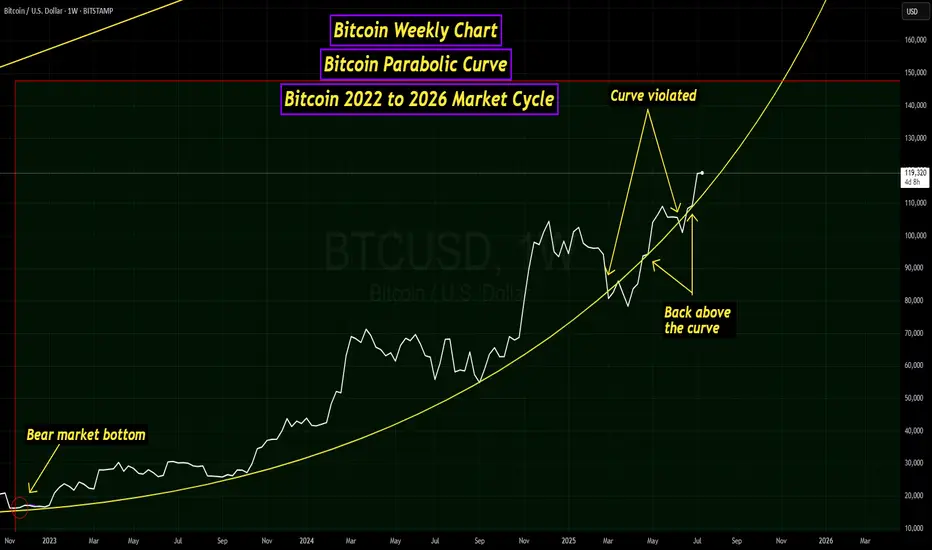
Bitcoin Parabolic Curve - 2022 to 2026 Market CycleThis line chart visualizes the current Bitcoin market cycle from the bear market bottom in November 2022. As you can see, the price has formed a parabolic curve, which was violated around the beginning of March. A couple of weeks later, a retest of the curve occurred, which was rejected. Later in April, the price of BTC was able to push back above the curve. There was another small dip below in June, but BTC was back above the curve by the end of June.
I am also watching the Bitcoin monthly chart and, more specifically, the monthly Stochastic RSI indicator. As you can see in the chart below, between the second and third months after the market cycle peak, the Stochastic RSI indicator has always dropped below the "20" level, and was near zero at the close of the third month.
Back in March and April, there was some speculation that the new all-time high set on January 20th at just over $109k was the peak for this market cycle. At the beginning of April, the Stochastic RSI dropped well below the 20 level but rebounded and was at 16.81 when the April candle closed. The May monthly candle closed with the Stochastic RSI at 31.45, and June closed at 50.17. This indicated to me that this market cycle was far from over.
On July 14th, BTC set a new all-time high at just over $123,000, ending the speculation that this current market cycle had peaked. My assumption for now is that Bitcoin is still following a 4-year market cycle. If this is true, I would expect a market cycle peak sometime in the final months of this year. Either way, it has been a very interesting market cycle with huge changes for the crypto asset class.
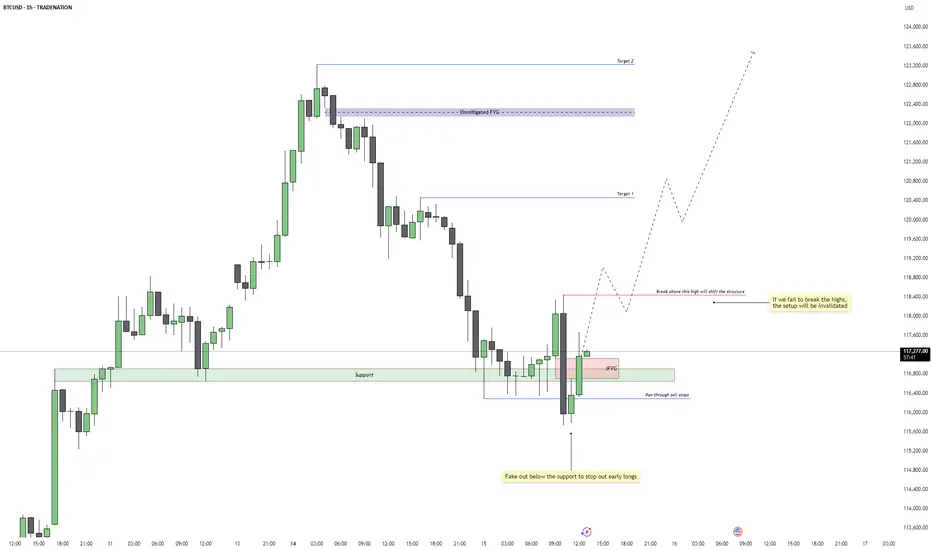
Bitcoin - Reversal Setup or Just a Trap Reset?Price faked below the 1H support zone around 115,800, triggering a clean run through resting sell stops. This classic liquidity sweep flushed out early long positions before immediately reclaiming the range. The move aggressively filled a prior imbalance and flipped sentiment just when it seemed the trend might break lower. The quick rejection and recovery from this level suggests smart money accumulation beneath support.
Formation of a 1H Inversion Fair Value Gap
The rebound from the liquidity grab printed a bullish 1H inversion FVG, now acting as a potential launchpad for continuation. This FVG coincides with the same zone that was previously support, now carrying added confluence. As long as price remains above this gap, the reaction shows bullish intent, with buyers reclaiming initiative after a shakeout.
Trend Shift Trigger and Invalidation Level
The current structure remains technically bearish until we break above the marked 1H high at 118,400. That level is the structure shift trigger. A decisive close above it would confirm a market structure shift and open the door to a broader bullish continuation. However, failure to close above this high would invalidate the setup and suggest that the move from support was just a temporary retracement rather than a full reversal.
Upside Targets and Continuation Outlook
If we get the bullish break above 118,400, I’m looking for price to reach Target 1 near 120,400, followed by Target 2 around the unmitigated FVG at 122,200. These levels align with clean inefficiencies that are likely to get filled if the market gains momentum. With enough volume behind the breakout, BTC could push into ATH territory above 123K as part of a larger macro expansion.
Volume and Higher Timeframe Context
Volume is the final key piece. We need strong follow-through above 118,400 for the setup to remain valid. Weak rejection or consolidation below that red line would signal distribution and potential failure. On the higher timeframes, BTC still looks constructive, but the 1H structure must confirm by breaking higher, or the broader bullish case will need to be re-evaluated.
Conclusion
BTC swept 1H support, ran stops, and printed a bullish inversion FVG. A break and close above 118,400 would confirm trend reversal and initiate a move toward 120,400 and 122,200. If we fail to close above that level, this setup is invalidated and the range could continue or break lower.
Disclosure: I am part of Trade Nation's Influencer program and receive a monthly fee for using their TradingView charts in my analysis.
___________________________________
Thanks for your support!
If you found this idea helpful or learned something new, drop a like 👍 and leave a comment, I’d love to hear your thoughts! 🚀