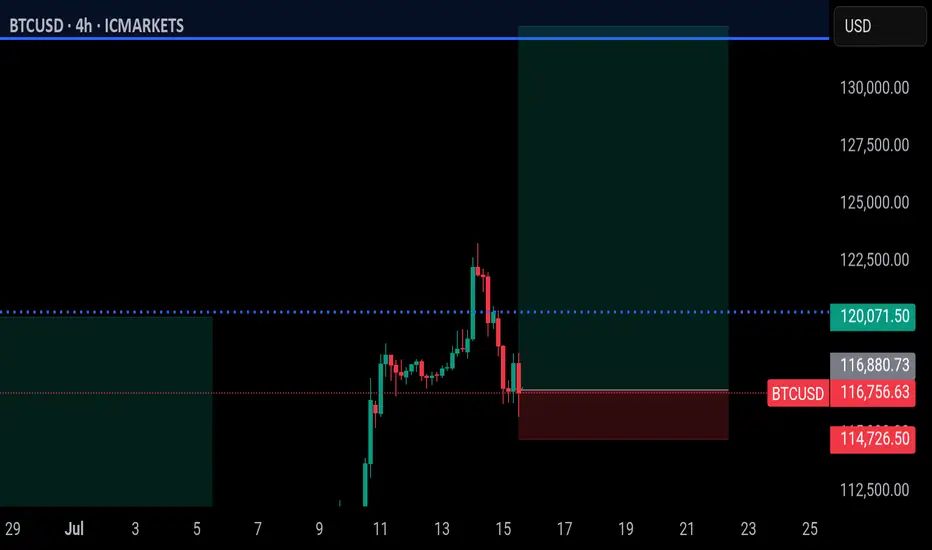
Bitcoin - V-shape recovery down towards the 4h FVG at $111.000?The move began with a strong rally that peaked near the $123,000 level. After hitting that high, Bitcoin quickly reversed and sold off aggressively, forming a classic V-shaped pattern. This type of formation typically indicates a strong shift in momentum, where bullish control is quickly overtaken by sellers, leading to swift downward movement.
4H bearish FVG
Shortly after the initial drop, Bitcoin made a retest of the bearish 4H FVG (Fair Value Gap) around the $119,000 to $120,500 zone. This fair value gap was created during the sharp move down and represented an area of inefficiency in price. The chart shows that price moved back into this zone and was “perfectly retested,” getting rejected almost immediately. This rejection confirmed that sellers are respecting this imbalance, turning it into a short-term resistance level.
Market structure
As the price failed to reclaim the fair value gap and continued lower, it broke the market structure at around $117,000. This break suggests that the previous higher low was taken out, signaling a bearish shift in the intermediate trend. The market structure break often acts as confirmation that buyers are losing control and lower prices are likely.
CME gap
Adding to the downside pressure is the CME gap, labeled as the "BTC CME GAP" on the chart. This gap spans from roughly $114,000 to $116,300 and was formed over the weekend when the CME (Chicago Mercantile Exchange) was closed. Historically, Bitcoin has shown a tendency to "fill" these gaps by revisiting the price levels within them. The current price action has already started to dip into this region, which could suggest further downside to complete the gap fill.
Bullish 4H FVG with support
Finally, the chart hints at the potential drop to the lowest 4H FVG and previous resistance, located just above $111,000. This fair value gap aligns closely with a prior resistance level from earlier in the month, making it a logical magnet for price if selling pressure persists. It represents a confluence zone where buyers may look to step in again, especially if the CME gap is filled and the market is searching for support.
Conclusion
In summary, Bitcoin is showing bearish technical signs following a V-shape top and a strong rejection from the 4H FVG at $120,000. The break of market structure and ongoing fill of the CME gap suggest that further downside toward the $111,000 level is a strong possibility. Traders should watch closely for price reaction in that lower fair value gap zone, as it could serve as a critical area for a potential bounce.
Disclosure: I am part of Trade Nation's Influencer program and receive a monthly fee for using their TradingView charts in my analysis.
Thanks for your support. If you enjoyed this analysis, make sure to follow me so you don't miss the next one. And if you found it helpful, feel free to drop a like and leave a comment, I’d love to hear your thoughts!
BTCUSD.P trade ideas

BITCOIN NEXT TARGET 1205001. Professional & Direct:
BTC Long in Play – Eyes on 120,500 🔥
Momentum building strong. Stay in the trend — next target: 120.5K.
---
2. TradingView Style (Engaging):
Bitcoin Bulls Gaining Strength 🚀
Long position active. Targeting next major level at $120,500 — hold tight!
---
3. VIP Signal Tone:
BTC BUY Signal Active ✅
We’re riding the wave to $120,500. Strong confirmation on higher timeframes.

BTC! BREAK OUT.Initially i was hesitant to call thiss bottom and I will risk my non exsistant repution. That if we break through this resistance and pump a 1-2% break through 4 hour FVG we going ballistic I dont belive in 150k this month I believe in 127-130 k and a trtacement to 113k to fill CME gap. W tradez.

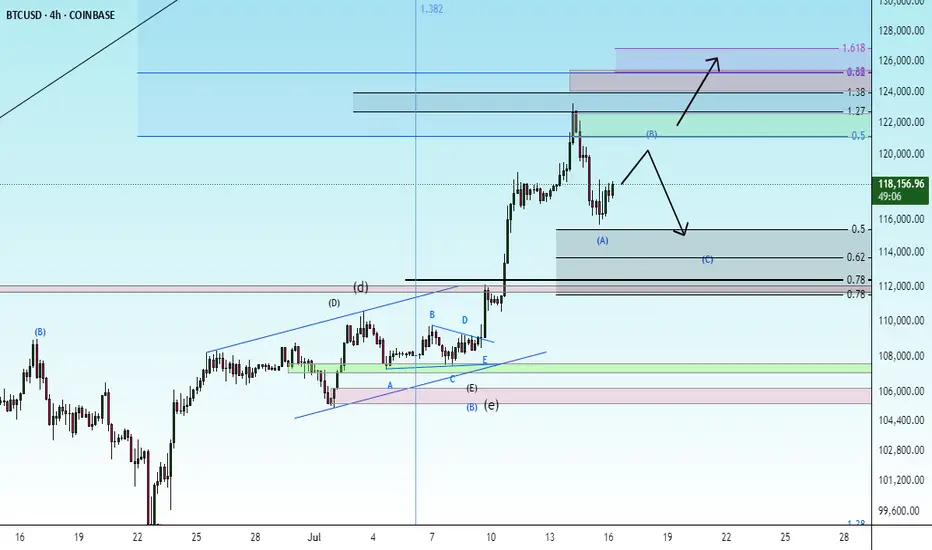
correctionGiven the completion of the current upward trend, the corrective pattern is expected to move along the specified path and go to the specified Fibonacci levels. Then the continuation of the upward trend will be possible.
BTCUSD focuses on shorting in the supply zoneOn the 4-hour chart, BTCUSD has fallen from its historical high. Currently, we can focus on the supply zone of 119200-120500. If the rebound is blocked, we can consider shorting. The downside target is around 112000.

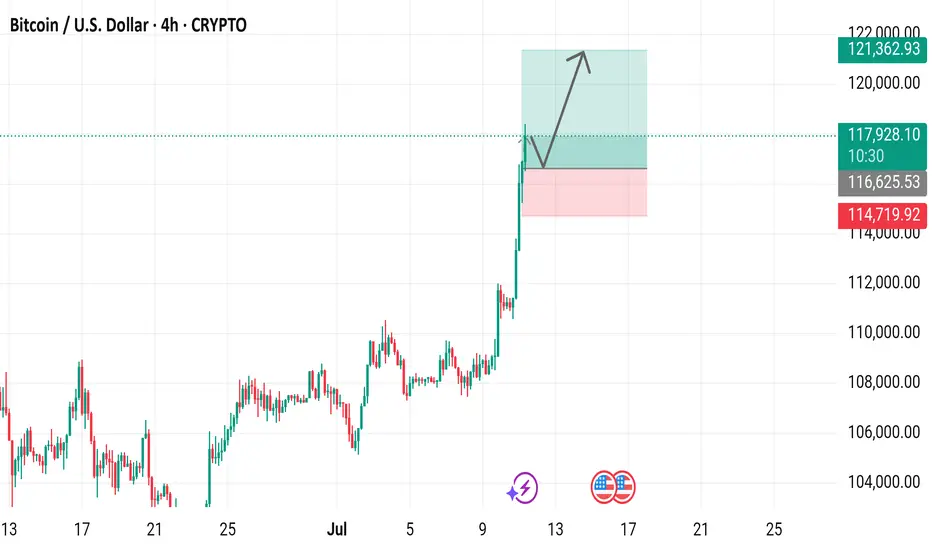
Bitcoin / U.S. Dollar 4-Hour Chart (BTCUSD)4-hour chart displays the recent price movement of Bitcoin (BTC) against the U.S. Dollar (USD) as of July 11, 2025. The current price is $117,979.53, reflecting a 4-hour increase of $1,938.91 (+1.67%). The chart highlights a significant upward trend, with a notable breakout above the $114,719.92 resistance level, reaching up to $121,362.93. Key price levels include support at $116,625.93 and resistance at $121,362.93, with buy and sell options marked at the current price.
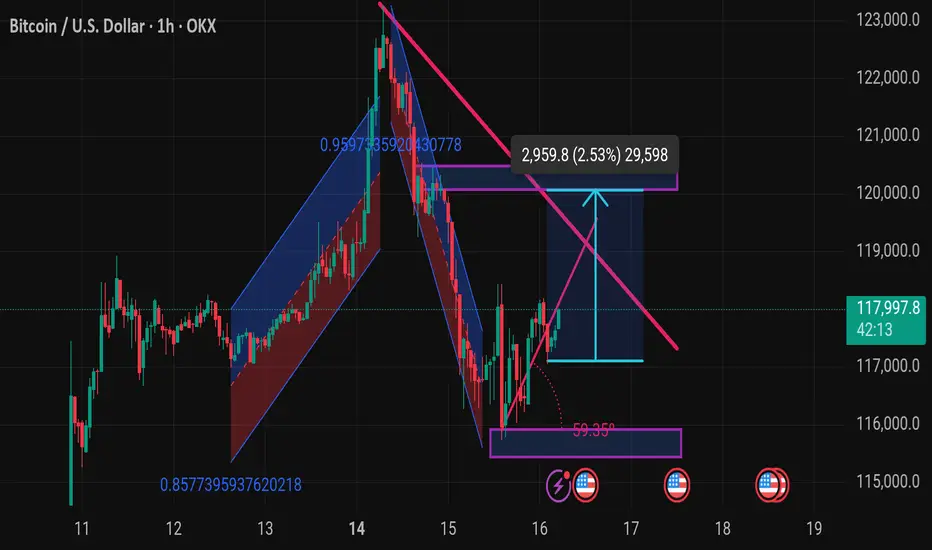
Btcusd techinical analysis.This Bitcoin (BTC/USD) chart from TradingView illustrates a technical analysis on the 1-hour timeframe. Here's a breakdown of the key elements and possible implications:
---
🔍 Chart Overview:
Current Price: $117,997.8
Timeframe: 1-hour candles
Exchange: OKX
Date/Time: July 16, 2025, 05:16 UTC
---
🧠 Key Technical Patterns & Indicators:
1. Descending Triangle Breakout Setup:
A descending resistance line (in pink) is converging with a horizontal support level (around $116,000–$117,000).
The price appears to be testing the upper boundary, indicating a potential breakout.
2. Target Measurement:
The blue arrow pointing upward suggests a measured move after a breakout.
Target Price: ~ $120,957.8 (approx. 2.53% move or +2,959.8 points from breakout level)
3. Support Zone:
Strong horizontal support zone marked in purple near $116,000.
This zone has held despite a sharp dip, indicating buyer interest.
4. Previous Trend Channels:
Blue and red channels represent bullish and bearish trends.
Recent bearish

Breaking below the psychological 115,000 level could trigger furMomentum indicators such as RSI and MACD likely show bearish divergence or downward momentum, supporting the short thesis.
The recommended stop-loss for this setup is at 119,000, which is just above recent resistance and protects against false breakouts.
This SL level offers a good risk-reward ratio, with approximately 2:1 or better depending on entry precision.
If price fails to reclaim 119,000 or form higher highs, the bearish momentum is expected to persist.
Price rejection candles or bearish engulfing patterns near 117,500 further validate short entries.
Breaking below the psychological 115,000 level could trigger further downside acceleration.
This setup is ideal for short-term swing traders or day traders looking to capitalize on intraday volatility.
Overall, the structure favors sellers as long as BTCUSD remains below the 119,000 resistance.

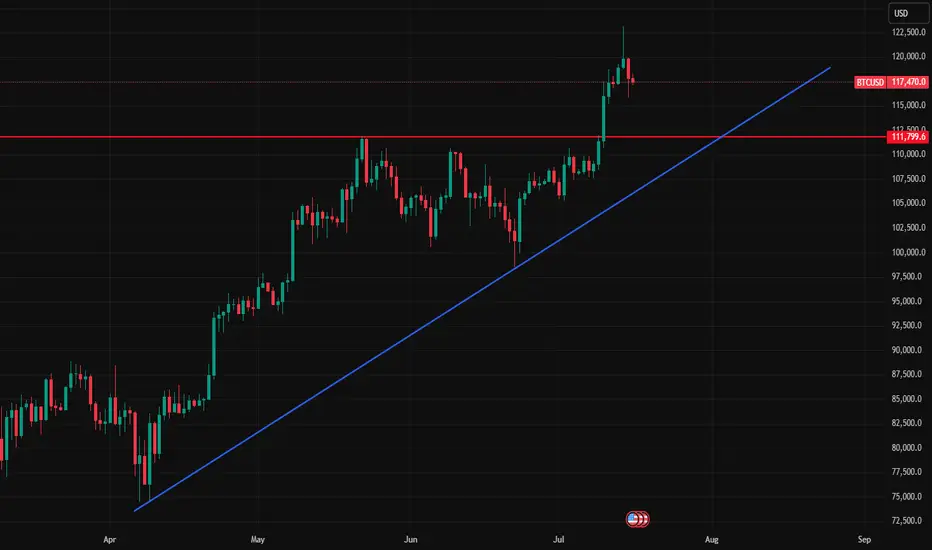
What Btc actually wants to sayThis trend line on daily chart shows sustain growth in BTC and it is rising day by day, Pure bullish in long run.
XAU/USD Chart Pattern ObservedBased on the image you've shared, this is a technical analysis chart for gold (XAU/USD), with a visible bearish setup in play. Here’s a detailed sell-side analysis:
Chart Pattern Observed
Bearish Pennant/Wedge Breakout:
The price appears to be breaking out downward from a rising wedge or bearish pennant pattern.
These patterns typically indicate a continuation to the downside after a short consolidation or pullback.
Key Levels Identified
Resistance Zone:
118.800 (Strong resistance level marked in red)
Price failed to break above this and reversed, confirming it as a solid supply zone.
Current Price: Around 117.500
Support Levels (Take Profit Targets):
116.000 – Minor support/first TP level
114.000 – Major support/final TP level (likely the full target of the move)
RSI Indicator
RSI at 50.71 – neutral but pointing slightly downward.
This gives room for further bearish momentum to unfold.
Sell Trade Setup
Entry: After confirmed break below the rising trendline (around 117.800 - 117.500)
Stop Loss: Above 118.800 (just above the resistance zone to avoid fakeouts)
Take Profits:
TP1: 116.000
TP2: 114.000
Trade Justification
Clear lower highs forming.
Rejection at strong resistance.
Breakdown of rising structure = bearish continuation.
Bearish projection arrows on chart suggest institutional outlook favors sell.
Risk Management
Use proper lot sizing based on your account balance and risk %.
Look for a retest of the trendline as a safer sell entry if missed the initial break.

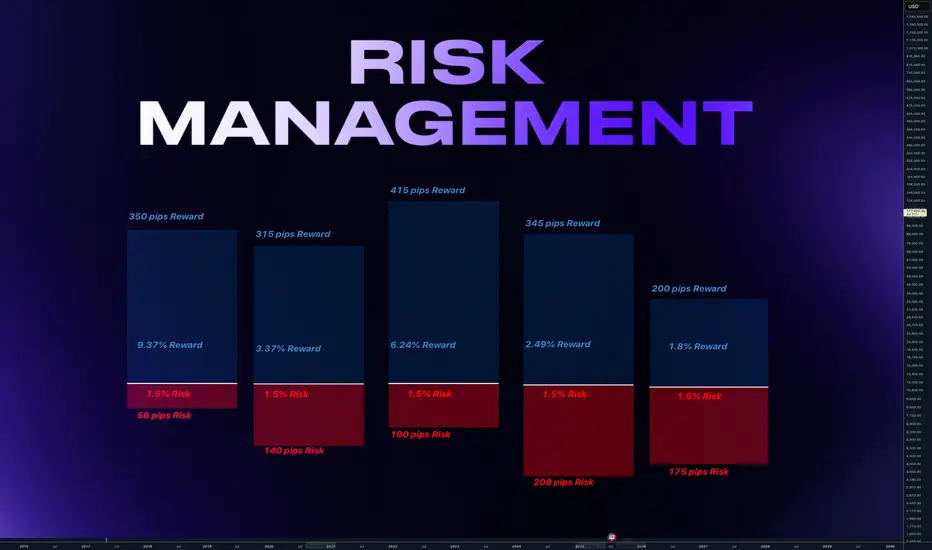
Why Risk Management Is Your Only Real Superpower in TradingMany traders obsess over entries, indicators, or finding the “perfect” strategy…
But the real longevity in this game comes from how you manage risk — not how often you’re right. Obviously it all starts with using stop loss. I hope you already know it. We all learned lessons in trying to enter the top / bottom and it was really not the top/ bottom yet.
✅ Always use Stop Loss.
Interestingly more then 50% failed prop challenges are because traders dont use a stop loss.
Now your stop loss should always be adjusted to the market structure. Not always same lot size
Obviously some short-term scalping can be done with the fixed SL and TP distance. But most of strategies needs to adjust SL to the current structure. And here come the problem. Many traders use still same lot size even when the stop loss distance is different and thats the problem.
Let me just show you on 2 examples of series of trades.
We count with 5 identical trade setups
Let's assume we had 5 trades 1 winner and 4 losses.
📌 1) Using always same position size on 10K account
- Outcome of trades is various
- 1 win with fixed lot was small. Instead of fixed lot we could use higher lot size as the SL distance was small. This trade didnt covered other losses.
- Losses of other trades are various
- psychological affect - uncertainty increasing fear of loss
- total result after is -273 pips
- minus 2.7% and - $273
📌 2) Calculated risk 1.5% for each trade
- we risk 1.5% for each trade by adjusting lot size
- You always know how much you loose if you loose.
- You can maximize profits on high RR trades.
- Every trade will have same % value in your series of trades. This makes your statistics working
- first trade has made huge profit - other 4 losses were 1.5% each
- first trade covered losses and even made gains
- we again ended in minus 273 pips
BUT +$337 IN MONEY / AND + 3.37% PROFIT
📌 Final Conclusion
Although we modeled 5 completely same trading setups in first example we ended up loosing in pips and money. While in the second example with the completely identical setups we ended in profit and more stability of on our account but also with psychological preservation.
And this is power of risk management and it has much bigger impact especially to our trading psychology which is 80% of success.
🧠 Psychological Importance of Risk Management:
🧪 Reduces emotional pressure
When your capital is protected, you stop making desperate, fear-based decisions.
🧪 Builds confidence in your strategy
Knowing you’re safe even if a trade fails allows you to focus on execution, not outcome.
🧪 Eliminates fear of losing
Small, controlled losses become part of the process — not something to avoid or fear.
🧪Improves consistency and discipline
Following rules forces you to act like a professional, not a gambler.
🧪 Prevents burnout and mental fatigue
Managing risk = managing stress. Overexposure to loss drains your mental capital, not just your account.
📌 Final tip
There is no strategy on the world which is only winning. Losses are normal. Same like restaurant owner has a cost with rent and salaries for employees. We as a trader has cost of the doing the business in losses. You cant avoid them.
One loss out of 4 trades is nothing. But what if you get in to a loosing streak like me in the may? How did I survive?
Many people would start doubting the strategy , doing the changes, switching to trading different markets etc.. But NO, if you know your statistical data and stick with the your risk management it will keeps you going. You know that even 75% win rate doesnt guarantee that you cant get in to a loosing streak.
75% winning ratio means that out of 100 trades you will win 75. But still there is 25 looters. And you never know what would be distribution of wins and losses. So you keep going and its only possible if you calculate risk per trade and know how much is your max loss per trade not by using same lot size for random stop loss distance.
“Adapt what is useful. Reject whats useless and add whats is specifically yours.”
David Perk aka Dave FX Hunter
BTC? intra
Hi
Looking ready for next round for upside.
Are you still bullish?
I see yest was accumulation.
If today is a bullish day. Later we'll see prints of 118500 above.
If not.. 116800 is not a good print.
All the best.
Not a guru

Adding a bit more to BTCUSDPlease see day and 1H chart , all bullish
This digital asset whether you believe it is productive and generates cash flow or not, please put 1-3% of your capital to it. Buy and keep long term , avoid trading unless you like volatility.
Bitcoin Backtest and continuation to $135000See trendline and respecting the support, looking for continuation up this week
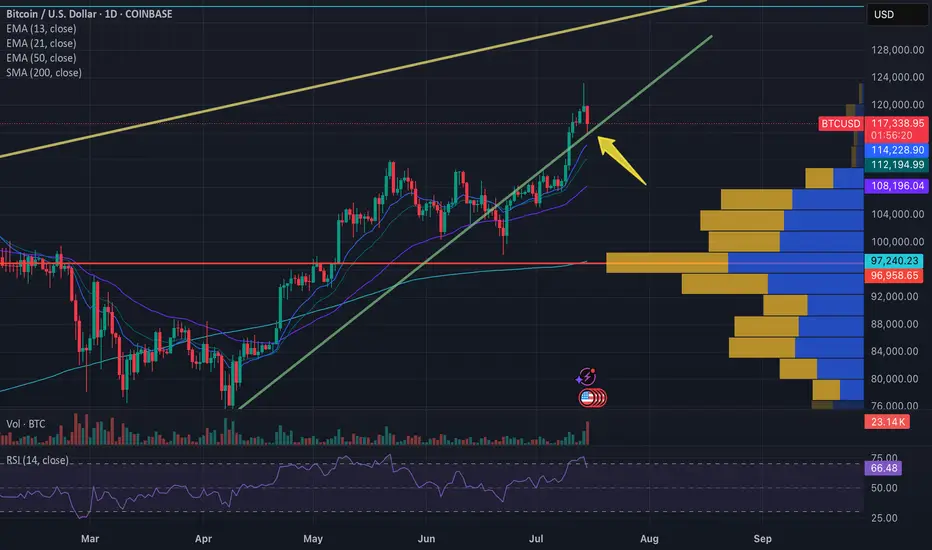
BTC – Strong Buy Signals, Sentiment Reversing, Final Push?BTC is clearly in a place of rising trust
- Fear & Greed Index improving: last week 24 (Extreme Fear), yesterday 31, now 38 (Fear), last month low was 3
- Several bullish divergences visible: RSI and MACD show higher lows vs. price, momentum indicators curling up, OBV ticking higher despite weak price action
- Price is sitting at the lower Bollinger Band and holding an ascending trendline
- Multi-indicator (mostly RSI-based) showing clustered buy signals, similar to previous rallies
- Simple Fibonacci retracement from the recent high (~73K) shows potential move toward 130K, assuming continuation and break above ~109K
- Last S-BUY signal was 14 bars ago, still active
- Structure is clean and holding
- If this is the final leg up, we could be entering danger or euphoria territory soon

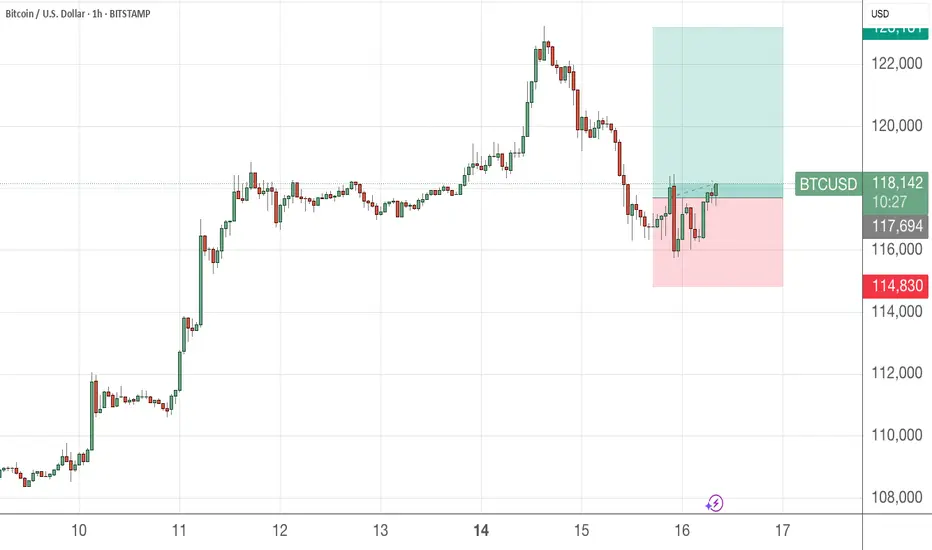
Potential 4hr SwingCurrently looking for clear confluence this week before BTC returns to 120k. Projected Consolidation and Accumulation for 7/16 and 7/17 and looking for a break above around 118k-119k. To load up before the next project hi (key lvl)
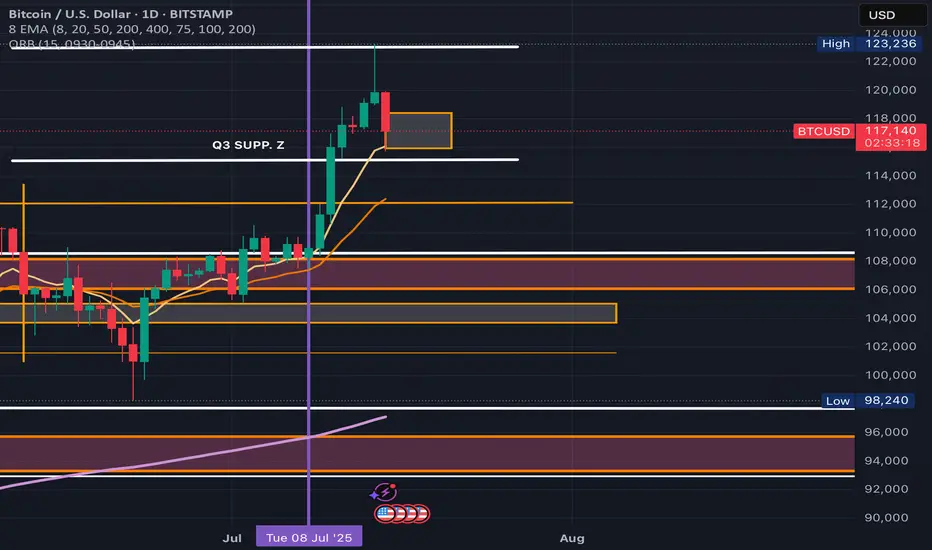
BTC Heading DownThis is my first chart using TradingView. I'm 50/50 on how I feel about it's utility, but it does well enough until I learn it better. I use the D Timeframe too look for support/resistance. I focus in on the 4h, then 1h further. I have recently switched from lower timeframes to higher timeframes with some surprising success following my rules. Constructive Criticism/Dialogue welcomed.
It is time for a reversal. Why? Those ATHs were just hit after two bullish runs for 2025 (Jan and July). Granted it would be hopeful for all investors to keep seeing this beast rip for a 3rd time in 2025, that is a dream, I think. There has been two runs then consolidation/pullbacks, NORMALLY (see hollow boxes on chart). This does not mean this is the case, but this is what I am going with after researching. After the ATH, a lovely wick and an incredibly high volume on an engulfing candle formed. This along with a PSAR switch on the 4H is what I utilize. I have only researched down to $102k. Each TP (blue line), I will be looking for a sign of reversal on the 4h.
Key:
Blue lines:
- My TP
Boxes:
- Areas of Interest
Hollow Boxes only:
- Shows two runs before a consolidation to an official breakout
Highlights:
- What within that area of interest I'm using for justification
Orange lines:
- Where in the past BTC has had breakouts then a retest before the next breakout
Red line:
- My SL
Enjoy your BTC,
AtlasRising
Bitcoin breaking out - 150k likely, possibly soon- complimentary analysis to the USDT D. one since they trade opposite of each other:
- 5D volatility is extremely low
- 150k is a mid-term target, it is likely Bitcoin reaches +200k before this bull market cycle is over

BTC SHORT FOR NOW?An all time high was achieved recently at around 123k USD. A number of buyers should potentially be liquidating their profits around this region, reducing buy pressure and ultimately leading to a short term pull back maybe close to around the 110's? Price action will have to reveal more information in order to see what happens after this movement.
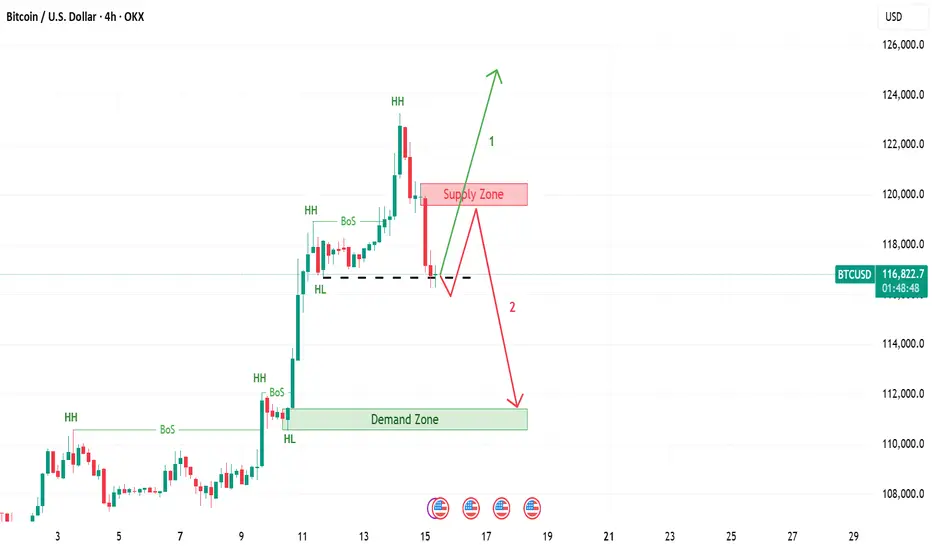
Bitcoin | 2 Scenarios If the 4 hour candle closes below last HL, then expect price return to supply zone and then go down till demand zone. If not, expect continuation of the upward trend, when 4 hour candle breaks last HH.
Which scenario you expect?
Final BTC target still remain above 130kBTC still has some push to do to reach my final target, 130k - 145k region. If you look at my BTC chart from January, that region has been highlighted. Till then, I'm still bullish. Now DXY is trying to turn bullish too, which will mean bearish BTC but it is that is s lagging indicator. It won't happen immediately, maybe next 2 or 3 months. Be prepared, for now, we still go up. Enjoyyy
Follow me as my trades are market order so you'll see the trades on time anand enter on time
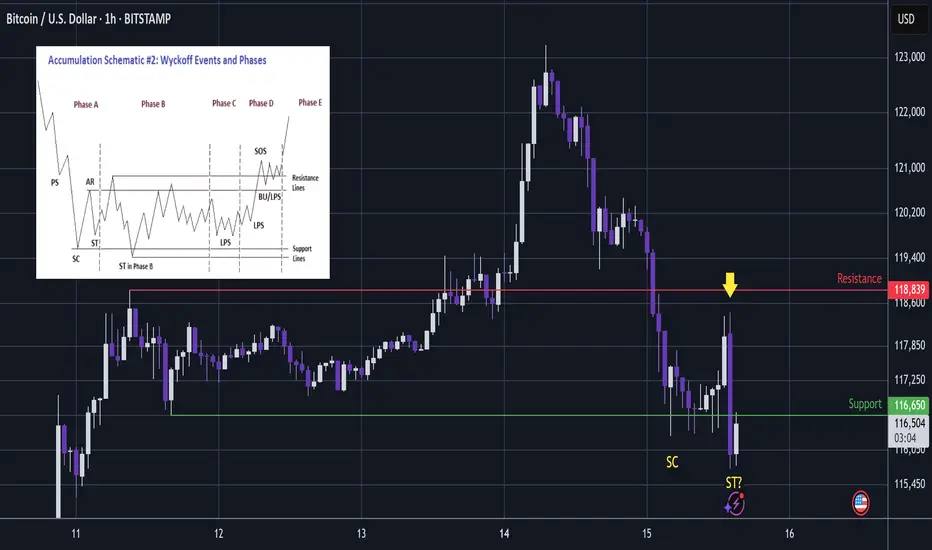
BTC - Capitulation. Now Time For A Bounce?Whenever there is a big impulsive rally, dumb money will come rushing in to buy.
And thus we can somewhat expect the market maker to print a shakeout for them to exit at best price and dumb money to carry the bags at worst price.
...
In this area we have multiple charts providing the liquidity zones for the shakeouts:
The upside shakeout (long wick) printed on TOTAL through ATH:
...
Before I make the next point, lets see the design of the chart bots 10 years ago in 2015.
Notice that the high and low of the trading range is set by the impulsive high then initial slump:
That sets the trading range.
Once set; the chart bots then print a liquidity sweeping slightly higher high...
Which slumps back to liquidity sweep the lows of the trading range.
From there the next wave up begins.
...
Now notice in these charts from the last 2 days, that the trading range was similar to that of 2015.
But once the range was set; rather than printing a simple slightly higher high, the more evolved chart bots printed a wild impulsive move up to draw in buyers.
This then became a very impulsive smackdown.
...
Although going on a wild journey, the price is effectively similar to the pattern of 2015; liquidity sweep at the highs and now it is below the low.
Notice on these 2 charts from the last two days that the support that Bitcoin has hit today was the obvious trading range low - similar to 2015.
And so the question is now; whether it will also be a liquidity sweep at the lows and a bounce will follow?
Notice on the chart, there was a big smackdown and then we have had another fast smackdown (arrow) to take price beneath the lows.
This looks very much like a fear test - where the chart bots try to sell you another immediate capitulation, but yet the price holds in the zone of higher liquidity below support.
Wyckoff would call these 2 lows SC Selling CLimax and ST Secondary Test.
The selling climax completes the real bearish wave down.
Secondary Test is the probe into higher liquidity which is a fear test to scare longs away.
...
So if we consider that history may not repeat, but it does rhyme then there will likely be a bounce in this area - as the market maker gets best price for their short positions while dumb money panic sell their long positions at a loss.
Not advice