BTCUSD.P trade ideas
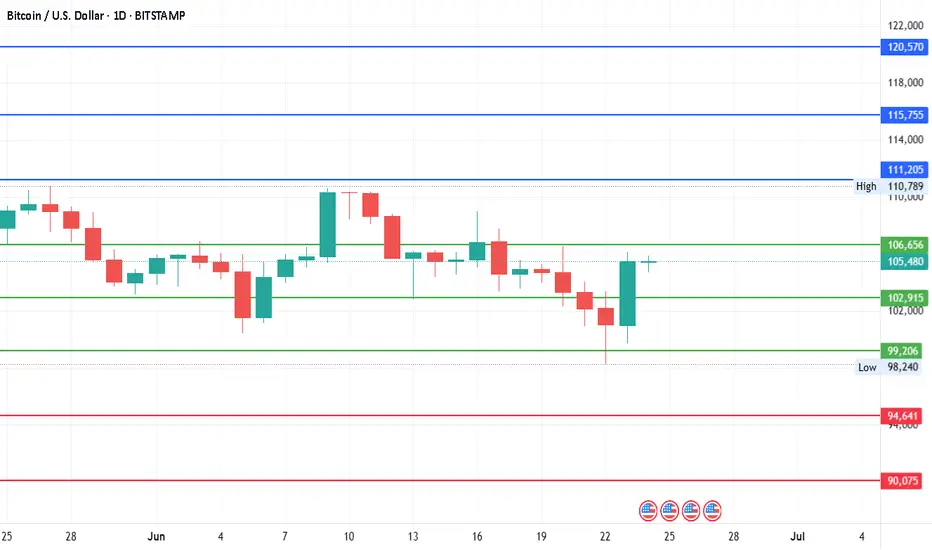
#Bitcoin - Pivot is $102915 | Target $125385 or $80445 ?Date: 24-06-2025
#Bitcoin
Current Price: 105375
Pivot Point: 102915.00 Support: 99206.48 Resistance: 106655.63
#Bitcoin Upside Targets:
Target 1: 111205.31
Target 2: 115755.00
Target 3: 120570.00
Target 4: 125385.00
#Bitcoin Downside Targets:
Target 1: 94640.74
Target 2: 90075
Target 3: 85260
Target 4: 80445.00
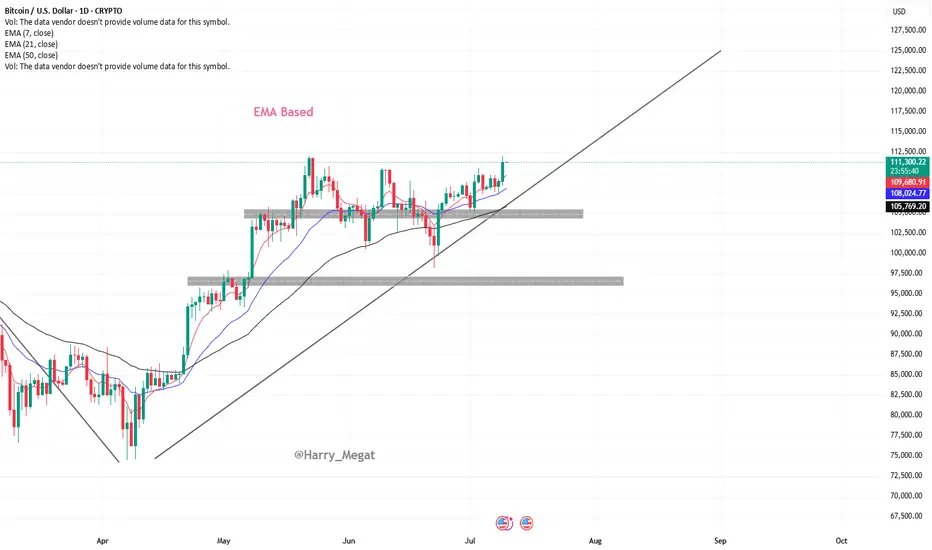
BTCUSD Chart Analysis (Daily Timeframe)Chart Analysis – BTC/USD (Daily Timeframe)
Trend Overview:
* The chart shows **Bitcoin (BTC/USD)** on the **daily timeframe**.
* Price is in a **clear uptrend**, making **higher highs and higher lows**.
* The recent breakout above **\$111,000** suggests a **bullish continuation**.
Moving Average Analysis (EMA 7, 21, 50):
* **EMA 7 > EMA 21 > EMA 50** — this alignment confirms **strong bullish momentum**.
* Price is **well above all EMAs**, especially the 50 EMA (\~\$105,546), showing trend strength and possible institutional support.
* EMAs are **sloping upward**, which further confirms the upward momentum.
Recent Breakout:
* BTC broke out of a **short-term consolidation zone** between \~\$108,000–\$111,000.
* Today’s candle shows a **strong bullish close**, indicating fresh buying interest.
* If this breakout holds, price could extend toward the **next psychological level of \$115,000–\$117,500**.
Support Zones to Watch:
* **Minor support:** \~\$109,000 (EMA 7 + breakout retest area)
* **Stronger support:** \~\$105,500 (EMA 50 and previous swing low)
A break below **\$105,500** could signal a trend shift or deeper pullback.
Summary:
Bitcoin is showing **strong bullish structure** on the daily chart with EMAs aligned upward and a recent breakout above \$111,000. If momentum holds, next upside targets are around **\$115,000–\$117,500**. The bullish trend remains intact unless price breaks and closes below **\$105,500**.
Btcusd techinical analysis.This Bitcoin (BTC/USD) 30-minute chart shows several key technical indicators and annotations, pointing to a bullish outlook. Here's a breakdown of the chart elements:
Key Elements:
1. Price Level:
Current price: $121,315.1
Change: +$2,178.0 (+1.83%)
2. Break of Structure (BOS):
Marked in yellow — indicates a shift in market structure from bearish to bullish.
It suggests a bullish trend continuation after this key resistance was broken.
3. FVG (Fair Value Gap):
The yellow "FVG" arrow points to an imbalance or gap between candle wicks that the market might return to for liquidity.
Often used as a potential entry point or pullback target.
4. Trendline:
The pink upward trendline shows current bullish momentum.
Price is currently testing or has broken above this trendline.
5. Bullish Flag/Channel:
Blue diagonal channel indicates a bullish flag or continuation pattern.
Price broke out upward from this flag — typically a bullish sign.
6. Fibonacci or Ratio Markers:
Numbers like 0.9612351706716865 and 0.305800778819... may

Ascending Inverse H&S on the BTC weekly chartThe longer it takes to break above this neckline the higher the breakout target will be. I have arbitrarily placed the measured move line at July 18th 2025. If the breakout were to happen on that day the measured move target is around 208k, which could take quite awhile to reach or if we entered a truly hyperparabolic blow off top we could reach such a target way quicker than when the dotted measured move line reaches it. *not financial advice*

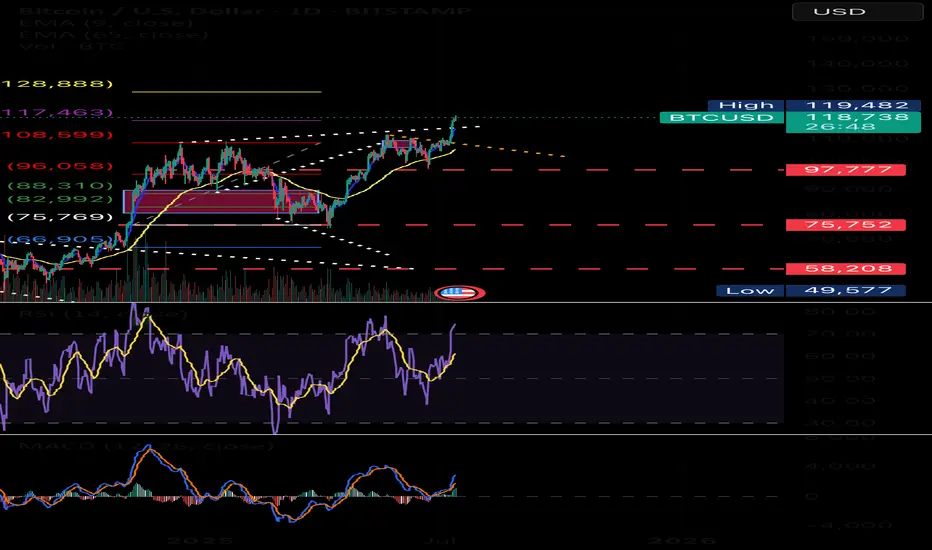
Bitcoin May Continue Rising After Breakout📊 Market Overview:
• Bitcoin recently broke above $118,000, reaching a weekly high of $118,740, fueled by expectations of a Fed rate cut in September and strong ETF inflows into the market
• Katie Stockton from Fairlead Strategies highlights a bullish cup-and-handle pattern, supporting a potential 14% upside toward $134,500
📉 Technical Analysis:
• Key Resistance: $120,000 – $128,500 (based on Fibonacci projection).
• Nearest Support: ~$108,300 – previous resistance turned support, along with ~$107,000 near the 50-day EMA.
• EMA 09: Price is trading above the 9-day EMA, indicating a short-term bullish trend.
• Patterns & Volume:
o A cup-and-handle breakout suggests continued upside potential.
o Rising volume on breakouts reflects strong buying interest.
o MACD is bullish, and RSI is not yet overbought — allowing further room to rise.
📌 Outlook:
Bitcoin may continue to rise in the short term if it holds above the 9-day EMA and avoids a sharp drop below the $108k–110k support zone. A break below this area could trigger a deeper correction toward $100k.

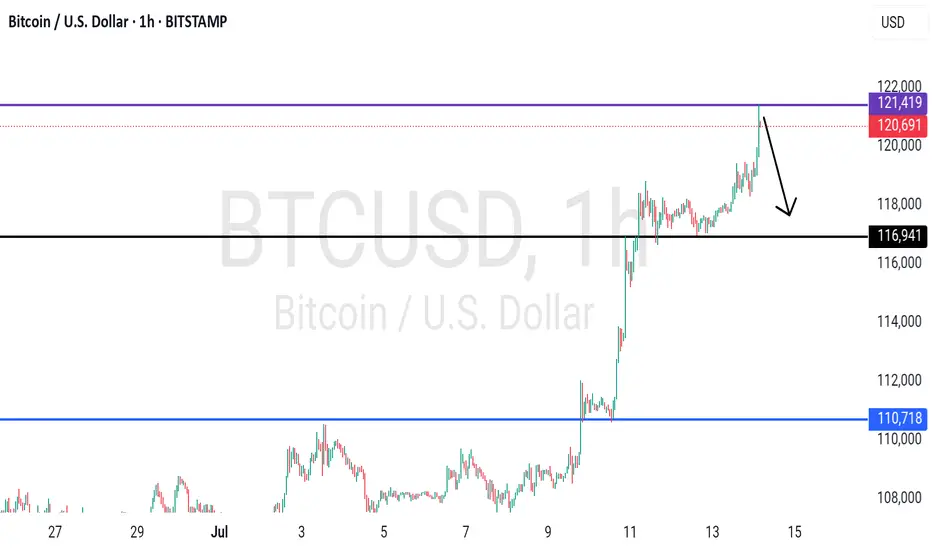
BTCUSDT - high placed? What's next??#BTCUSDT.. .A very reasonable high are placed so far.
That is around 120-121k
I'd market hold it in that case drop expected.
Good luck
Trade wisely
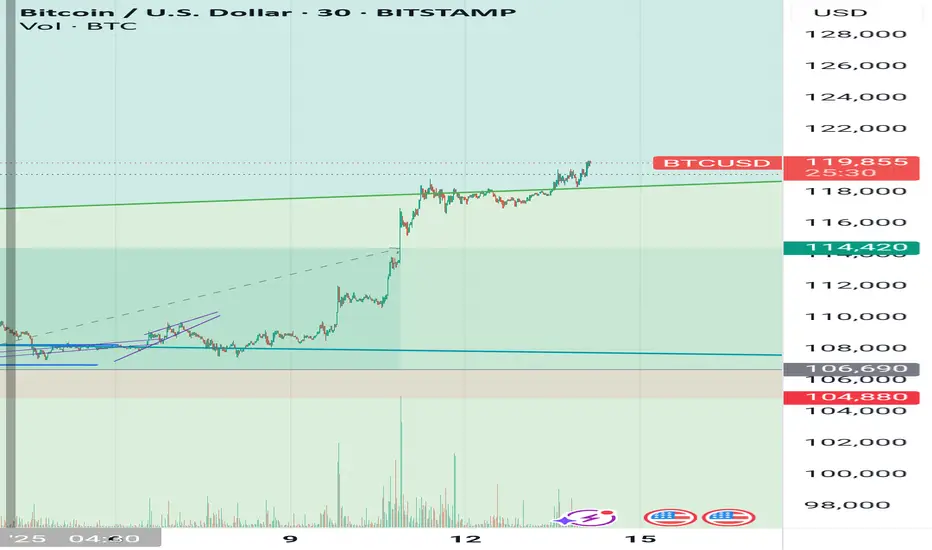
BTCUSDWeekend price pump will fade expecting price to fall back to $110k region before we see a major price move to $130k
Update on BTC Fan Chart.TradingView wouldn't let me update my last idea, but this fan chart still amazes me.
The breakout has played out very well. The vertical line indicates US Congress budget bill date.
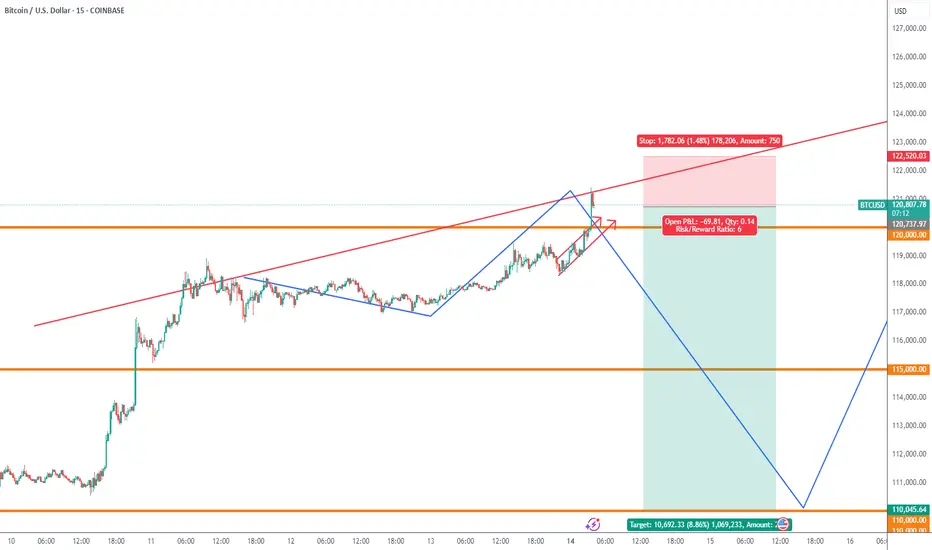
BTCUSDA short term Long biased although we favor the down side rather than the upside but we are trying to make some entry before we see major price retracement


BTC bullish scenario - short term bearishMapping out BTC sideways consolidation that could wreak havoc on ALTS.
Looking at the daily chart, this consolidation is still bullish as BTC price action is still likely respecting this ascending channel.
However, each move down on BTC could mean a significant dump on alt coins.
IMO, based on how the chart looks, BTC price still needs to come and test the bottom and coincidentally there is a huge FVG left when BTC rose impulsively. In all likelihood, I am expecting at the very least for a quick wick down to fill the gap before BTC can then start some bullish price action.

Inverted BTC tells the full storyahhh here we are again bulls with the same playbook late in the cycle. we will see 40k before 200k
$BTC 🚨 Bitcoin bullishness might be more than hype…
It could be a signal that investors are protecting assets inside liquidity pools, anticipating an interest rate cut soon. 💰
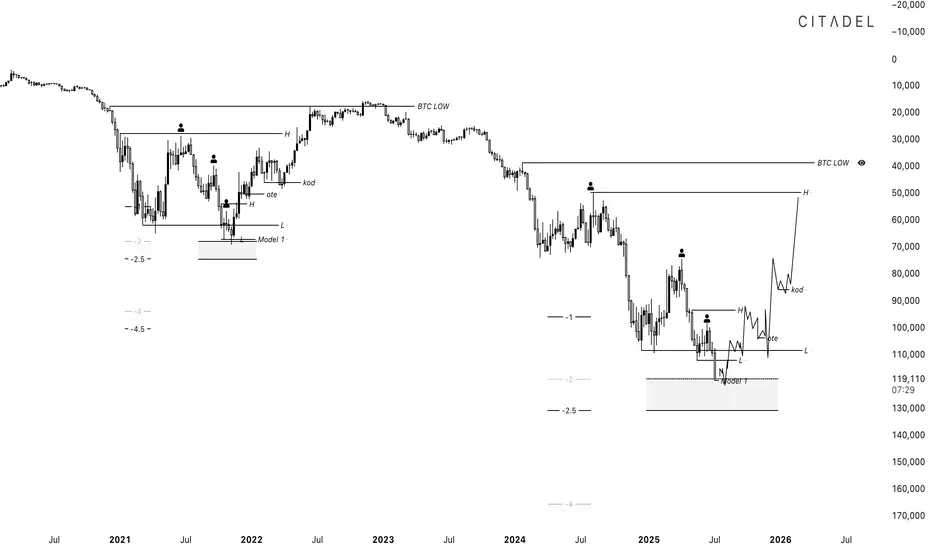
top in november and bottom early 2027?top in november and bottom early 2027?
I market out the exact top on the weekly
and exactly 364 days after that that was the exact weekly candle bottom in the bearmarket
and after 1064 days after the bottom that was the approximate top
would bring us to a top in november and bearmarket bottom early 27

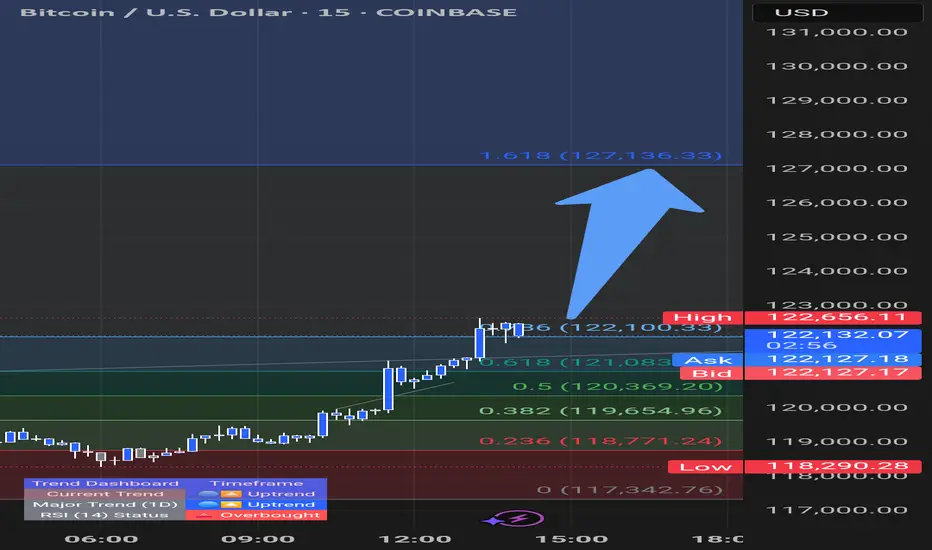
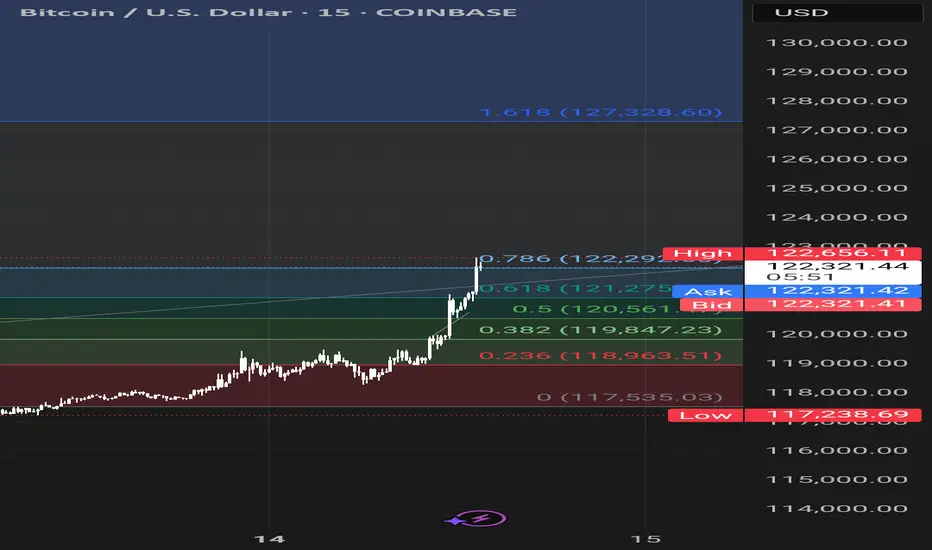
Bearish reversal off Fibonacci confluence?The Bitcoin (BTC/USD) is rising towards the pivot and could reverse to the 1st support which is a pullback support.
Pivot: 121,983.11
1st Support: 112,086.50
1st Resistance: 128,114.70
Risk Warning:
Trading Forex and CFDs carries a high level of risk to your capital and you should only trade with money you can afford to lose. Trading Forex and CFDs may not be suitable for all investors, so please ensure that you fully understand the risks involved and seek independent advice if necessary.
Disclaimer:
The above opinions given constitute general market commentary, and do not constitute the opinion or advice of IC Markets or any form of personal or investment advice.
Any opinions, news, research, analyses, prices, other information, or links to third-party sites contained on this website are provided on an "as-is" basis, are intended only to be informative, is not an advice nor a recommendation, nor research, or a record of our trading prices, or an offer of, or solicitation for a transaction in any financial instrument and thus should not be treated as such. The information provided does not involve any specific investment objectives, financial situation and needs of any specific person who may receive it. Please be aware, that past performance is not a reliable indicator of future performance and/or results. Past Performance or Forward-looking scenarios based upon the reasonable beliefs of the third-party provider are not a guarantee of future performance. Actual results may differ materially from those anticipated in forward-looking or past performance statements. IC Markets makes no representation or warranty and assumes no liability as to the accuracy or completeness of the information provided, nor any loss arising from any investment based on a recommendation, forecast or any information supplied by any third-party.

BITCOIN 2025 - THE LAST HOPECRYPTOCAP:BTC currently finds itself at the intersection of geopolitical tensions and broader macroeconomic uncertainty. Although traditionally viewed as a hedge against systemic risk, it is presently exhibiting characteristics more aligned with high-risk assets. The FED's forthcoming policy decisions will likely play a pivotal role in determining whether Bitcoin stabilizes or experiences further downward pressure.
The chart represents the most optimistic scenario for Bitcoin to date

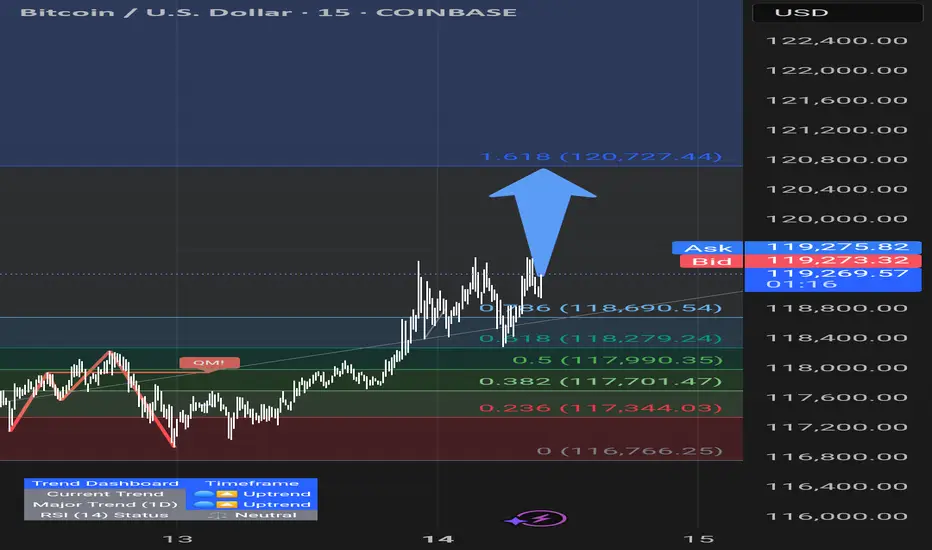
Bitcoin: 3 Of 5 Sub Waves In, Two To Go.Bitcoin not only reached my 113K profit objective, it blew right through it and is now closing in on the 120K objective. I have been writing about this Wave 5 formation for weeks now. 3 sub waves can be counted in the current move, which means Wave 4 retrace and then one more leg higher which can put price anywhere above 120K. Whole numbers, especially every 10K points, like 130K, 140K, etc. serve as psychological reference points. The main thing to keep in the forefront of your mind is once the 5th wave completes, the probability of a BROAD corrective move becomes highly likely.
This move largely has to do with the combination of the effects of the U.S. tariffs and a declining faith in the U.S. dollar. Either way, the reasons do not matter. What matters is the RISK. Wave counts are a measure of emotion in the market and have nothing to do with fundamental drivers. 5th Waves usually represent the situation where the market becomes saturated on one side (all the buyers have bought for now etc.). While the market can still continue higher for irrational reasons, 5th Waves mean it becomes highly vulnerable to bearish catalysts which can suddenly come out of nowhere.
My Trade Scanner Pro called a long two weeks ago which reached its profit objective on this time frame. There have been multiple opportunities to participate on smaller time frames for swing trades and plenty of day trade signals. As Bitcoin continues to complete this 5th Wave, it is best to avoid new investments at these levels because of the risk, and just trade the price action. As for investors, there is no reason to take profits YET, in terms of sell signals, but watch for large reversal candles around 120K, 125K or 130K. The LEVEL and the CONFIRMATION is what should help in your decision to lock something in.
Thank you for considering my analysis and perspective.

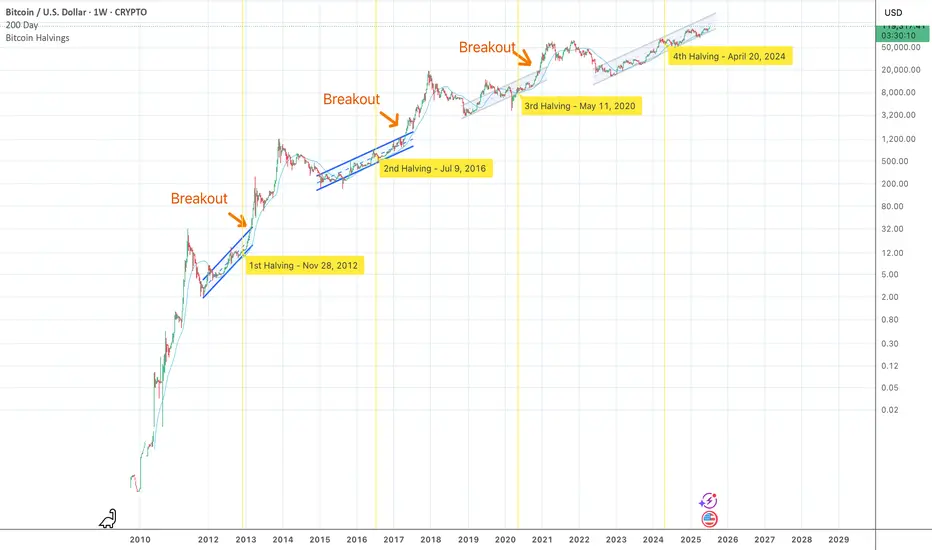
Bitcoin Still in Up-Trend Channel, Bubble Still AheadAs of July 2025 Bitcoin trades near $120 000 and every weekly close since the November 2022 low has stayed inside the same rising log-channel. The channel’s upper rail is ≈ $170 000 today and should reach ≈ $230 000 by December. A decisive breakout requires a weekly close above that rail. In previous cycles the breakout came almost exactly at the prior all-time high, but this time the 2021 ATH of $69 000 was reclaimed while price was still inside the channel. The trigger is therefore less obvious; yet if price finally closes beyond the rail, a new exponential leg is expected to begin.
Two structural shifts explain the delay. First, the channel’s slope keeps flattening: early cycles rose about 0.6 % per day on a log scale, now it is roughly 0.15 %. Second, each order-of-magnitude move demands vastly more capital, so the supply squeeze after the April 2024 halving is taking longer to translate into price.
At past tops growth multiples fell from 36× (2013) to 16× (2017) to 3.5× (2021). Extending that trend points to roughly 1.5–2× from the future breakout price. If the breakout happens near $170 000–230 000 the projected new ATH lands around $250 000–360 000, a range that lines up with the red-orange band on the updated Bitcoin Rainbow Chart.
Historically peaks follow a breakout by 9–13 months and the halving by 16–20 months, placing the most probable time window in Q4 2025. Until the weekly candle settles above the channel roof Bitcoin remains in accumulation mode and the classic blow-off phase is still ahead.
#LetsRideThePeak BTC ₿₿I checked my old BTC forecast and realized that Bitcoin has been following it loosely.
There's a clear pattern emerging that might surprise everyone very soon. In the coming days, I’ll post a long-term BTC analysis and add it to the toolkit.
