Bitcoin’s 486-Day Halving Blueprint: The $200,000 Blowoff?Summary
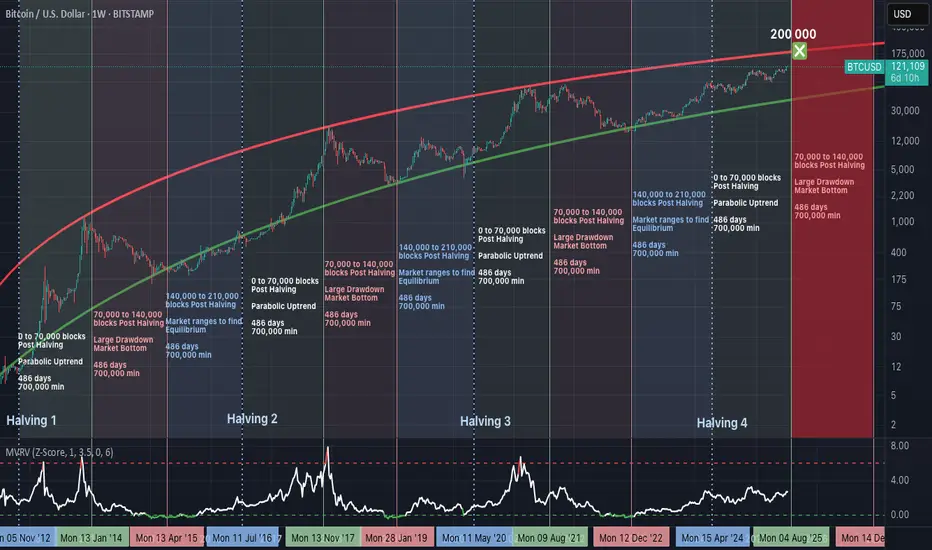
Bitcoin’s price consistently follows a 3-phase structure after each halving, with ~486 days per phase. If history repeats, we are nearing the end of the parabolic phase, with a potential peak around $200,000, before entering a structured drawdown.
Halving Cycles: The Real Clock Behind Bitcoin
Bitcoin’s monetary policy is pre-programmed.
A halving occurs approximately every 210,000 blocks (~4 years), and market behaviour after each halving follows this repeating pattern:
Phase 1: Parabolic Rally (0 to 70,000 blocks post-halving).
Phase 2: Major Drawdown (70,000 to 140,000 blocks).
Phase 3: Equilibrium Phase (140,000 to 210,000 blocks).
Each phase lasts approximately 486 days, and this structure has repeated reliably since 2012.
Phase 1: The Parabolic Rally (Current Phase)
We are currently in the growth segment of the cycle:
Price rising rapidly.
Miner profitability at highs.
Hashrate and network security increasing.
MVRV Z-Score steadily climbing, but not yet overextended.
Roughly 700,000 BTC are mined during this period, creating a supply shock as issuance is halved while demand accelerates.
Phase 2: The Drawdown (Expected Next)
Historically begins between block 70,000 to 140,000 post-halving.
Market peaks and begins to correct.
Miner margins compress.
Hashrate may plateau or decline.
Forced selling and miner capitulation drive volatility.
Price retraces significantly from the peak.
This phase resets the market and eliminates unsustainable excess.
Phase 3: The Equilibrium Phase
Occurs between block 140,000 to 210,000 post-halving.
Price enters consolidation.
Realized value and market price converge.
Ideal accumulation period for long-term investors.
Network fundamentals stabilize ahead of the next halving.
This phase is critical in building the base for the next cycle.
MVRV Z-Score: Market Thermometer
The chart includes the MVRV Z-Score, a key metric showing how far price deviates from realized value:
Readings above 6.0 have consistently marked cycle tops.
Readings near or below 0 have marked major bottoms.
Current value is around 2.67 — indicating a rising trend, but not overheated.
This metric reflects market-wide profitability and speculative pressure.
Why $200,000 Is in Sight
The projected resistance curve on the chart suggests that:
$200,000 aligns with the top of the long-term parabolic channel.
It corresponds with the expected end of the parabolic phase (Q1–Q2 2026).
It fits prior extension patterns following each halving.
It is a strong psychological target, likely to trigger heavy profit-taking.
This price level is not arbitrary—it is derived from the same structure that defined previous peaks.
What Comes After
If the historical cycle structure remains intact:
The peak should occur before mid-2026.
A deep correction phase follows, likely into 2027.
True bottoms tend to occur as miner capitulation concludes and difficulty adjusts downward.
This is where conviction and preparation matter most.
Final Thoughts
Bitcoin cycles are not random. They are structured around block height, issuance, and miner economics.
Every cycle since 2012 has followed this 486-day framework, divided across parabola, crash, and reset. This model has outperformed calendar-based predictions and technical narratives.
Disclaimer
This content is for educational and informational purposes only and does not constitute financial, investment, or trading advice. Past performance is not indicative of future results. Always do your own research and consult with a qualified financial advisor before making investment decisions. The author holds no responsibility for any losses incurred as a result of using the information presented herein.
BTCUSD.P trade ideas
BTCUSD : b-e-c-a-r-e-f-u-lMaybe price is just trying to buy back what was sold previously.
Of course, now at a higher price.
By the look of it, there isn't any new 'supply'.
Do you think price can move higher if there is NO supply - no one 'selling'?
Good luck.
Bitcoin Ascends into the Clear Sky: Structural Break Confirmed.⊣
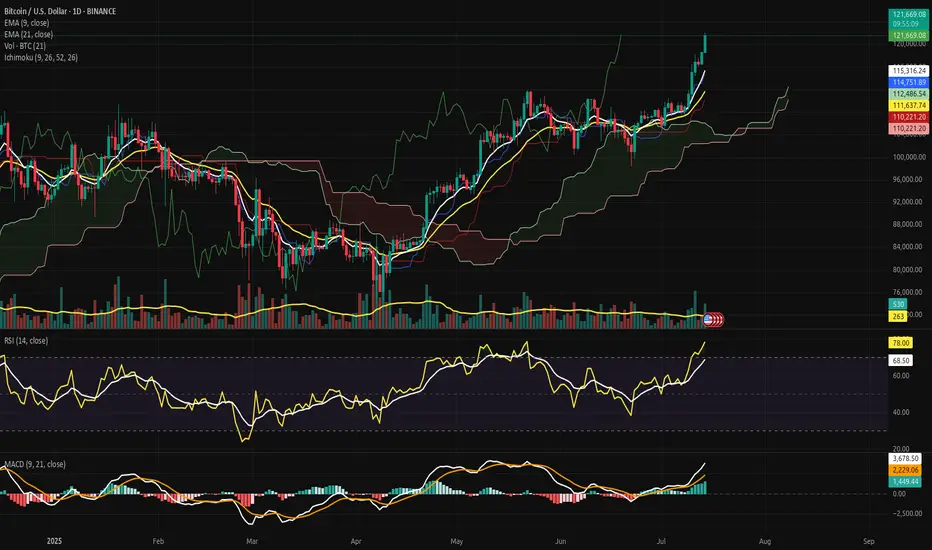
⟁ BTC/USD - BINANCE - (CHART: 1D) - (Jul 14, 2025).
◇ Analysis Price: $121,662.29.
⊣
⨀ I. Temporal Axis - Strategic Interval - (1D):
▦ EMA9 - ($115,313.08):
∴ The EMA9 is aggressively sloped upward, serving as dynamic support during the latest expansion phase.
✴️ Conclusion: Bullish control confirmed; momentum is guided tightly by the EMA9 anchor.
⊣
▦ EMA21 - ($111,636.30):
∴ EMA21 remains positively inclined, acting as a structural trend base beneath price and volume clusters.
✴️ Conclusion: Market remains structurally sound as long as price stays above the 21-day mean.
⊣
▦ Volume + EMA21 - (Volume: 497.79 BTC - EMA21: 262 BTC):
∴ Volume surge surpasses the rolling average, confirming institutional participation and breakout legitimacy.
✴️ Conclusion: Volume expansion validates price movement - no signs of divergence or exhaustion detected.
⊣
▦ RSI + EMA9 - (RSI: 77.99 - EMA9: 68.49):
∴ RSI has entered overbought territory, yet its trajectory remains upward and wide above its smoothing band.
✴️ Conclusion: Bullish momentum sustained; overbought conditions not yet reversing.
⊣
▦ MACD - (9, 21, 9) + EMA's smoothing:
∴ MACD: 3,271.60 | Signal: 2,013.81 | Divergence: +1,257.79;
∴ The MACD line is expanding positively over its signal, confirming momentum acceleration.
✴️ Conclusion: Technical conviction favors bullish continuation; signal remains clean and unsaturated.
⊣
▦ Ichimoku Cloud - (9, 26, 52, 26):
∴ Price is decisively above the Kumo cloud - “Clear Sky” territory;
∴ Senkou Span A = 121,653.30 | Senkou Span B = 112,486.54;
∴ Tenkan and Kijun lines are sharply elevated, confirming trend authority.
✴️ Conclusion: Zero resistance above; cloud projection supports further upward development.
⊣
🜎 Strategic Insight - Technical Oracle:
∴ All indicators are aligned in a rare harmonic convergence, signaling trend expansion with no current topping structure;
∴ Market shows the behavior of an advanced impulse wave entering Phase II expansion;
∴ Strategic play remains bullish - pullbacks, if any, should be shallow and fast.
⊣
𓂀 Stoic-Structural Interpretation:
∴ Structurally Bullish – Tactically Advancing
⊢
⧉
Cryptorvm Dominvs · ⚜️ MAGISTER ARCANVM ⚜️ · Vox Primordialis
⌬ - Wisdom begins in silence. Precision unfolds in strategy - ⌬
⧉
⊢
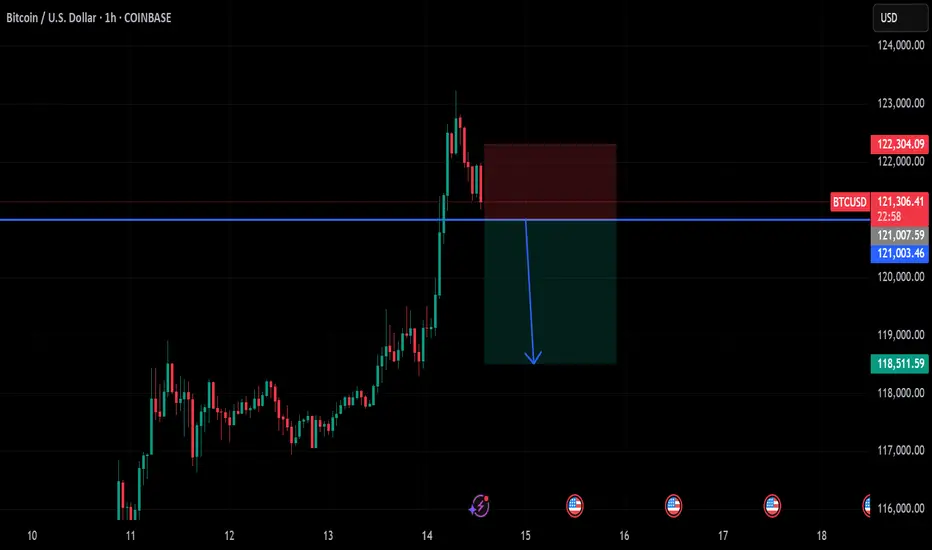
btc on sell below 121k#BTCUSD price now on reverse, expected entry below 121k on H1 closure.
Target 118500, Stop loss 122300. First short TP at 120500 for possible reverse on buy.
Bullish can take place if the H1 doesn't close below the sell entry, any breakout above 123k again will reach 125k.
BTC/USD BUY OPPORTUNITY We’re looking at the market structures BTC is making from the M15 timeframe and we can spot a nice buy opportunity around the 38.2% fibo retracement of the recent impulse like pattern created in H4 I still believe price is going to trade bullish up onto $123419 A buy opportunity is envisaged from the current market price.

BTC TOP AND BEARISH AND CONTUNITY PREDICTION This chart is purely based on technical analysis. The RSI is still not oversold on the monthly chart, which means there might be a little more upside to this. But from the trendline, a serious reversal appears due. I could be wrong, but we'll all see. Profit taking may commence bit by bit.
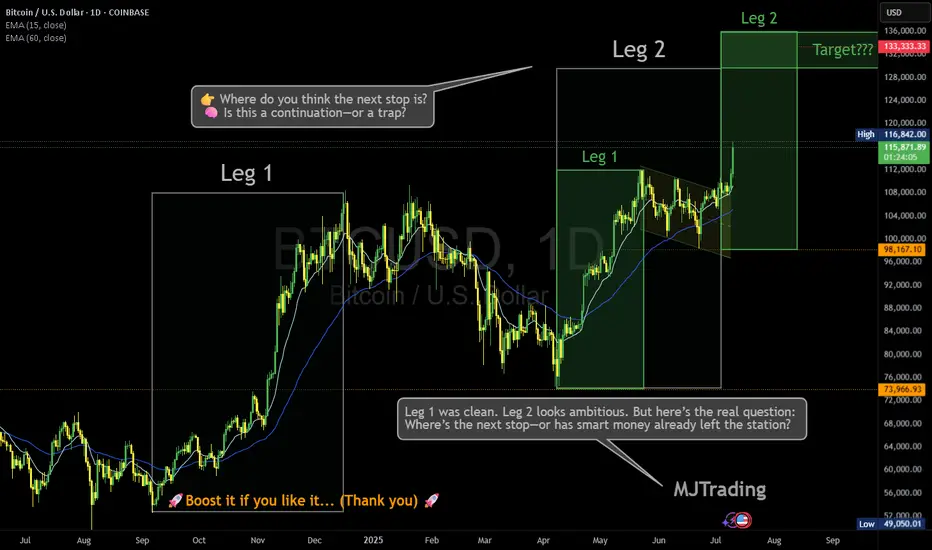
Where is the next stop? 133,333?Leg 1 was clean. Leg 2 looks ambitious. But here’s the real question: Where’s the next stop—or has smart money already left the station?
BTC just sliced through both EMAs with conviction, now hovering above $116K. Volume’s decent, sentiment’s euphoric… but is this rally genuine markup, or a cleverly disguised distribution phase?
🔍 Price targets like $133K are seductive—but what if consolidation isn’t horizontal anymore?
Vertical consolidation is real. And it’s where retail gets baited hardest.
📊 Leg 2 might still play out—but don’t ignore the possibility that this is the final markup before a liquidity sweep.
👉 Where do you think the next stop is? 🧠 Is this a continuation—or a trap?
Drop your guess...
Who has entered here:?
Who can let the winners run in this situation:
#MJTrading #ATH
#Bitcoin #BTC #CryptoTrading #SmartMoney #MarketStructure #WyckoffMethod #LiquiditySweep #DistributionPhase #TechnicalAnalysis #TradingView #CryptoChart #PriceAction #EMA #Consolidation #CryptoStrategy #TrendReversal #CryptoCommunity
Bitcoin hits second target MacroBitcoin just hits second target, Volume is getting smaller, could indicate that buyers are weakening. We should keep an eye, maybe a corection is soon to be seen.
$BTC - Bitcoin Elliot Wave Analysis UpdateHello fellow gamblers,
Bitcoin hit my target zone and we could now see a retracement for Wave 4 or a bullish continuation into ATH.
I am also bringing a new update on Bitcoin and showing you all an alternative count that could take us way above our current targets.
- If we do have a Wave 4 retracement, I'm expecting price to find support at that 116.7k level.
- Levels to watch: 116.7k, 112k-110.4k

Bitcoin may make correction movement to support levelHello traders, I want share with you my opinion about Bitcoin. Price recently printed a new ATH at 118800 points and then began to show signs of correction. Before this breakout, the price was stuck in a long downward channel, where it bounced inside the buyer zone (103000–103800) several times and reversed upward. After the final breakout, BTC entered a range phase between the support level (103800) and the support area (110300–111300), building energy before the massive move. Once the price escaped this range, a strong impulse up followed, pushing BTC above all major levels and reaching a new high. However, after hitting the ATH, the price started to stall and consolidate. Currently, we can see signs of weakness at the top — the structure is forming lower highs and looks unstable, which may indicate a potential retracement. Now the price is trading above the support area, but I expect a corrective move back toward the current support level at 110300. This level aligns with the top of the previous range and now acts as strong demand. That’s why I’ve set my TP at 110300 level — right at the beginning of potential buyer interest. Please share this idea with your friends and click Boost 🚀
Disclaimer: As part of ThinkMarkets’ Influencer Program, I am sponsored to share and publish their charts in my analysis.

Balla is still Bullish on BITCOIN. Cup & Handle pattern. The trend is still our friend.
I still see bullish developments in the price action.
We must have patience.
Dips still must be bought.
The plan hasn't changed.
We still aiming for that time period of 9 -15 months post #BTC Halving.
We are only one month down :)

SellTrend Line Break
Previous Day Volume
Rejection Point
Untapped Order Point
London Session
High Structure Swing
BTC CME Bearish GAPA gap to be filled in the Bitcoin CME Future at 114,000
Break of 120500 will open the door for 118,000 then 114,000 next.
I reckon buyers will pop-in near 114,000

BTC Massive SetupConsolidation for months between 91k and 106k
- Classic Wyckoff setup as an accumulation/distribution
- Price targets of: 121.878 (122k is the popular target) to the upside with 75,827 on the down
- Saylor today put out news to be raising another $2 billion to buy BTC. Either he is going to be able to hold the floor or get washed out
- Trade can be taken with confirmation of breakout on either side pretty easily as momentum will be so strong that being on the wrong side will most likely be an immediate stop out

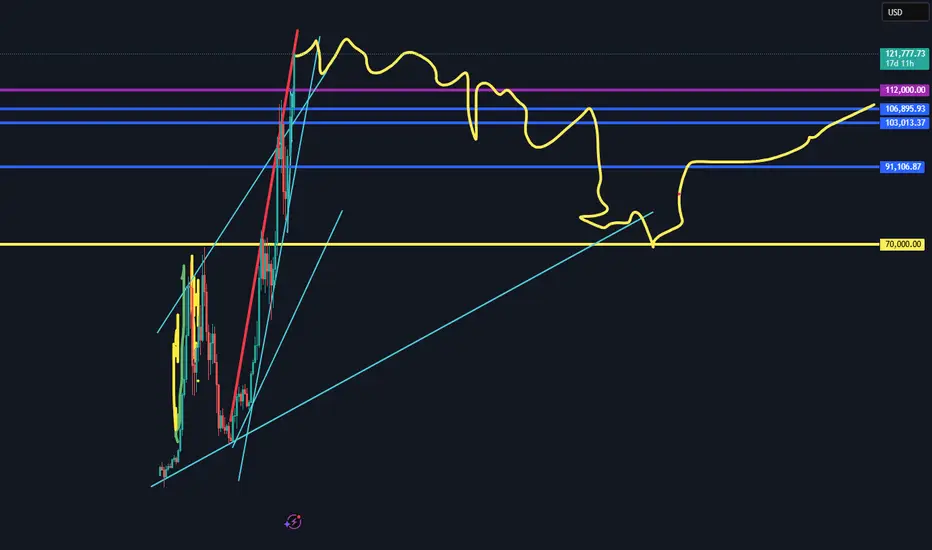
Bitcoin Price Prediction and TimelineThe Chart clearly shows everything. 100 days remain until the top. about 240000-260000

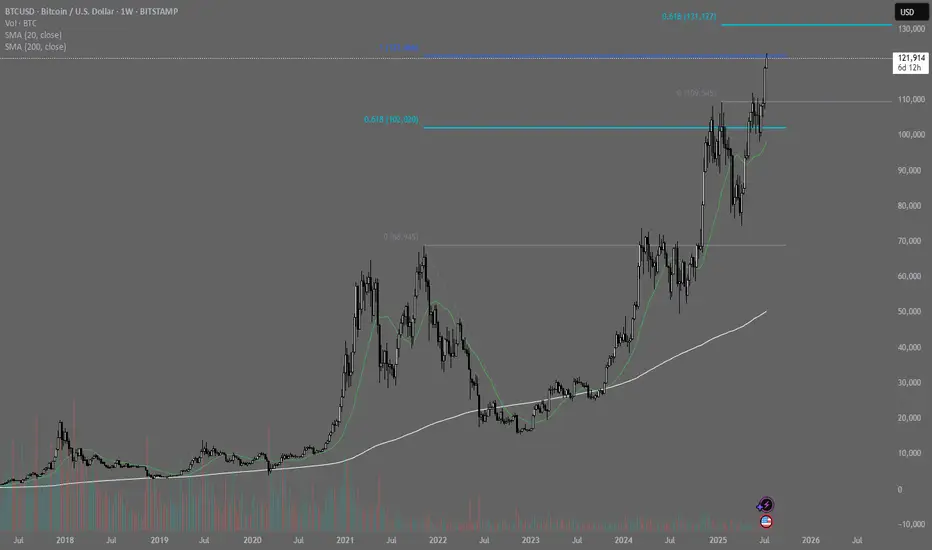
Bitcoin's Blue SkyBitcoin just closed another weekly candle near its highs – and this one confirmed what the last few were hinting at: the bulls are fully in charge. Price exploded through the \$112,000 resistance level, turned it into support, and barely looked back. The move wasn’t subtle either – it was loud, confident, and backed by a strong candle with virtually no upper wick. That tells you all you need to know: there’s no hesitation here, just buyers pushing price higher. If this were a poker game, Bitcoin just went all-in on momentum, and no one at the table seems brave enough to call its bluff.
Even more impressive is how clean the breakout structure looks. After consolidating under \$112K for weeks, BTC finally made its move, leaving behind a textbook support/resistance flip. As long as that zone holds, the path of least resistance is clearly up. There’s no major historical resistance overhead, which means we’re officially in price discovery – that magical place where technicals matter less and raw sentiment takes the wheel. The music is playing, and Bitcoin’s dancing like no one’s watching.
Volume has been quietly rising, even if it’s not screaming just yet. That’s a sign of real interest – not a frenzy, but sustained institutional nibbling and long-term conviction. The 50-week moving average is lagging far behind (hovering somewhere in the \$80K range), which tells you how strong this trend really is. That line’s not catching up anytime soon – it’s gasping for air while price is sprinting ahead.
Could we get a pullback? Sure. That’s always on the table. But unless BTC fumbles back below \$112K, the bulls aren’t just in control – they’re rewriting the rules. Next major psychological zones are \$125K, \$130K, and \$135K, and with each passing week, they’re looking less like distant targets and more like stepping stones. Buckle up.

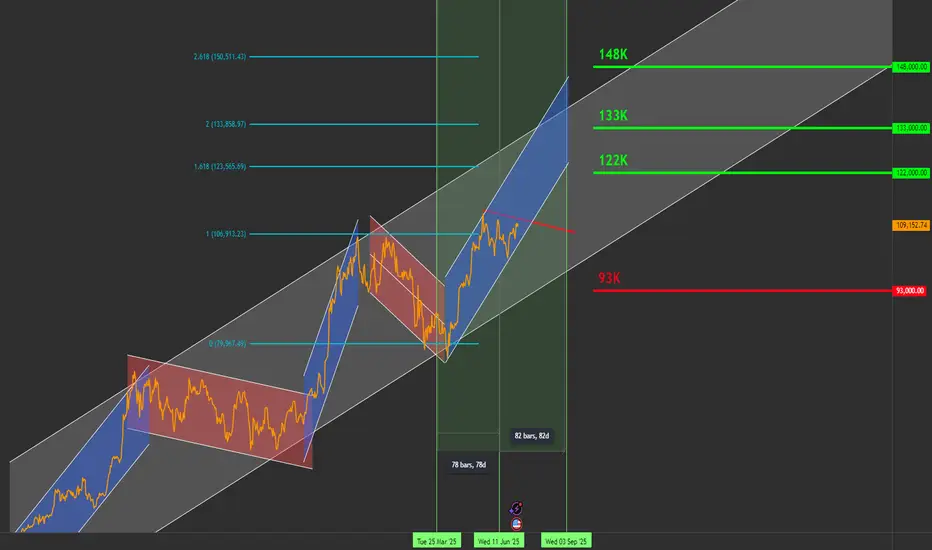
Bitcoin Roadmap to $144K by September – Daily Chart Breakout SetHello traders,
I'm sharing my current outlook on Bitcoin using the daily timeframe. Price is ~109K below a key descending trendline (in red), which has defined the structure since 21 May.
🔍 Key Levels to Watch:
Resistance: $111,000
Support: $91,000
Current Price: ~$109,000
⚡ Breakout Scenario:
If Bitcoin closes above $111K on the daily chart, backed by strong volume (ideally 30% above the 20-day average), I expect the next targets to unfold as:
✅ $122,000
✅ $133,000
✅ $144,000
🗓️ Target date for $144K: Around 22 September 2025
This projection is based on a pivot structure I’m tracking:
🟢 25 March 2025: Pivot low at ~$84K
🔴 12 June 2025: Pivot high
🟡 Expected pivot high: ~4 September 2025 (if symmetry holds)
This pattern suggests a 1-2-3 formation that could lead to a breakout move.
🧯 Failure Scenario:
If BTC fails to break out, I’m watching for a pullback toward the $91K support zone.
🛑 Current Stance:
I’m not in a position yet. Waiting for a daily candle close above $111K with volume confirmation and momentum indicators.
📣 Stay Updated
I’ll be sharing daily updates as the price action evolves.
Follow me here on TradingView, and feel free to share your analysis or ask questions in the comments!
🏷️ Hashtags:
#BTCUSD #BitcoinAnalysis #CryptoTrading #BTC #TechnicalAnalysis #SwingTrade #BreakoutSetup
Let me know your comments.
BITCOIN High after High going for the Cycle Top!Bitcoin (BTCUSD) made a new All Time High (ATH) today, just north of $123000 and shows absolutely no signs of stopping there!
The brilliantly structured 2.5-year Channel Up (blue) that has been dominating the entirety of the current Bull Cycle since the November 2022 market bottom, has been on its latest Bullish Leg since the April 07 2025 rebound on the 1W MA50 (blue trend-line).
The 1W MA50 has been the Cycle's natural Support level since the March 13 2023 bullish break-out, never broken after, just like it has been for the 2019 - 2021 Bull Cycle (excluding of course the Black Swan event of the March 2020 COVID crash).
In fact the similarities of the whole 2022 - 2025 Cycle are strong with the 2018 - 2021 Cycle. Similar Bear Cycles of -80% on average, followed by strong Lower Highs break-outs and subsequent consolidations within the 0.786 - 0.618 Fibonacci range, takes us to today with the April 2025 1W MA50 bounce resembling the July 2021 one.
Eventually, that Bullish Leg led to the Cycle's Top a little above the 1.618 Fibonacci extension. The market seems to be only one step away of completing that past pattern and if it does, BTC may hit $170000 before the Cycle peaks.
Do you think that is a likely scenario after today's new fresh ATH? Feel free to let us know in the comments section below!
-------------------------------------------------------------------------------
** Please LIKE 👍, FOLLOW ✅, SHARE 🙌 and COMMENT ✍ if you enjoy this idea! Also share your ideas and charts in the comments section below! This is best way to keep it relevant, support us, keep the content here free and allow the idea to reach as many people as possible. **
-------------------------------------------------------------------------------
💸💸💸💸💸💸
👇 👇 👇 👇 👇 👇

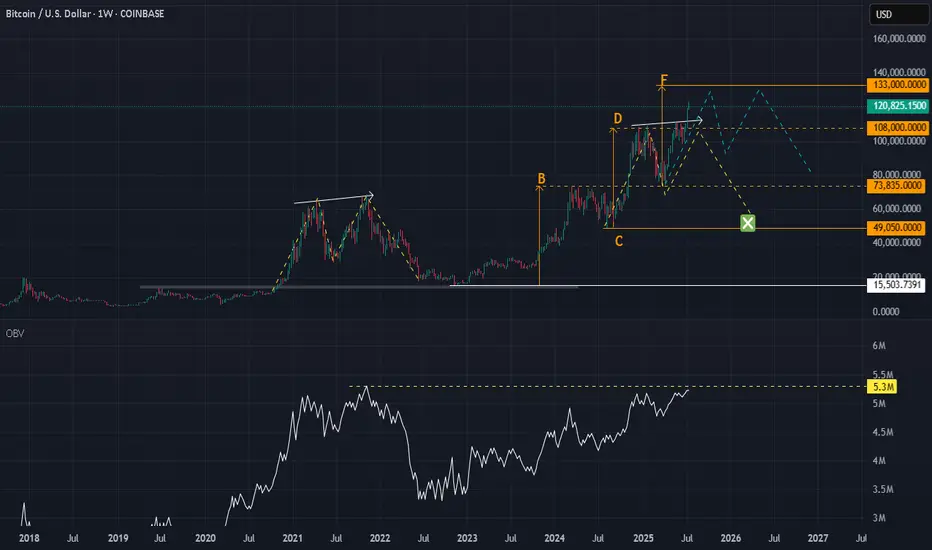
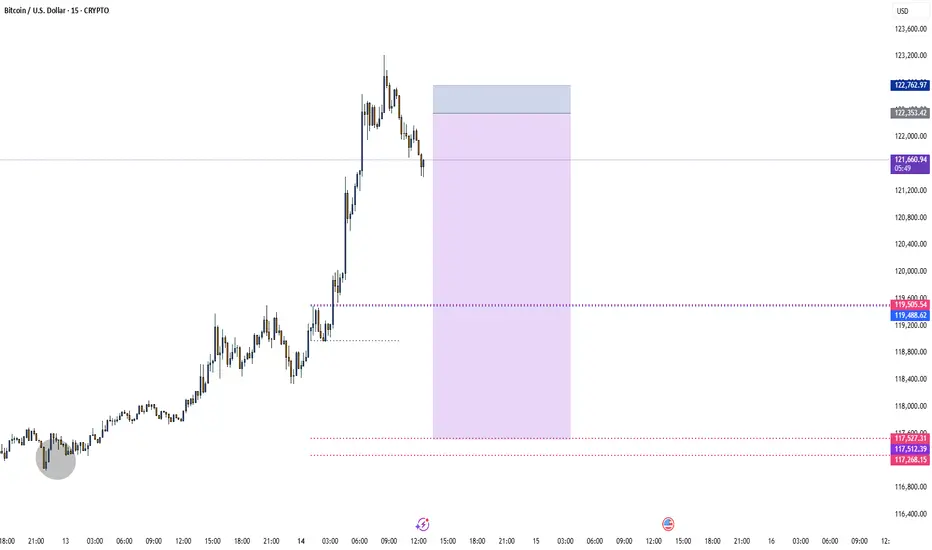
Bitcoin (BTC): Targeting $140K | Our ATH for This Bullish Cycle$120K was broken too easily, and we are now setting our new ATH to $140K, which will be our last target and local top before entering into a bearish market.
Now, as we recently had a strong break of structure that was not retested properly (meaning buyers have not secured this area), combined with the RSI being in the overbought zone, we might see some pullback happening anytime from here so keep an eye out for it.
About RSI, our yellow line is still in the neutral area, and we see the demand and buyside volume growing, so we are going to look for that line to also enter into overbought zones before looking for potential selloffs.
Swallow Academy
Rally! : My Target in Sight, and It’s Only a Matter of TimeInverted Head&Shouldres -- Breakout -- Double top -- Retest Neckline -- BOOM !!

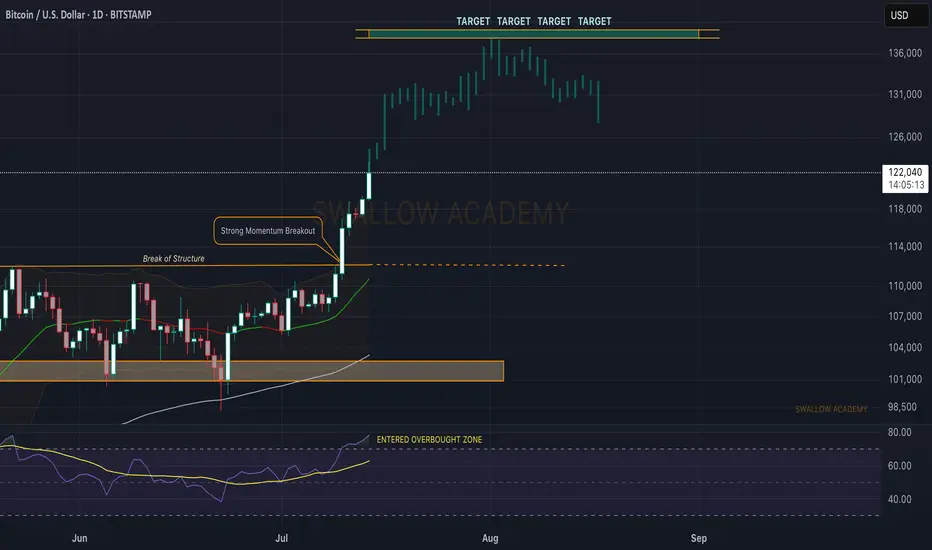
Bitcoin Update – Textbook Patterns Playing OutIn last week’s Bitcoin idea, I highlighted a key technical setup: price retested the neckline of a massive inverted Head & Shoulders pattern and launched a strong move upward. Let’s dive into what’s unfolding on the daily chart.
We’re seeing classic Wyckoff consolidation behavior—appearing right before the breakout and again after the neckline retest. Multiple smaller Head & Shoulders patterns have also formed and hit their targets cleanly.
The Volunacci pattern came alive after a precise bounce from the Golden Zone, adding more fuel to the bullish narrative.
Next major level in focus: $120K. Will Bitcoin reach it? Let the market decide.

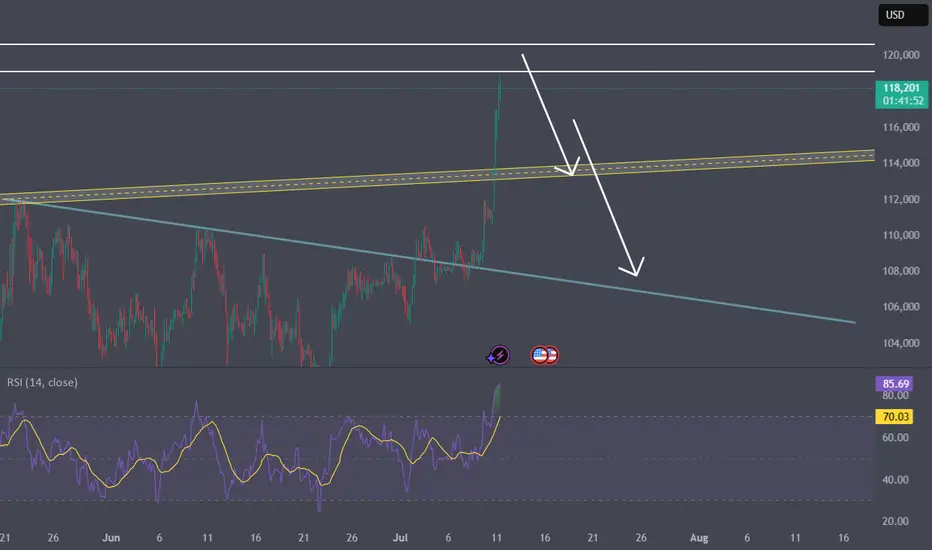
Are you falling for 141k?The bull run on BTCUSD was not sudden, it corrected properly making a flat from 98K and breaking out the structure. this upward impulse looks too sharp to peirce 120-122k range its 1.618 fib extension of the broken structure.
Be cautious with the sell though, any rejection followed by a bear flag could be a great short with Stop above the top.
Good luck.
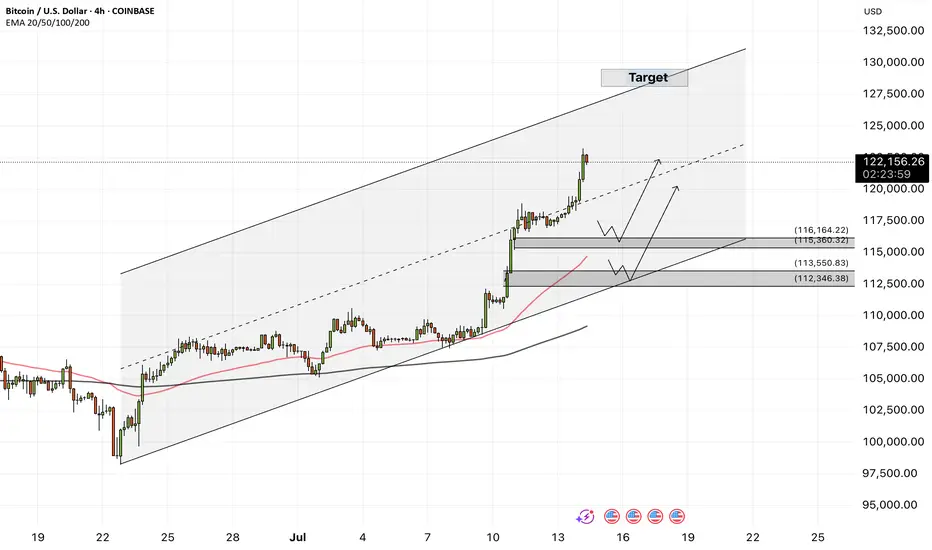
Bitcoin - Bitcoin, Unrivaled in the Market!Bitcoin is above the EMA50 and EMA200 on the four-hour timeframe and is in its ascending channel. Bitcoin’s current upward momentum has the potential to reach the target of $130,000. If it corrects, Bitcoin buying opportunities can be sought from the specified demand zones.
It should be noted that there is a possibility of heavy fluctuations and shadows due to the movement of whales in the market and compliance with capital management in the cryptocurrency market will be more important. If the downward trend continues, we can buy within the demand area.
In recent days, Bitcoin has managed to set a new historical high by crossing the $118,000 level; a jump that followed the strong accumulation of institutional capital, the upward trend of spot ETFs and the remarkable consolidation of such indices. This growth is not only the result of technical conditions or short-term market excitement, but is a clear reflection of the structural maturity of the Bitcoin ecosystem in the second half of 2025. A careful and comprehensive examination of the fundamental parameters shows that Bitcoin is moving differently than in the past: slower, but with much stronger support. On the other hand, more than $205 million in Bitcoin short selling positions have been liquidated following the jump in the price of Bitcoin and its crossing the $122,000 level.
First, the flow of investment from Bitcoin spot ETFs has broken records over the past week. In one day, more than $1.18 billion entered these funds, and the total annual inflow of these financial instruments has reached more than $51 billion. This is while ETFs such as IBIT (managed by BlackRock) and FBTC (managed by Fidelity) are attracting hundreds of Bitcoins daily, without causing any negative divergence in price indices. This phenomenon clearly shows that the participation of institutional investors through regulated channels is not only stable, but also accelerating. Along with this flow of capital, the parameters of the chain also paint a picture of a market with a balance of supply and demand. The MVRV ratio, an indicator for measuring market profitability, fluctuates between 2.2 and 2.34, meaning that the market is in a reasonably profitable state, but is still some way from the warning zone of profit saturation. Meanwhile, long-term holders (LTHs) are also continuing to accumulate. Long-term wallet holdings have reached a record high of 14.7 million BTC, representing nearly 70% of the total supply. In the last quarter alone, more than 13,000 BTC have been added to this group’s reserves.
On the other hand, the SOPR indicator, which measures realized profit ratio, shows that profit-taking is taking place at a gentle slope in the market, away from heavy selling pressure. This logical trend of profit-taking is a testament to mature investor behavior. Bitcoin flows to exchanges are also at very low levels; Bitcoin held on exchanges now account for just 1.25% of the total supply—the lowest level in over a decade. This significant reduction in potential selling pressure has kept Bitcoin’s price stable in the face of short-term volatility.
Behaviorally, the market is also showing signs of maturation. The number of daily active addresses has remained stable, but unlike during the buying frenzy, we are no longer seeing retail traders rushing into exchanges or mass wallet outflows. In other words, on-chain activity has stabilized, similar to the behavior of traditional mature markets—markets driven by data and structure, not emotion. From a macro perspective, the outlook for Bitcoin in the medium term is also positive. Many analysts and institutions, including Global X ETFs, see Bitcoin’s growth to $200,000 within the next 12 months as achievable. Technical analysis from some sources has also outlined the $140,000 range as the next price target in the next 100 days, provided that the VIX volatility index remains low and macroeconomic data maintains its current trajectory. However, a more conservative scenario sees a price consolidation in the $95,000-$100,000 range if geopolitical pressures increase or ETF inflows weaken.
Overall, Bitcoin is moving ahead in the summer of 2025 not only on the back of crypto market excitement, but also on the back of strong fundamentals and structured institutional capital inflows. Accumulation by long-term holders, a steady decline in supply on exchanges, a reasonable profit-taking balance, and a formal investment structure via ETFs have all combined to bring the market to a stable state and ready for further increases. If this trend holds, levels of $125,000-$140,000 in the short term, and a range of $180,000-$200,000 by the end of the year, are not far off!
On the other hand, BlackRock’s Bitcoin ETF (IBIT) managed to record the fastest growth in history among all ETFs, surpassing $80 billion in assets in just 374 days! For comparison, it should be noted that the S&P500 Index ETF needed about 5 times this time! BlackRock now holds about 706,000 Bitcoins (equivalent to 56% of the total ETF share).