BTCUSD.P trade ideas
Inverted BTC tells the full storyahhh here we are again bulls with the same playbook late in the cycle. we will see 40k before 200k
$BTC 🚨 Bitcoin bullishness might be more than hype…
It could be a signal that investors are protecting assets inside liquidity pools, anticipating an interest rate cut soon. 💰
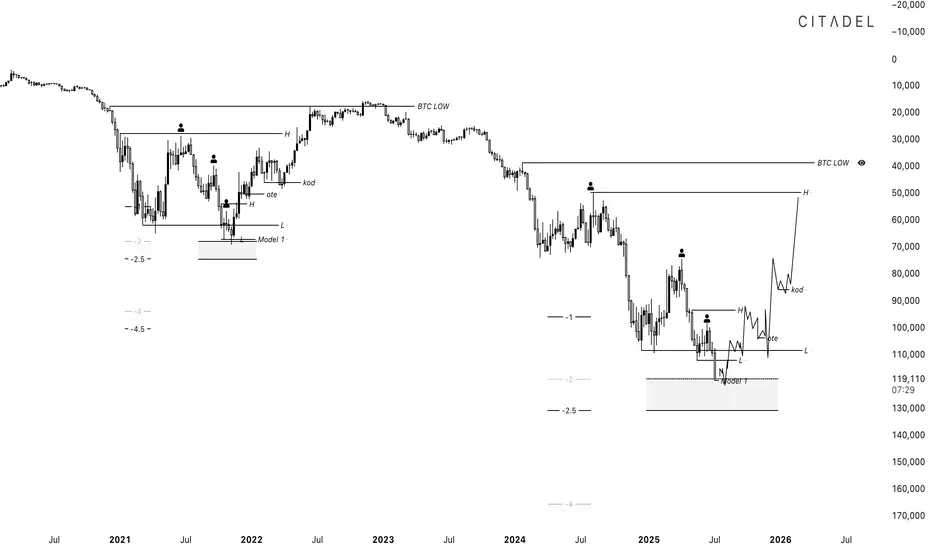
top in november and bottom early 2027?top in november and bottom early 2027?
I market out the exact top on the weekly
and exactly 364 days after that that was the exact weekly candle bottom in the bearmarket
and after 1064 days after the bottom that was the approximate top
would bring us to a top in november and bearmarket bottom early 27

Bearish reversal off Fibonacci confluence?The Bitcoin (BTC/USD) is rising towards the pivot and could reverse to the 1st support which is a pullback support.
Pivot: 121,983.11
1st Support: 112,086.50
1st Resistance: 128,114.70
Risk Warning:
Trading Forex and CFDs carries a high level of risk to your capital and you should only trade with money you can afford to lose. Trading Forex and CFDs may not be suitable for all investors, so please ensure that you fully understand the risks involved and seek independent advice if necessary.
Disclaimer:
The above opinions given constitute general market commentary, and do not constitute the opinion or advice of IC Markets or any form of personal or investment advice.
Any opinions, news, research, analyses, prices, other information, or links to third-party sites contained on this website are provided on an "as-is" basis, are intended only to be informative, is not an advice nor a recommendation, nor research, or a record of our trading prices, or an offer of, or solicitation for a transaction in any financial instrument and thus should not be treated as such. The information provided does not involve any specific investment objectives, financial situation and needs of any specific person who may receive it. Please be aware, that past performance is not a reliable indicator of future performance and/or results. Past Performance or Forward-looking scenarios based upon the reasonable beliefs of the third-party provider are not a guarantee of future performance. Actual results may differ materially from those anticipated in forward-looking or past performance statements. IC Markets makes no representation or warranty and assumes no liability as to the accuracy or completeness of the information provided, nor any loss arising from any investment based on a recommendation, forecast or any information supplied by any third-party.

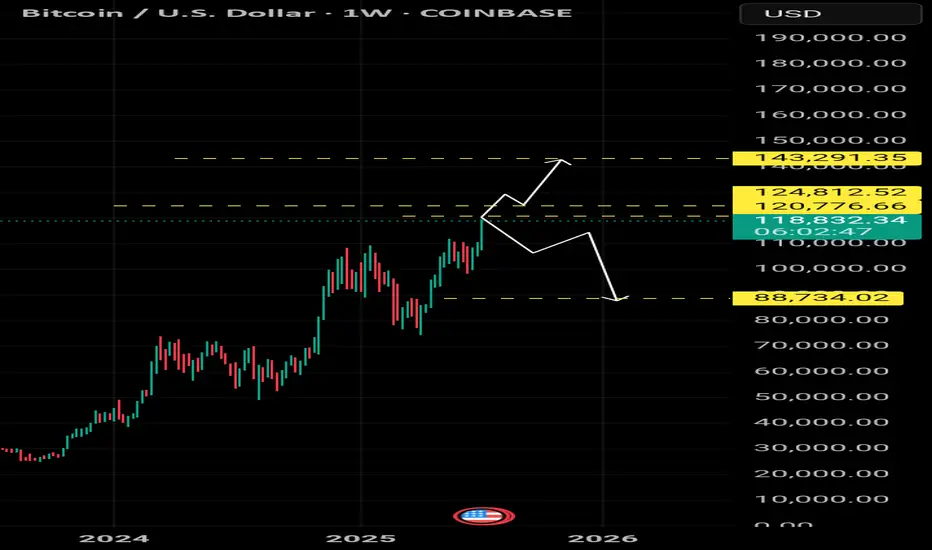
BITCOIN 2025 - THE LAST HOPECRYPTOCAP:BTC currently finds itself at the intersection of geopolitical tensions and broader macroeconomic uncertainty. Although traditionally viewed as a hedge against systemic risk, it is presently exhibiting characteristics more aligned with high-risk assets. The FED's forthcoming policy decisions will likely play a pivotal role in determining whether Bitcoin stabilizes or experiences further downward pressure.
The chart represents the most optimistic scenario for Bitcoin to date

Bitcoin: 3 Of 5 Sub Waves In, Two To Go.Bitcoin not only reached my 113K profit objective, it blew right through it and is now closing in on the 120K objective. I have been writing about this Wave 5 formation for weeks now. 3 sub waves can be counted in the current move, which means Wave 4 retrace and then one more leg higher which can put price anywhere above 120K. Whole numbers, especially every 10K points, like 130K, 140K, etc. serve as psychological reference points. The main thing to keep in the forefront of your mind is once the 5th wave completes, the probability of a BROAD corrective move becomes highly likely.
This move largely has to do with the combination of the effects of the U.S. tariffs and a declining faith in the U.S. dollar. Either way, the reasons do not matter. What matters is the RISK. Wave counts are a measure of emotion in the market and have nothing to do with fundamental drivers. 5th Waves usually represent the situation where the market becomes saturated on one side (all the buyers have bought for now etc.). While the market can still continue higher for irrational reasons, 5th Waves mean it becomes highly vulnerable to bearish catalysts which can suddenly come out of nowhere.
My Trade Scanner Pro called a long two weeks ago which reached its profit objective on this time frame. There have been multiple opportunities to participate on smaller time frames for swing trades and plenty of day trade signals. As Bitcoin continues to complete this 5th Wave, it is best to avoid new investments at these levels because of the risk, and just trade the price action. As for investors, there is no reason to take profits YET, in terms of sell signals, but watch for large reversal candles around 120K, 125K or 130K. The LEVEL and the CONFIRMATION is what should help in your decision to lock something in.
Thank you for considering my analysis and perspective.

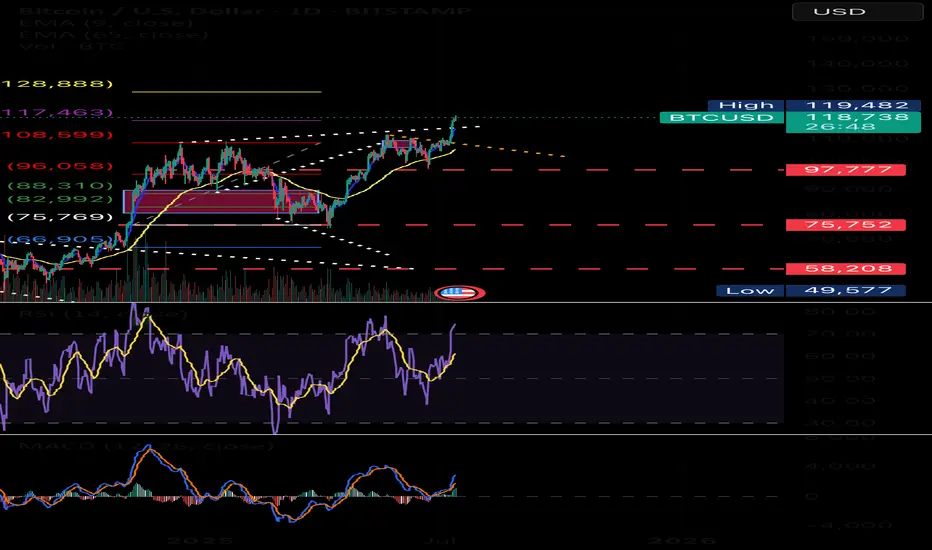
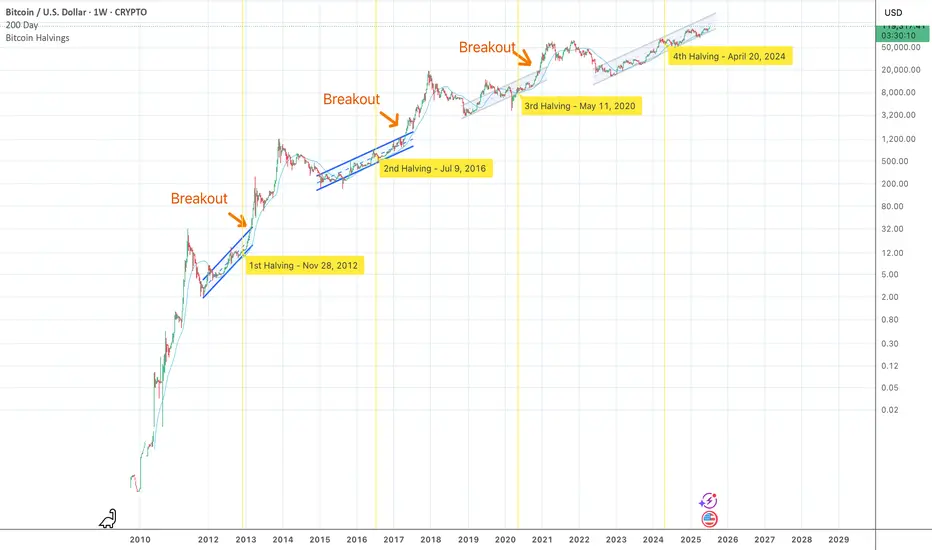
Bitcoin Still in Up-Trend Channel, Bubble Still AheadAs of July 2025 Bitcoin trades near $120 000 and every weekly close since the November 2022 low has stayed inside the same rising log-channel. The channel’s upper rail is ≈ $170 000 today and should reach ≈ $230 000 by December. A decisive breakout requires a weekly close above that rail. In previous cycles the breakout came almost exactly at the prior all-time high, but this time the 2021 ATH of $69 000 was reclaimed while price was still inside the channel. The trigger is therefore less obvious; yet if price finally closes beyond the rail, a new exponential leg is expected to begin.
Two structural shifts explain the delay. First, the channel’s slope keeps flattening: early cycles rose about 0.6 % per day on a log scale, now it is roughly 0.15 %. Second, each order-of-magnitude move demands vastly more capital, so the supply squeeze after the April 2024 halving is taking longer to translate into price.
At past tops growth multiples fell from 36× (2013) to 16× (2017) to 3.5× (2021). Extending that trend points to roughly 1.5–2× from the future breakout price. If the breakout happens near $170 000–230 000 the projected new ATH lands around $250 000–360 000, a range that lines up with the red-orange band on the updated Bitcoin Rainbow Chart.
Historically peaks follow a breakout by 9–13 months and the halving by 16–20 months, placing the most probable time window in Q4 2025. Until the weekly candle settles above the channel roof Bitcoin remains in accumulation mode and the classic blow-off phase is still ahead.
#LetsRideThePeak BTC ₿₿I checked my old BTC forecast and realized that Bitcoin has been following it loosely.
There's a clear pattern emerging that might surprise everyone very soon. In the coming days, I’ll post a long-term BTC analysis and add it to the toolkit.

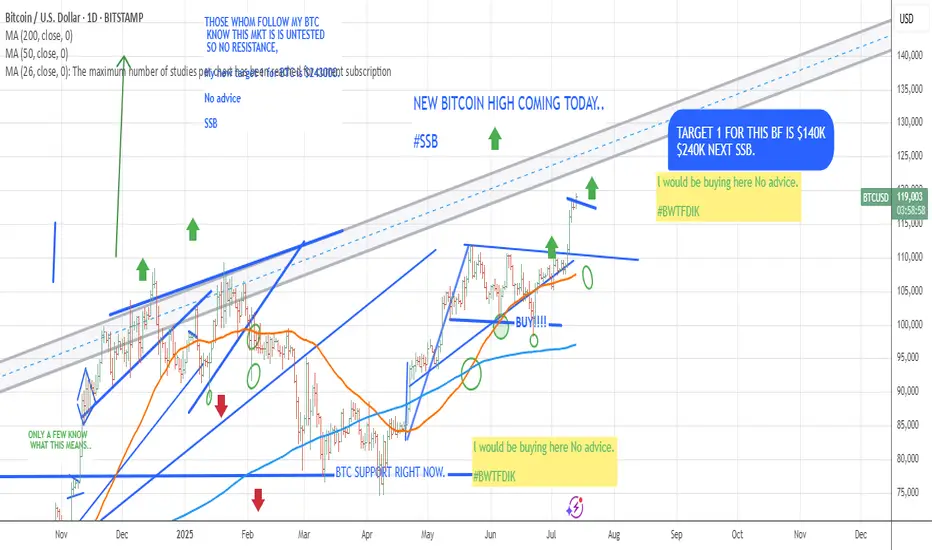
#BTC #BITCOIN $240K BITCOIN COMING PROBABLY WITHIN 3 MONTHS.
CHART speaks for itself for any following TA
BWTFDIK
SSB
uptrendThe upward trend is expected to advance to the specified resistance level. Then, there is a possibility of a trend change and the correction will begin.


Valtrix Group: Crypto Today – Bitcoin Explodes Toward $120,000The global cryptocurrency market continues to surprise: Bitcoin is confidently approaching the $120,000 mark, reinforcing the role of digital assets as an integral part of the global financial system.
Record Growth: What’s Behind Bitcoin’s New Surge?
Amid rising institutional interest, growing retail demand, and expectations of interest rate cuts in the U.S., Bitcoin is demonstrating impressive growth. Over the past few weeks alone, the cryptocurrency has surged by more than 20%, and Valtrix Group analysts believe the psychological threshold of $120,000 could be crossed in the near future.
Key drivers of this growth include:
Active institutional buying, including investment funds and major banks;
Reduced Bitcoin supply following this year’s halving;
Stabilizing regulatory environment in regions like the U.S., Europe, and Southeast Asia;
A shift by traditional investors into digital assets amid geopolitical instability and inflationary concerns.
How Is the Market Reacting?
Altcoins are also experiencing significant growth, following the market leader. Ethereum has surpassed $7,000, while tokens such as Solana and Avalanche have jumped more than 30% in a week.
Investors are increasing trading volumes and locking in profits, but interest in long-term HODL strategies is also on the rise. According to Valtrix Group, this is not just a short-term speculative wave, but a sustainable trend backed by strong fundamentals.
What’s Next? Forecast from Valtrix Group
Our analysts believe that Bitcoin could reach $125,000–$130,000 in the short term if the current momentum continues. However, we advise investors to proceed with caution: high volatility remains a defining feature of the crypto market.
Valtrix Group recommends:
Diversifying portfolios to include digital assets;
Applying risk management strategies;
Monitoring news cycles and macroeconomic indicators.
Valtrix Group continues to closely monitor market developments, providing clients with up-to-date analytics, investment guidance, and digital finance support.
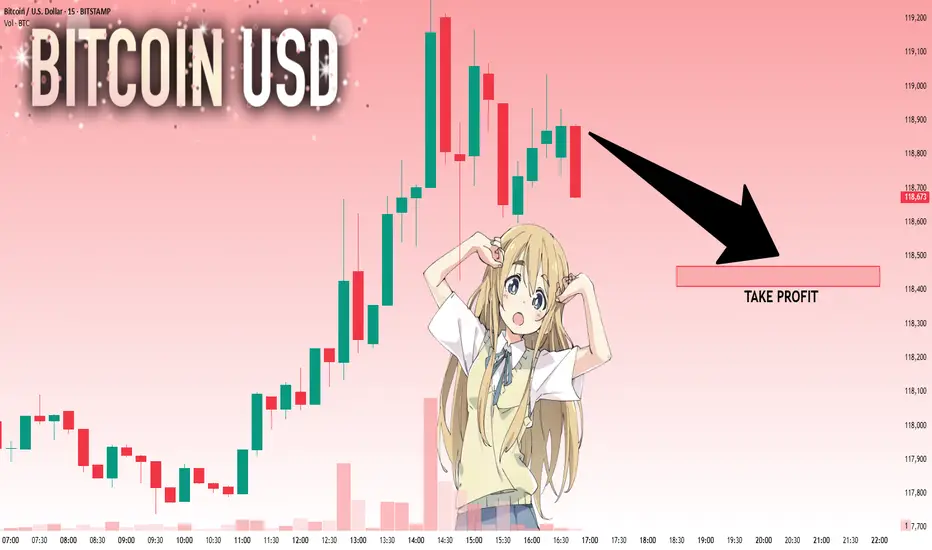
Bitcoin: celebrating new ATHCrypto enthusiasts are celebrating the latest achievement of BTC. The coin managed to reach another all time highest level during the previous week, at the level of $118,5K. Although BTC was struggling during the previous period to sustain the higher grounds, testing on several occasions the resistance level at $108K, the buying orders prevailed on Wednesday, bringing the skyrocket levels on Thursday and Friday. Crypto market significantly gained from the BTC move, as majority of other crypto coins gained in value, surging significantly total crypto market capitalization.
With the latest strong moves, the RSI reached a clear overbought market side, touching the level of 73. The indicator is closing the week at the level of 70, still continuing to move within the overbought market side. The MA50 is turning again toward the upside, leaving the MA200 aside. There is no indication of a potential cross in the coming period.
Charts are pointing to a potential for a short reversal of BTC price in the coming week. Such a move could be treated as “normal” in terms of how the market is functioning. A strong push toward the upside will make traders close their positions in order to take profits, which will shortly push the price toward downside. Where that level could be, at this moment, is hard to predict based on technical analysis, because BTC is currently moving in an uncharted territory.

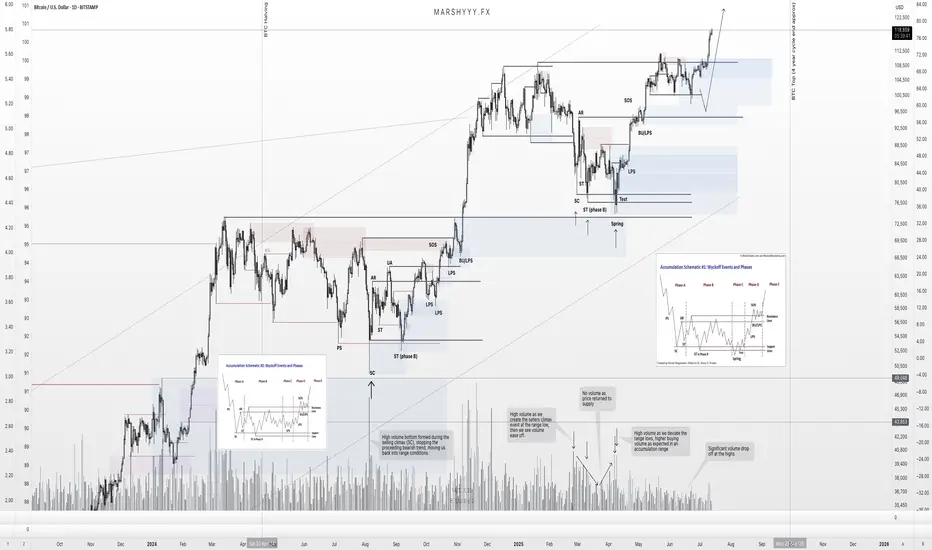
BTC – Textbook Pullback. New ATHs. What’s Next?Back in mid-June, I published a BTC update calling for a local correction into HTF demand while most were screaming bear market and waiting for deeper breakdowns.
Price action played out exactly as forecasted.
BTC swept the $100k swing low, front-ran my first demand zone by $400, and launched into a powerful reversal — just like it did back in April, where it also front-ran the key HTF demand before rallying.
That move took us straight into new all-time highs (ATHs) — now trading comfortably around $118k.
🧠 What Happened?
✅ Liquidity sweep of the prior low
✅ Front-run demand zone (perfect HTF structure)
✅ Strong bullish reaction and higher high
✅ Confluence from USDT.D rejection at 5.25%
✅ Alts showing signs of strength as BTC rallies
The entire setup aligned perfectly across BTC, USDT.D, TOTAL, and OTHERS.D — all of which I’ve been tracking in tandem.
🔮 What Now?
With BTC now in price discovery, I expect continuation higher — but not without the possibility of a short-term pullback.
📉 A potential retest of the $108k zone isn’t off the table. This level aligns with:
- Prior breakout structure
- Range high retest
- Local demand before continuation
But even if we go straight up — I remain HTF bullish into the final phase of this cycle, supported by:
- USDT.D structure still bearish
- BTC.D showing signs of distribution
- ETH.D and OTHERS.D gaining momentum
- Altseason rotation already starting to pick up
🧭 The Macro Outlook
The 4-year cycle projection still points to a Q3 2025 top — likely between August late and September based on historical cycle timing, but this could deviate.
That gives us a window of 2–3 months for this final leg to unfold — and it’s already in motion.
Stay focused. Stick to your plan. Ride the trend, don’t chase it.
Let me know what levels you're watching next, and whether you think we get that $108k retest — or we go vertical from here.
1D:
3D:
4D:
1W:
1M:
— Marshy 🔥
Btc levels 🔍 Dear TradingView community,
Here’s my outlook for Bitcoin in the upcoming weeks.
📊 The current levels are critical — they will determine whether the price continues toward higher targets or starts a deeper correction.
Stay sharp and manage your risk accordingly!
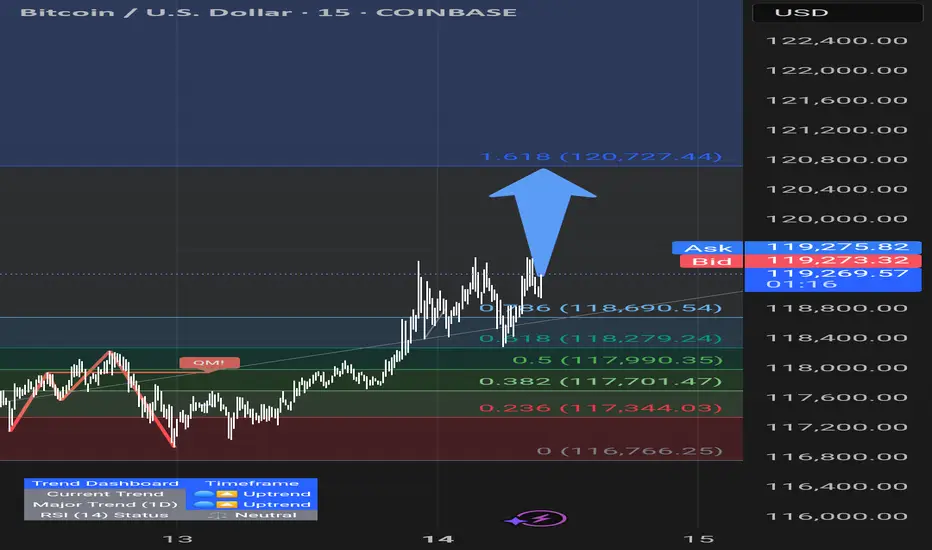
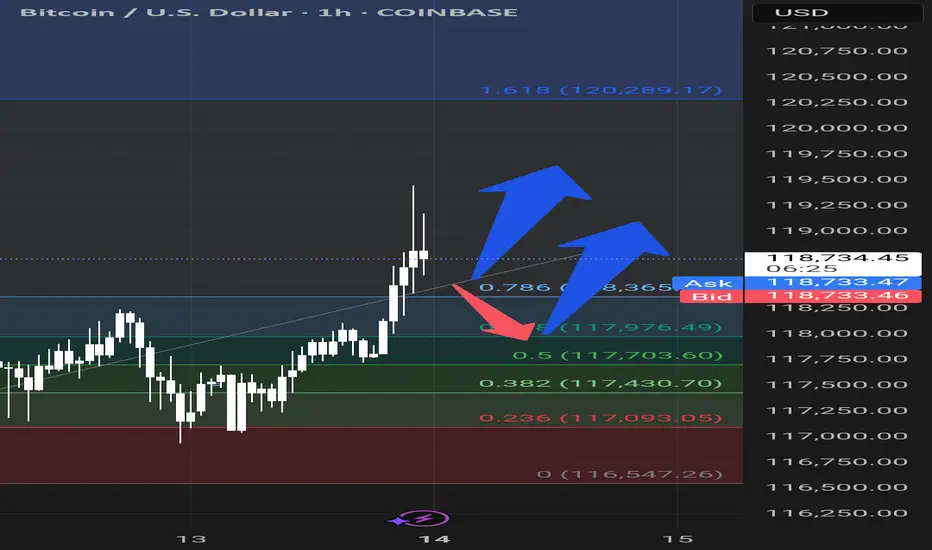
TARGET FOR BTC BUYERS OR LONGERSHELLO.
this is my targets for my btc buy in spot and my longs
hope you will find this helpfull
in the ATH we can only trade based on the fibo extentions
tell me if u need me to clear it more
thank you.

BUYTrend Line Break
Previous Day Volume
Rejection Point
Untapped Order Point
London - US Session
High Structure Swing

BTCUSD: Next Move Is Down! Short!
My dear friends,
Today we will analyse BTCUSD together☺️
The recent price action suggests a shift in mid-term momentum. A break below the current local range around 118.878 will confirm the new direction downwards with the target being the next key level of 118.470.and a reconvened placement of a stop-loss beyond the range.
❤️Sending you lots of Love and Hugs❤️
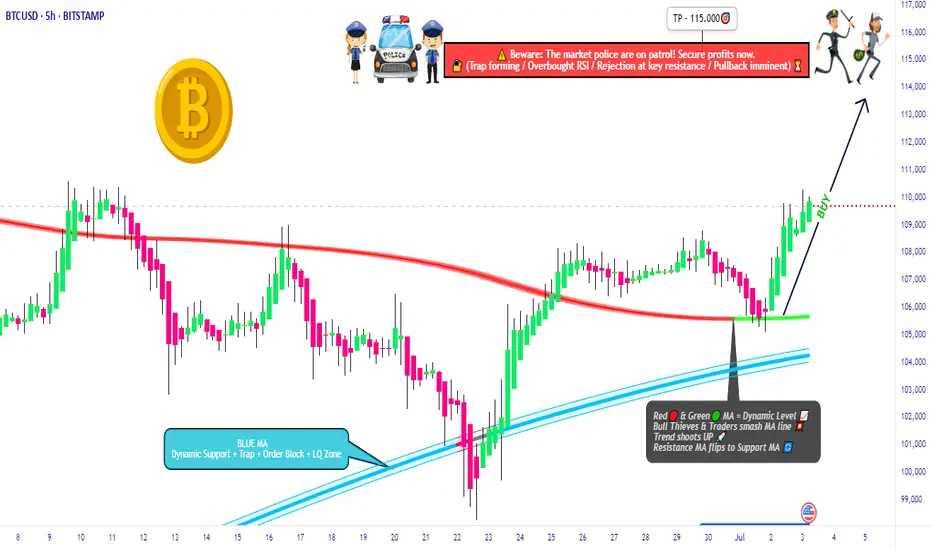
BTC/USD Heist Mode: Buy Low, Escape Rich🔓 BTC/USD Crypto Vault Breach: Thief Strategy for Long Entry Robbery (Swing/Day Setup) 🔓
🌟Hi! Hola! Ola! Bonjour! Hallo! Marhaba!🌟
Dear Money Makers & Robbers, 🤑💰💸✈️
🚨 Welcome to our next Thief Trading-style breakout mission — this time targeting the mighty BTC/USD vault. Using a fusion of technical precision and macro-level insight, we're charting a long entry blueprint for a profitable heist.
🔑 Entry Plan
"The vault is open!" 💥
Buy at current price or set Buy Limit near swing lows (15–30min timeframe pullback entries). We're timing the entry with stealth—precision over panic.
🛑 Stop Loss Setup
SL set near recent swing low (4H TF reference: ~104.000).
Adjust based on position sizing, risk appetite & multi-order tactics.
🎯 Take Profit Target
Targeting 115.000—or exit earlier if price action stalls. Get in, get out. Efficiency is the code.
👀 Scalpers' Notice
Only work the Long side. If your bag’s heavy, strike instantly. If light, ride with swing robbers. Use trailing SLs to protect your bag.
📈 Why We’re Bullish
Market momentum favors the bulls:
Overbought zones acting as lures
Bearish traps ready to flip
Key confluences from sentiment, COT, on-chain & macro analysis
➡️ Full supporting breakdown available 👉👉🔗🔗.
📢 Risk Note – Stay Sharp
Major news events = increased volatility ⚠️
Avoid entries during news. Trail stops to protect running profit. Rob smart.
💖 Boost the Crew
If this blueprint aligns with your mission, hit that Boost button. It fuels the team, and together, we profit like pros. One heist at a time. 💪🎉
🧠 Stay ready—next plan drops soon. Until then, rob safe, rob smart. 🐱👤
BtcBtc always up..if are break down this red arrow it will be retracement movement..important just buy for long and sell for short term
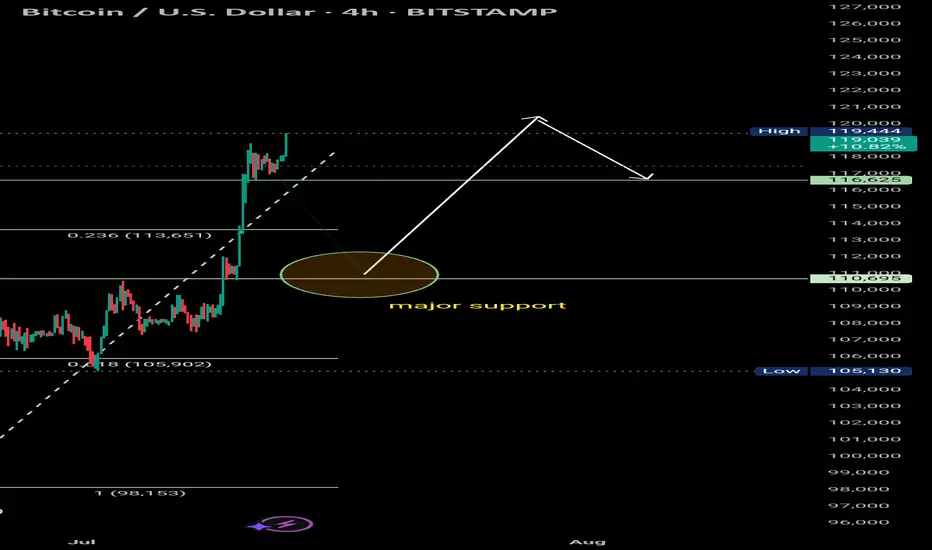
Bitcoin has made a new high at $119, 444.
High: $119,444 – New swing high reached, showing +25.71% gain from the recent low.
Bullish Continuation/If the support holds, buyers are expected to step in and push price further above the recent high toward the next resistance range of $124K+.
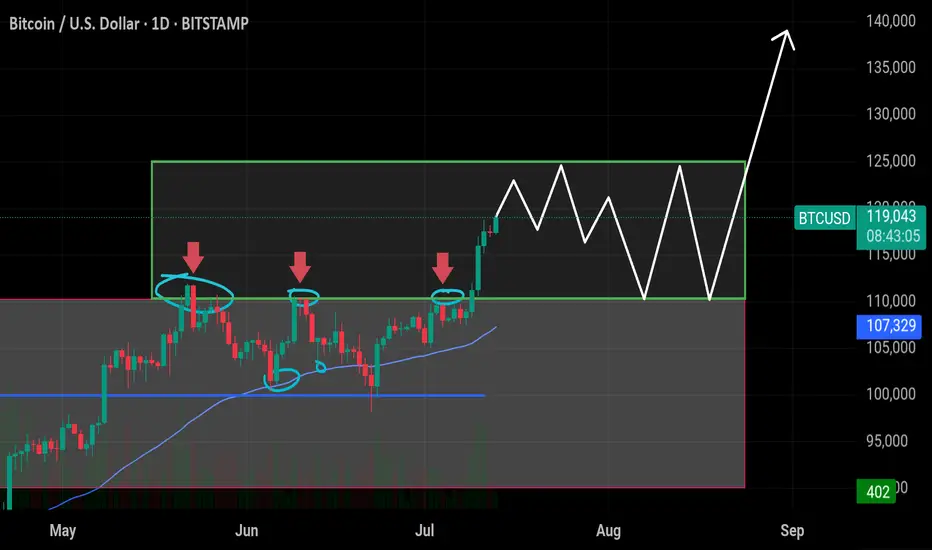
$BTC Ready to Explode – Targeting $125K+ Soon! Bitcoin has finaCRYPTOCAP:BTC Ready to Explode – Targeting $125K+ Soon!
Bitcoin has finally broken out of the previous resistance range (~$110K–$111K), where it was rejected multiple times in June. Now it's consolidating in a tight box, setting up for a big move.
🔸 Support $110k–$113k
This area was previous resistance and is now acting as strong support. Holding above this confirms bullish strength.
🔸 Upside Target: $125k
If BTC holds within the current range and breaks above, the next leg could push price toward $125K. A clean breakout could even extend toward $140K.
🔸 Short-Term Take Profits:
✅ TP1: $120,000
✅ TP2: $122,000
✅ TP3: $125,000
🔸 Risk Level at $110,000:
Break below this level would invalidate the bullish setup and increase downside risk.