Why Your Chart Might Be Lying to You And (How to Fix It) !Hello Traders 🐺
Ever clicked the “Log” button on your chart and suddenly everything looked different?
Yeah, you’re not alone...
Most traders ignore it.
But understanding the difference between a Linear and Logarithmic chart can literally change how you see price action — especially if you’re into long-term moves or trading volatile markets like crypto.
Let’s break it down real simple 👇
🔹 Linear Chart (a.k.a. the default)
This is what most charts use by default.
It measures price change in absolute terms.
Meaning: the distance from $10 to $20 is exactly the same as from $20 to $30 — because in both cases, price moved $10.
🧠 Sounds fair, right?
Not always. Here's why...
Let’s say a stock goes from $1 to $2 — that’s a 100% gain.
But if it goes from $100 to $101 — that’s just 1%.
✅ Linear Chart – Pros
Simple and easy to read
Good for short-term price action
Better for assets with small price ranges
Familiar to most beginners
❌ Linear Chart – Cons
Misleading in long-term charts
Distorts large percentage moves
Trendlines become unreliable over time
Doesn’t reflect real growth in % terms
🔹 Logarithmic Chart (Log Scale)
This one shows percentage-based price movement.
Now, going from $10 to $20 (100% gain)
and going from $100 to $200 (also 100% gain)
look exactly the same on the chart — which actually makes more sense when analyzing growth.
It’s super useful when:
✅ You’re analyzing big moves over time
✅ You want to draw accurate trendlines in long-term charts
✅ You're dealing with assets that grew 5x, 10x or more
✅ You care about % gains instead of raw price
❌ Log Chart – Cons
Less intuitive for beginners
Not useful for low-volatility assets
Small price moves may look insignificant
here is an example of the same chart but in the Log Scale :
As you can see on the chart above there is huge difference in accuracy when you use Log scale
for the high volatile asset such as BTC specially in the long term movements .
🆚 So, When Should You Use Each One?
Situation Use Linear Use Log
Small price changes ✅ ❌
Day trading / scalping ✅ ❌
Long-term analysis ❌ ✅
Parabolic or exponential moves ❌ ✅
Drawing long trendlines ❌ ✅
Final Thoughts
If your chart looks weird when you zoom out…
If your trendlines don’t quite fit anymore…
Or if you’re analyzing something that went 10x…
🔁 Try switching to Log scale — it might just clean up the noise.
Small toggle. Big difference.
And also remember our golden rule :
🐺 Discipline is rarely enjoyable , but almost always profitable. 🐺
🐺 KIU_COIN 🐺
BTCUSD.P trade ideas

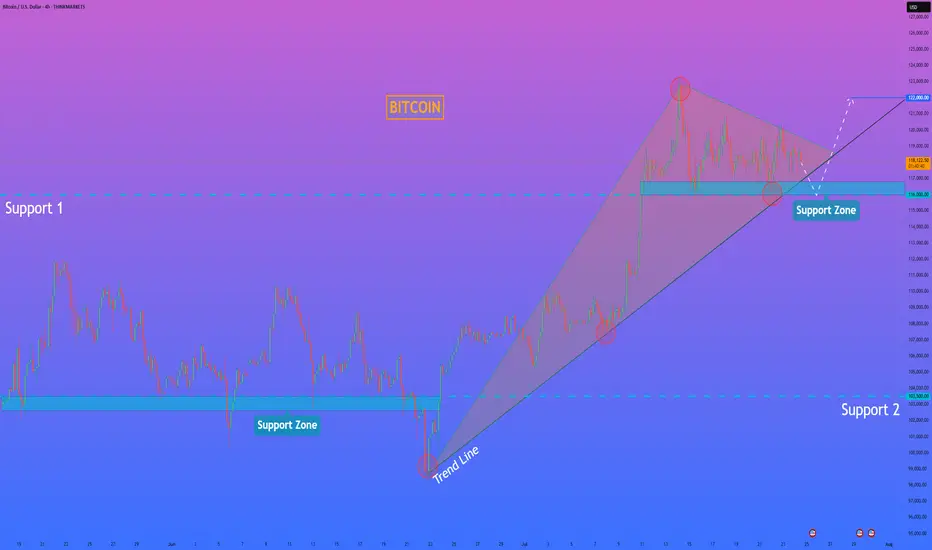
HelenP. I Bitcoin can fall to support zone and then start riseHi folks today I'm prepared for you Bitcoin analytics. If we look at the Bitcoin chart, the most prominent feature is the formation of a large bullish pennant following a strong upward impulse. This type of consolidation pattern typically suggests that the market is pausing to gather strength before continuing in the direction of the primary trend. The price is currently consolidating within the boundaries of this pennant, which are defined by an upper resistance line and a strong ascending trend line acting as the lower support. It is crucial to note the confluence of this ascending trend line with the horizontal support zone between 116000 and 116800, creating a powerful area of potential support. My analysis is based on the expectation that the price will make a final test of this key support confluence. I believe that a dip towards the 116000 - 116800 zone will be met with strong buying interest. A clear rejection from this area, confirming that buyers are defending both the horizontal and dynamic support, would be the critical condition validating a long position. A successful bounce should provide the catalyst for a bullish breakout from the top of the pennant, signaling the resumption of the uptrend. Therefore, I have set the primary goal for this subsequent upward move at the 122000 level, a logical target that would confirm the continuation of the bullish market structure. If you like my analytics you may support me with your like/comment ❤️
Disclaimer: As part of ThinkMarkets’ Influencer Program, I am sponsored to share and publish their charts in my analysis.
Bitcoin Passes Stress TestOn July 25, 2025, Galaxy Digital executed one of the largest Bitcoin sales ever recorded: 80,000 BTC, valued at approximately $9 billion , on behalf of a Satoshi-era investor.
Despite the size, the market absorbed the flow with minimal volatility—Bitcoin dipped from around $119,000 to $115,000, then rebounded above $119,000.
Liquidity Maturity in Motion
Analysts called the trade a significant demonstration of market maturity, noting that 80,000 BTC was absorbed in days with barely a market blip.
Crypto infrastructure has also evolved: algorithmic liquidity providers, institutional desks, and OTC channels handled the load without triggering cascading funding rate hikes or forced liquidations.
Ongoing Risks
Event-Driven Stress: During macro shocks or sharp sell-offs, liquidity may thin, and the same level of absorption might not persist.
OTC vs Exchange: This large sale was managed mostly off-exchange. A similar-sized on-exchange dump could still trigger stop-run cascades.
Retail Complacency Risk: The stability seen now can be deceptive, as retail may misinterpret low volatility as a safe leverage zone, only to be caught off-guard.
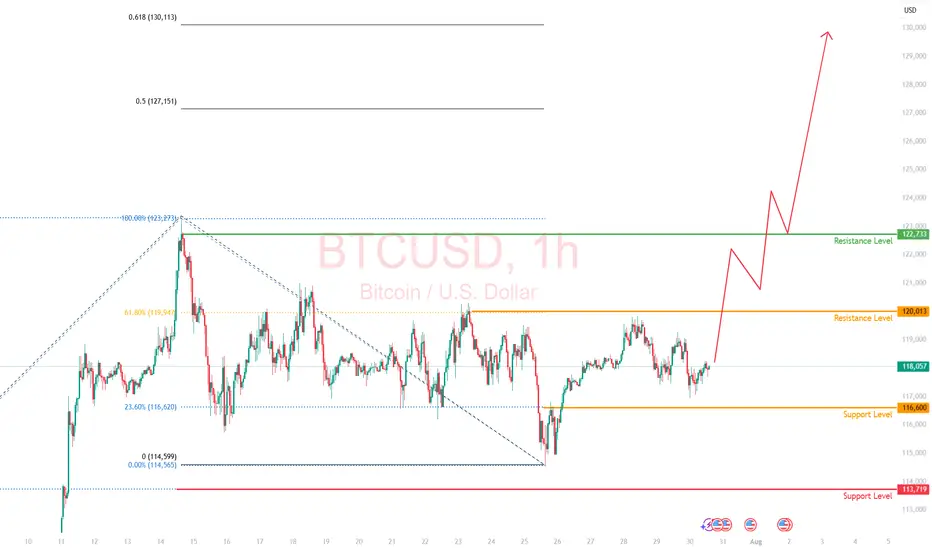
Projections:
Watching the 23.6% fib retracement level in line with the $116,600 price level. Anticipate the resistance level of $120,000 to be retested.
If price breaks above $120,000, we could see a significant move toward $130,000
The $9B BTC sale went through without materially impacting price is considered a milestone in crypto market evolution. It reflects institutional-grade liquidity and sentiment maturity.
Bitcoin sell short Bitcoin has negative divergence on the weekly timeframe and is suffering. The target is $82,000. It is now the channel ceiling. The market is heavily bearish.
Bitcoin Tp:82000
😘😘😘

BTCUSD: Bears Are Winning! Short!
My dear friends,
Today we will analyse BTCUSD together☺️
The in-trend continuation seems likely as the current long-term trend appears to be strong, and price is holding below a key level of 118,973 So a bearish continuation seems plausible, targeting the next low. We should enter on confirmation, and place a stop-loss beyond the recent swing level.
❤️Sending you lots of Love and Hugs❤️

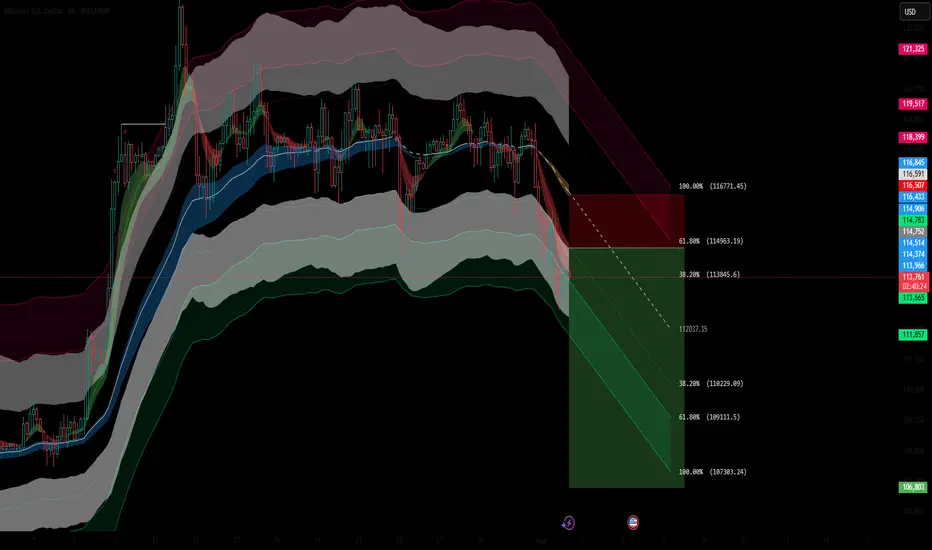
BTCUSD Short Setup – 4H Bitcoin has broken below a key dynamic support zone, and current price action signals a potential continuation to the downside. This short entry is supported by multiple technical confluences:
🔻 Bearish Confluences:
Fibonacci Retracement Rejection: Price rejected the 61.8% Fib retracement zone near $114,978, confirming a potential local top.
Trend Structure: Clear lower high, lower low structure forming on 4H – momentum favors sellers.
EMA Cloud Pressure: Price is decisively below the multi-band EMA cloud, showing sustained bearish pressure and trend bias.
Volume Profile Gap: Price is entering a low-volume node between $113.8k and $112k, increasing likelihood of a sharp move down.
Bearish Candlestick Pattern: A strong bearish engulfing candle formed after the retracement – a classic reversal confirmation.
🎯 Fibonacci-Based Targets:
TP1 – $11205 (38.2%): Initial demand zone and minor support.
TP2 – $11024 (61.8%): Mid-extension level, aligns with prior consolidation.
TP3 – $10731 (100%): Full measured move target if the downtrend accelerates.
SL: Placed just above the recent swing high at $11678, protecting against false breakouts.
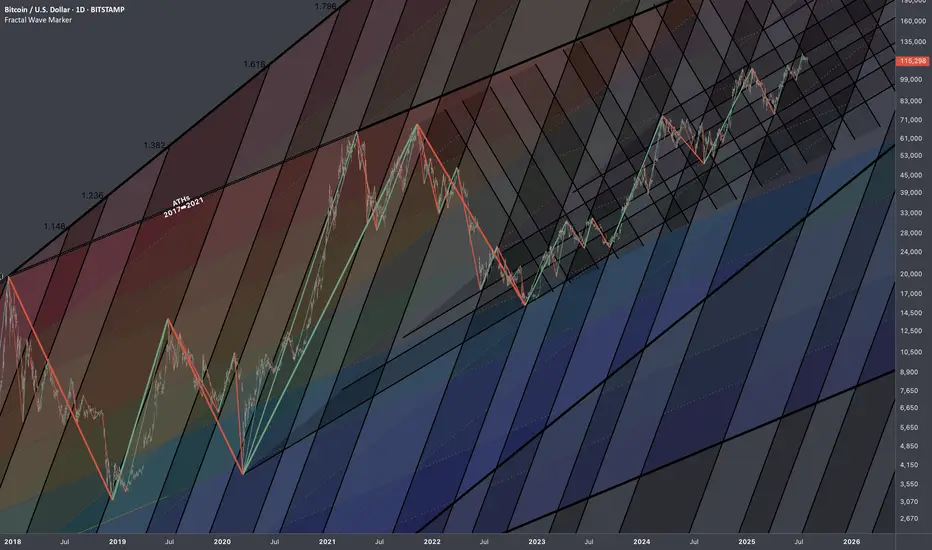
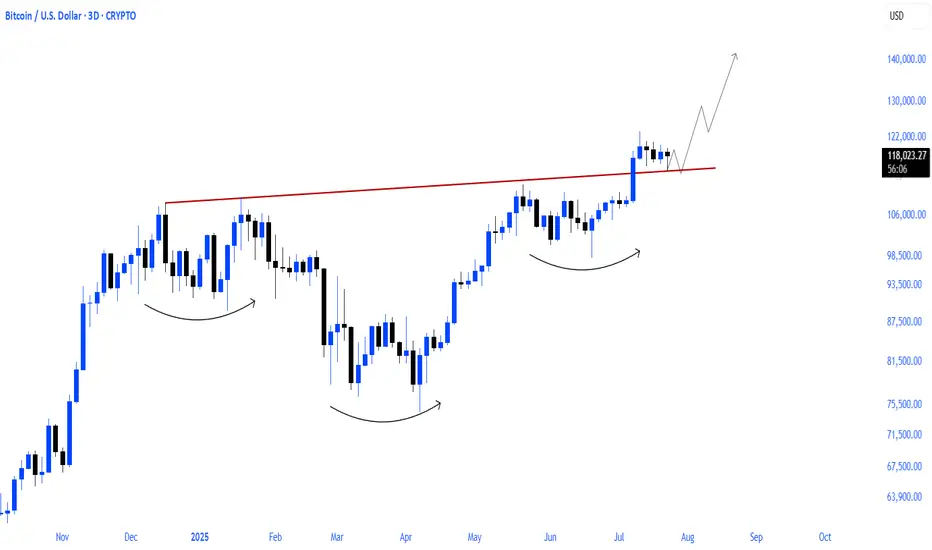
Bitcoin: Interconnections Rewired🏛️ Research Notes
Keeping fib channel of the rising trend angles as they've number of times covered well that aspect of cycle texture.
The other frame of reference would be with fib channel that covers drop from 2021 ATH to late 2022 bottom.
Last bit would be integrating fib channel discovered while ago that connects covid & late 2022 bottoms
Together they create a framework that addresses the complexity and makes even the most chaotic price movements seem to be a part of structural narrative.
BITCOIN Will Go Lower! Sell!
Please, check our technical outlook for BITCOIN.
Time Frame: 9h
Current Trend: Bearish
Sentiment: Overbought (based on 7-period RSI)
Forecast: Bearish
The market is trading around a solid horizontal structure 113,260.21.
The above observations make me that the market will inevitably achieve 107,826.27 level.
P.S
We determine oversold/overbought condition with RSI indicator.
When it drops below 30 - the market is considered to be oversold.
When it bounces above 70 - the market is considered to be overbought.
Disclosure: I am part of Trade Nation's Influencer program and receive a monthly fee for using their TradingView charts in my analysis.
Like and subscribe and comment my ideas if you enjoy them!

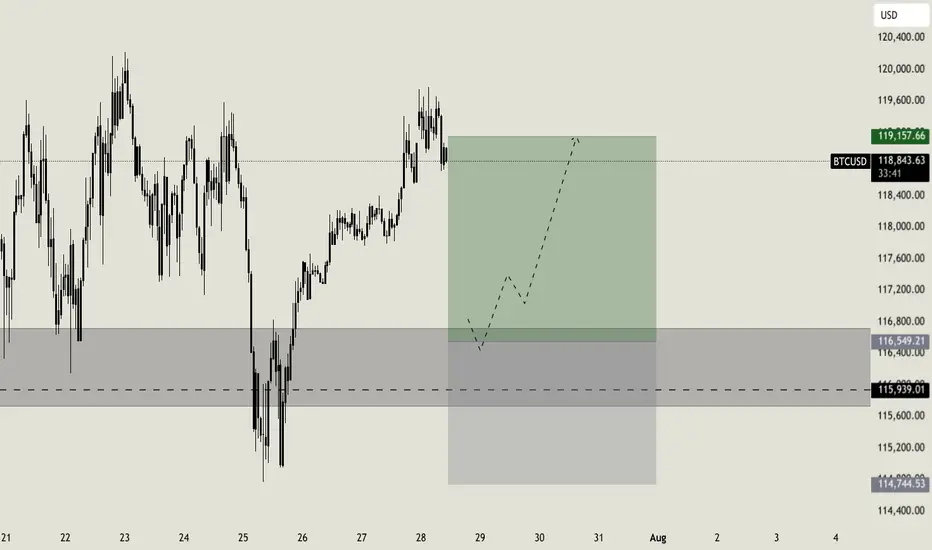
Weekly setup for BTCLast week i was waiting for a short confirmation on Bitcoin, a confirmation that has never arrived. But setups are made for this: we wait the right moment to join the market, based on a cold analysis. Considering that the support area looks still strong, i will now wait for a retracement till the key level at $116.550. Around this level i will look for a rejection to enter long, targeting the resistance zone at $119.000
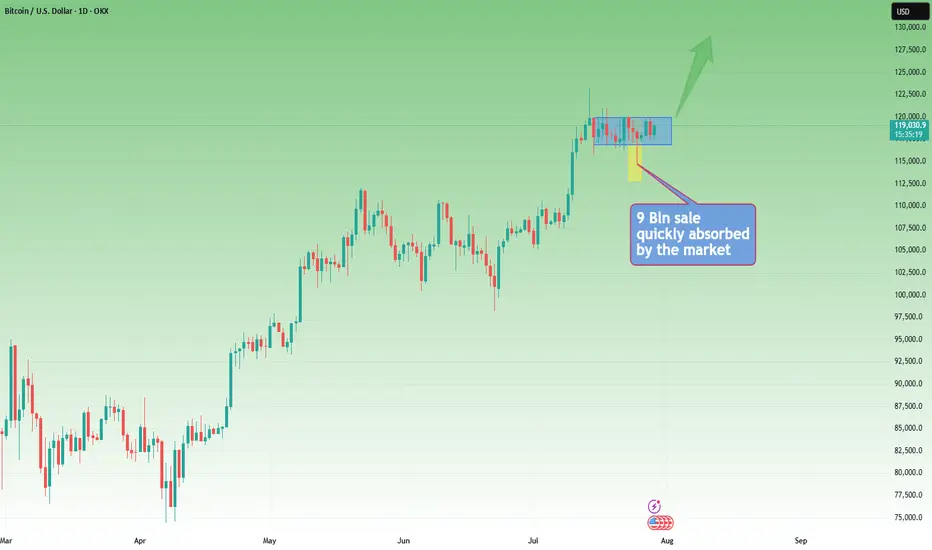
Rectangle Consolidation + Bull Trend = BTC Setup for ATHYesterday, Bitcoin dipped and recovered again, following last week's sharp spike down, triggered by the $9B Galaxy Digital sale on behalf of a Satoshi-era investor.
________________________________________
🧠 Why is this important?
Despite being one of the largest BTC sales in history, the move only caused a temporary spike down.
That’s a clear sign of market strength and strong interest on dips.
________________________________________
📉📈 Current Technical Context:
• If we ignore the spike, price is consolidating in a tight rectangle
• That’s typically a continuation pattern
• The broader trend remains strongly bullish
📌 Put all of that together, and we have at least 3 reasons to expect upside continuation
________________________________________
🎯 Key Levels:
• Break + daily close above $120K → likely leads to a new ATH and a potential test of $130K
• Invalidation only comes with a break below $114K
________________________________________
Conclusion:
BTC just absorbed a massive $9B sell without blinking.
As long as $114K holds, I'm bullish and expecting continuation.
Next leg could (and I hope it will) be explosive. 🚀
BTC - 12H Break Likely TodayAs we continue to follow BTC's LTF pattern it is likely to either breakout or breakdown today. FOMC happens in about 4 hour from now which is likely to lead to volatility.
As you can see from the chart, BTC's price has been perfectly aligned within this 12H symmetrical triangle (white dotted lines). This is validated by the many touchpoints of support and resistance (green and red arrows).
Once we see a 12H candle close above or below this pattern it could lead us to our measured move price target (yellow ray).

Bullish continuation?The Bitcoin (BTC/USD) has bounced off the pivot and could rise to the 1st resistance.
Pivot: 116,724.27
1st Support: 111,336.90
1st Resistance: 123,341.37
Risk Warning:
Trading Forex and CFDs carries a high level of risk to your capital and you should only trade with money you can afford to lose. Trading Forex and CFDs may not be suitable for all investors, so please ensure that you fully understand the risks involved and seek independent advice if necessary.
Disclaimer:
The above opinions given constitute general market commentary, and do not constitute the opinion or advice of IC Markets or any form of personal or investment advice.
Any opinions, news, research, analyses, prices, other information, or links to third-party sites contained on this website are provided on an "as-is" basis, are intended only to be informative, is not an advice nor a recommendation, nor research, or a record of our trading prices, or an offer of, or solicitation for a transaction in any financial instrument and thus should not be treated as such. The information provided does not involve any specific investment objectives, financial situation and needs of any specific person who may receive it. Please be aware, that past performance is not a reliable indicator of future performance and/or results. Past Performance or Forward-looking scenarios based upon the reasonable beliefs of the third-party provider are not a guarantee of future performance. Actual results may differ materially from those anticipated in forward-looking or past performance statements. IC Markets makes no representation or warranty and assumes no liability as to the accuracy or completeness of the information provided, nor any loss arising from any investment based on a recommendation, forecast or any information supplied by any third-party.

Strong Bearish move possible from these levels.Adjusted Trendlines
We have slightly adjusted the trendlines, as Bitcoin appears to hesitate in choosing its next move. We still estimate a 70–80% probability of a significant decline from current levels.
There is a small chance that liquidity above the all-time high (around $124K) may still be required, but I remain skeptical of that scenario.
The XRP 1.5-1.6usd target remains valid. However, it remains challenging to pinpoint the exact moment when altcoins will begin to outperform Bitcoin, and thats just what happened recently, If we break below 2.75usd with strength then a move towards 1.6usd is almost certain.
Nice Bitcoin Bullish Set Up On The Hourly I noticed something that may look interesting on the hourly time frame. So here's a little heads up!

Are you ready for the BUY BTCUSD signal?✏️ The pennant pattern is forming. After BTCUSD reached a new peak, the past 1 week, BTC price has been accumulating to form a bullish pennant pattern. This is a bullish continuation pattern that signals when breaking the upper boundary of the flag pattern.
📉 Key Levels
BUY Trigger: Break and trade above 199000
Target 128000
Leave your comments on the idea. I am happy to read your views.

#BTCUSD Short term buying LevelsBINANCE:BTCUSD Short term looks bullish and heading towards 132000$, Any panic is a buy at equal legs

BTC # Bitcoin (BTC/USD) 30-minute chartThis Bitcoin (BTC/USD) 30-minute chart shows a symmetrical triangle pattern forming, with price action compressing between a descending resistance (red trendline) and an ascending support (gray trendline). The price is currently near the apex of the triangle at $118,149, suggesting a potential breakout or breakdown soon. Key support and resistance levels are marked at $115,200 and $120,200 (blue lines). A breakout above the red line could indicate bullish momentum, while a drop below the gray support may signal bearish continuation. Traders should watch for a decisive move outside the triangle for confirmation.
thanking you

BTCUSD Breakdown Below 116,500 – Watching 61.8% Fib Retracement BTCUSD has broken down below the 116,500 level on the 4-hour timeframe. It’s best to wait for a potential sell entry near the 61.8% Fibonacci retracement of the last bullish wave. Stop-loss and take-profit levels are shown on the chart

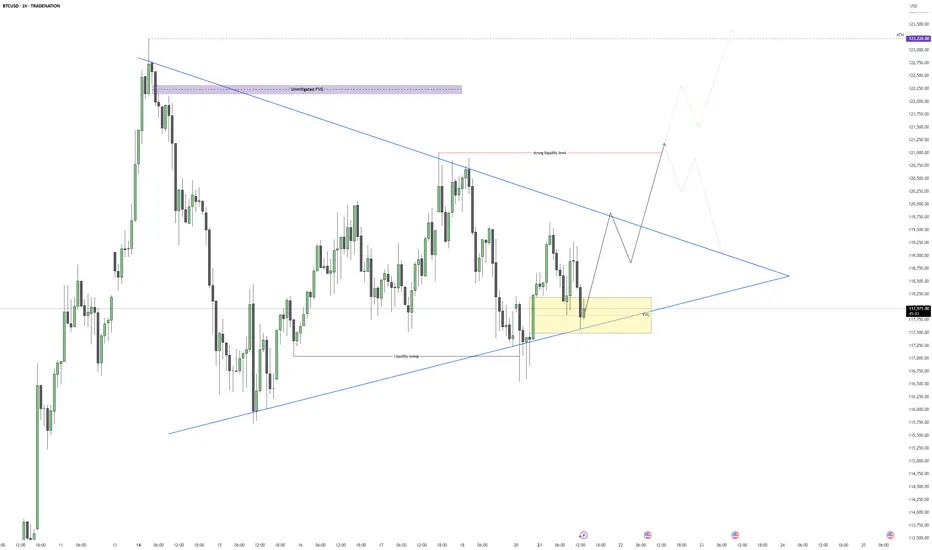
Bitcoin – Breakout Coming, But May Be a TrapBitcoin is trading within a well-defined bullish pennant structure on the 1H chart, with clear compression between a rising support and descending resistance. This pattern typically signals a continuation of the prior trend, but given the surrounding liquidity and recent FVG formation, the setup looks more nuanced. After a liquidity sweep earlier this session, price has rebounded and is currently respecting a newly formed 1H fair value gap within the pennant range.
Pennant Structure and Price Reaction
The consolidation is tight and clean, with buyers stepping in off the ascending trendline support. This area overlaps with a small FVG that has so far held as intraday support, suggesting active demand. Until this gap is violated, the structure remains intact and favors a breakout play to the upside. However, with a larger unmitigated FVG sitting just under 121,000 and a previous swing high forming a strong liquidity pool, the upside might be limited.
Buy Side Liquidity and Reversal Area
If price can push above the descending trendline, the next logical target is the buy side liquidity sitting around 120,800 to 121,200. That zone is also where sellers may step in, given it aligns with prior inefficiency and a probable stop hunt level. This makes it a high-probability reversal area. I expect price to take out that buy side before we get a meaningful shift lower again.
Displacement and FVG Reactions
Any clean displacement toward the upside, particularly into the 121k range, will be key to watch for rejection signs. Should we see rejection or an SFP at the liquidity zone, that would likely confirm the short-term top. At that point, I’d expect a return into the pennant or even a sweep of the trendline support again, setting up a deeper retracement.
Short-Term Expectations
In the immediate term, as long as price holds above the current FVG and trendline confluence, I expect Bitcoin to slowly grind higher and break out of the pennant. The objective is the liquidity above 120,800. Once that’s taken, I’ll be watching closely for signs of exhaustion or reversal patterns to get positioned short again.
Conclusion
Bitcoin is compressing within a bullish pennant and currently holding a fair value gap, suggesting bullish continuation in the short term. However, the real play may come after a sweep of the buy side liquidity near 121k, where I expect a bearish rejection and opportunity for downside positioning. The market structure remains neutral to bullish until that liquidity is tagged.
Disclosure: I am part of Trade Nation's Influencer program and receive a monthly fee for using their TradingView charts in my analysis.
___________________________________
Thanks for your support!
If you found this idea helpful or learned something new, drop a like 👍 and leave a comment, I’d love to hear your thoughts! 🚀
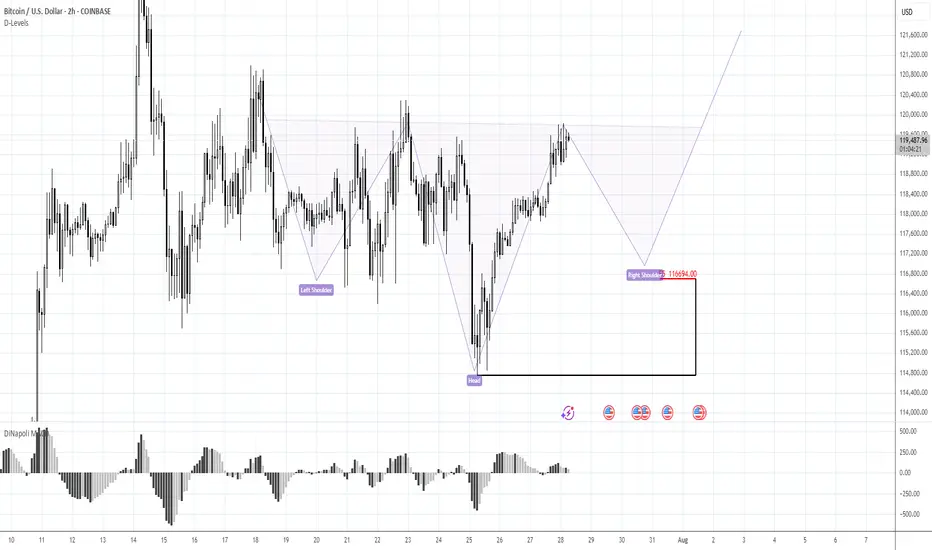
BTC 116.70K stands in focusMorning folks,
Once we've prepared the analysis, we've got upsetting squeeze down, thanks to Galaxy massive sell-off. I don't know what they were trying to do - either hunted for stops under 116K, or just sold in most unwelcome moment... but unfortunately such an issues are out of our control.
For now - BTC totally reversed this sell-off and once again shows positive sentiment. Now we consider same reverse H&S pattern, but this time of a bigger scale. 116.70K support area, where, the right arm should be formed now stands in our focus for long entry. We consider no shorts by far. Hopefully no more tricks will follow from old Donny or somebody else...
Bitcoin longs | Unemployment claims + PMI news release.Im looking for a distribution to 120289.8 & 120983.3 tomorrow whit 8.30 - 9.45 news release.
Invalidation point for the idea is a close below 117733.2
$BTC NEXT WAVE PROGRAMMED!bitcoin will load the next wave after the accumulation process it is in after the parabolic run
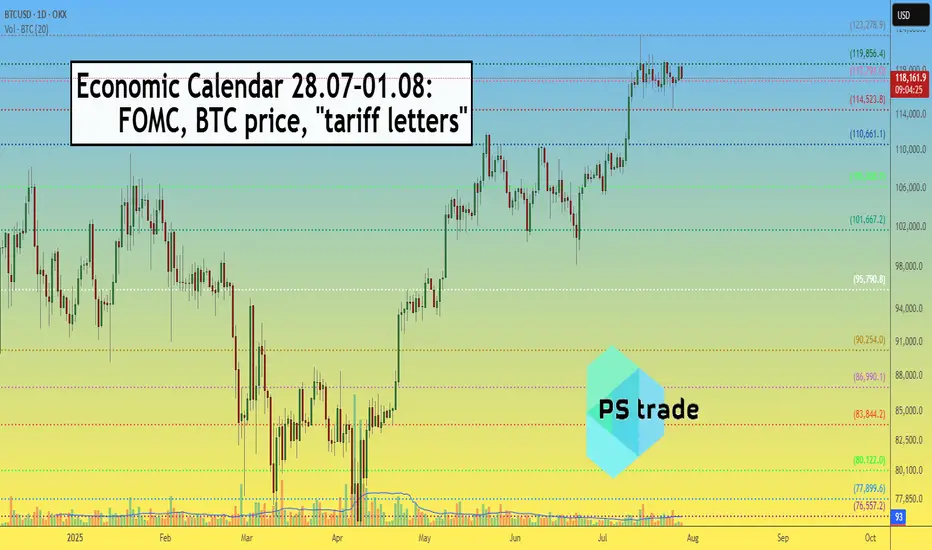
Very important Economic Calendar 28.07–01.08: FOMC, BTC, tariffsThis Week (July 28 – August 1) — the final week of the month is packed with key events.
Save this post and forward it to 3 friends 😉
📋 High volatility ahead — as the Fed’s key "threelemma" (inflation, labor market, tariffs) comes into focus.
Several important macro releases are scheduled — each one matters on its own, but combined, they can move markets sharply.
🗓 Monday (July 28)
▪️ 12:30 UTC – QRA (Part 1): upcoming US Treasury borrowing needs
▪️ 16:00 UTC – 2Y & 5Y bond auctions – key indicator of market expectations ahead of FOMC
🔗 Strong demand = stronger rate cut expectations
🗓 Tuesday (July 29)
▪️ 12:30 UTC – US GDP (Q2 estimate)
▪️ 16:00 UTC – 7Y bond auction
🗓 Wednesday (July 30)
▪️ 12:15 UTC – ADP employment report – early signal ahead of NFP
▪️ 12:30 UTC – QRA (Part 2): breakdown of Treasury borrowing
▪️ 18:00 UTC – FOMC rate decision (no change expected – 4.5%) + Powell’s press conference
🗓 Thursday (July 31)
▪️ 12:30 UTC – PCE inflation (June) – Fed’s favorite inflation gauge
🗓 Friday (August 1)
▪️ 12:30 UTC – Nonfarm Payrolls (employment)
▪️ 13:00 UTC – ISM Manufacturing Index (July)
▪️ 13:00 UTC – Univ. of Michigan Consumer Sentiment Index
▪️ All day – July auto sales data
🚨 LIBERATION DAY 2.0
Potentially the most impactful event of the week: the Trump administration will begin sending “tariff letters” to ~200 countries.
This marks the end of the temporary tariff relief (April 8 – August 1).
Markets expect a new wave of global trade tension — timing is still uncertain.
💡 Summary:
Every day brings a new potential driver.
Markets are nervous and highly reactive — sharp moves are likely...
CRYPTOCAP:BTC is currently being held above $117K, but Wednesday and Friday bring high risk of "news bombs".