$BTC 2013\2017 vs. 2021\2025bitcoin is exactly repeating the reflection of the 2013-2017 period
zoom out!
BTCUSD.P trade ideas

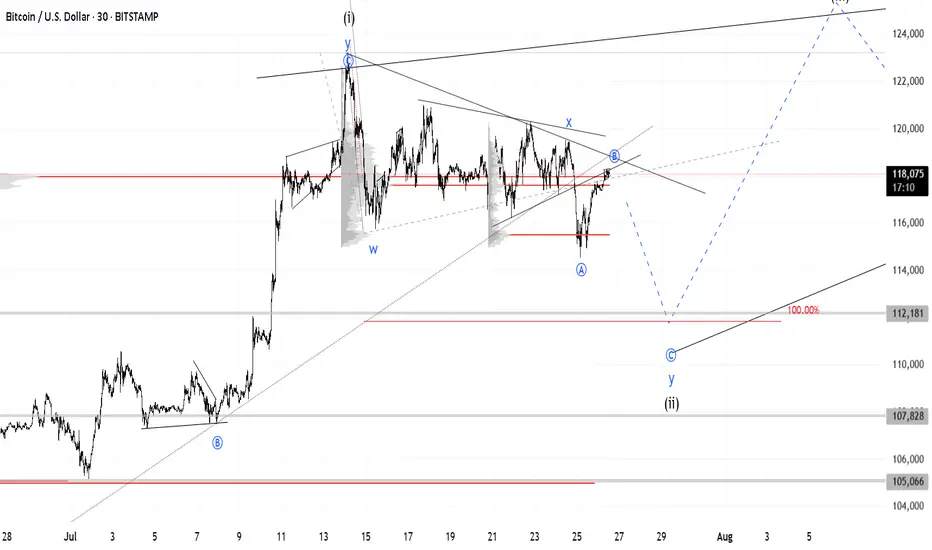
Bitcoin Long: Completion of Sub-wave 4, riding wave 5I updated the Elliott Wave counts for Bitcoin and we should have completed sub-wave 4 and is currently onto sub-wave 5. Based on my counts, sub-wave 3 has extended and is slightly more than 1.618x of wave 1, thus I expect sub-wave 5 to NOT extend. Based on Fibonacci extensions, the price target is around $124,600.
The stop loss for this idea is around $114,600.
Towards to end of the video, I zoomed out for Bitcoin and observed that Cycle level wave 1 and 3 are HUGE (red font) and the current Cycle Wave 5 looks too small. Thus, the entire 5-wave structure of what we are going through now may be just a Sub-Wave 1 of Cycle Wave 5. And that means that longer-term, Bitcoin may really go to $200,000 and beyond. But for traders, keep our foot on the ground and trade what is in front of us.
Good luck!

BTCUSD MIGHT DROP!The price currently trade at 117,399 recently price broke through the local support level of 116155.00 I anticipate price to make some sell corrections . I’m selling from the current market price. Take advantage of the opportunity.

Bitcoin - The cycle is just starting!⚔️Bitcoin ( CRYPTO:BTCUSD ) just created new highs:
🔎Analysis summary:
Bitcoin is currently - especially with the new all time high breakout - just perfectly following previous cycle behavior. Since there is no real resistance above current price, apart from psychological levels, I do expect a substantial rally back to the upper channel resistance trendline.
📝Levels to watch:
$300.000
🙏🏻#LONGTERMVISION
Philip - Swing Trader

BTC predictionSome of you may feel dissatisfaction, emptiness, or longing. This longing is the loss of freedom, and it is freedom that you truly yearn for.

Ethereum is Trending HigherSince April trough, Ethereum has risen by 179%, delivering a higher rate of return than Bitcoin at 66%. But most of our attention is on Bitcoin, breaking above the 120,000 level.
Why is Ethereum quietly gaining ground —and what does the future hold for Ethereum?
Mirco Bitcoin Futures and Options
Ticker: MET
Minimum fluctuation:
$0.50 per ether = $0.05 per contract
Disclaimer:
• What presented here is not a recommendation, please consult your licensed broker.
• Our mission is to create lateral thinking skills for every investor and trader, knowing when to take a calculated risk with market uncertainty and a bolder risk when opportunity arises.
CME Real-time Market Data help identify trading set-ups in real-time and express my market views. If you have futures in your trading portfolio, you can check out on CME Group data plans available that suit your trading needs www.tradingview.com

BTC at Multi-Factor Resistance: Wave Count Hints at Downside BTC is looking increasingly bearish as the price has risen to a resistance zone formed by multiple factors: trendlines, the POC (Point of Control), and moving averages.
The wave count also supports this bearish outlook / the bearish case.
Bitcoin sell short Bitcoin has negative divergence on the weekly timeframe and is suffering. The target is $82,000. It is now the channel ceiling. The market is heavily bearish.
Bitcoin Tp:82000
😘😘😘

SELL BTCUSD for bullish trend reversal SELL BTCUSD for bullish trend reversal
STOP LOSS : 122,500
Trade trade is based on false breakout and divergence.....
First what is false breakout, A false breakout in Forex occurs when the price breaks through a key level (like support or resistance) but quickly reverses and returns to its original range, often trapping traders who were expecting a continuation of the breakout. It's essentially a false signal, indicating a potential trend reversal or continuation, but the price doesn't follow through....
Secondly what is divergence ,In forex trading, divergence occurs when the price of a currency pair moves in one direction, while a technical indicator (like an oscillator) moves in the opposite direction. This mismatch can signal a potential trend reversal or weakening trend. There are two main types: bullish and bearish divergence.
On this trade we are taking it because we saw regular bearish divergence
Regular Bearish Divergence
In case of Regular Bearish Divergence:
* The Indicator shows Lower Highs
* Actual Market Price shows Higher Highs
We can see a strong divergence on the RSI already and There is a strong trend reversal on the daily time frame chart.....
The daily time frame is showing strength of trend reversal from this level resistance so we are looking for the trend reversal and correction push from here .....

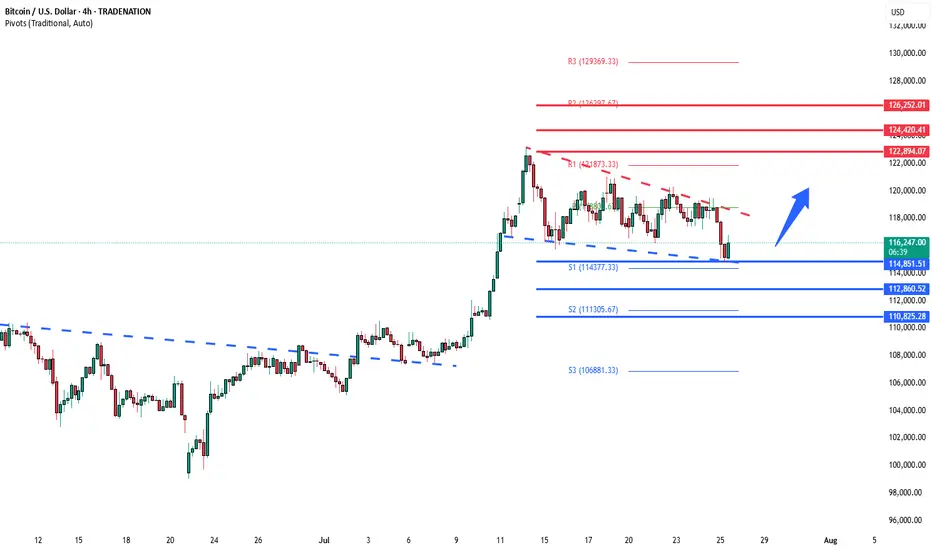
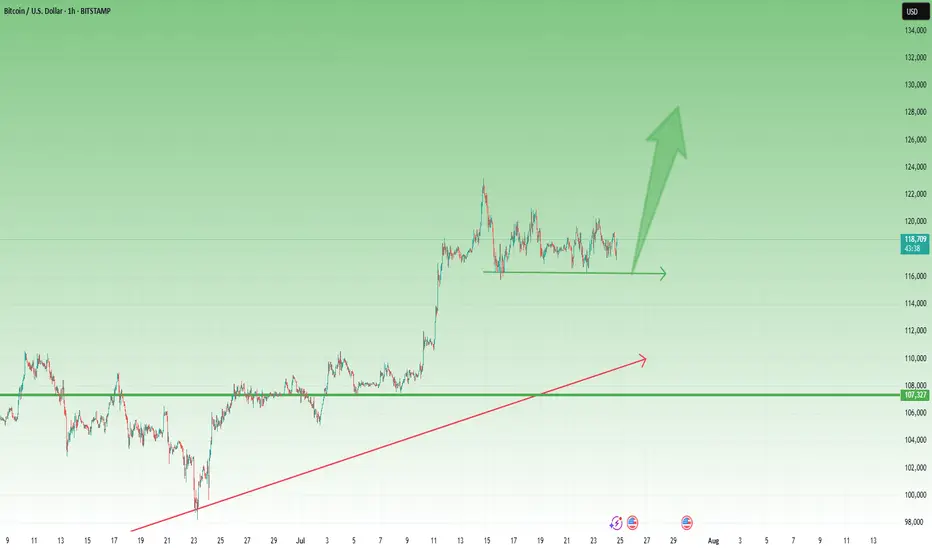
BTCUSD support retest at 114,850 The BTCUSD remains in a bullish trend, with recent price action showing signs of a corrective pullback within the broader uptrend.
Support Zone: 114,850 – a key level from previous consolidation. Price is currently testing or approaching this level.
A bullish rebound from 114,850 would confirm ongoing upside momentum, with potential targets at:
122,900 – initial resistance
124,420 – psychological and structural level
126,250 – extended resistance on the longer-term chart
Bearish Scenario:
A confirmed break and daily close below 114,850 would weaken the bullish outlook and suggest deeper downside risk toward:
112,860 – minor support
110,825 – stronger support and potential demand zone
Outlook:
Bullish bias remains intact while the BTCUSD holds above 114,850. A sustained break below this level could shift momentum to the downside in the short term.
This communication is for informational purposes only and should not be viewed as any form of recommendation as to a particular course of action or as investment advice. It is not intended as an offer or solicitation for the purchase or sale of any financial instrument or as an official confirmation of any transaction. Opinions, estimates and assumptions expressed herein are made as of the date of this communication and are subject to change without notice. This communication has been prepared based upon information, including market prices, data and other information, believed to be reliable; however, Trade Nation does not warrant its completeness or accuracy. All market prices and market data contained in or attached to this communication are indicative and subject to change without notice.
BTC Bearish DivergenceBINANCE:BTCUSDT
Rezistance Levels: 123,217.39.
Support: 98,299.89
Trade Setup:
Target 1: 110,758.64 (0.50 Fibonnaci Golden Zone).
Target 2: 107,818.37 (0.618 Fibonnaci Golden Zone).
Target 3: 103,632.23 (0.786 Fibonnaci Golden Zone).
Target 3: 98,299.89 (1 Fibonnaci).
Stop Loss: 123,217.39 (above recent high, ~25% above current price).
RSI Analysis: The RSI shows a bullish divergence (price making lower lows while RSI makes higher lows), suggesting potential upward momentum. Current RSI is around 62.80, nearing overbought territory (>70), so caution is advised.

BTC – Bulls still in controlBTC is trading around 117,800 USD, well above both the EMA 50 (111,800) and the pivot level (105,300), confirming bullish dominance. Price remains below the upper Bollinger Band (123,400), leaving potential room for continuation.
Momentum stays constructive, with RSI at 60 and MACD in a strong positive zone, reflecting sustained upward pressure. As long as price holds above EMA 50 and pivot, the next upside targets lie at 123,400 and R1 at 110,000 has already been surpassed.
Volume has dropped significantly (-31%), suggesting the latest move could lack conviction or represent a pause rather than a breakout.
As long as BTC holds above 111,800, the bullish scenario remains intact.
Watch for any rejection near 123,400 or a close back below the EMA as potential invalidation signals.

BTCUSD BUBBLE ABOUT TO BURST LOL ??? SELL SELL SELLLong term BTCUSD looks like BIG PLAYERS ARE TAKING PROFIT (about to dump this to retailers lol)
I see 15m signal sell with very good risk reward
BTCUSD its ready for correction i dont beleave we will see any NEW HIGHS from here
Let see how will pay out, only time will tell
Thanks

A Legends Continuation. BTCHello I am the Cafe Trader.
Today we are going to look at a trade inspired by the Legendary Trader and Scalper Al Brooks.
If you are not familiar with him I recommend having a strong foundation with price action before giving him a look.
It's no secret that BTC is at levels many thought it would never reach, and yet many others are convinced of 5 - 10x more from this run alone. It can be crushing to feel like you missed out on the move, so instead of getting FOMO, I've detailed a guide to help you in the short or the long term.
Long Term
As of right now you are looking at 4 different levels of demand. It is up to you to measure your conviction, understanding why you want to invest, and how much you are willing to risk. Recognize that Many Big hedge funds have been hesitant with accumulating hoards of Crypto do to its volatile nature, considering it too risky.
So with this in mind, I have given you 4 levels to add BTC to your long term depending on your personal conviction.
Hyper Aggressive = Top of Demand $115,500 (willing to risk 50%)
Aggressive = Demand $99,500-101,250 (willing to risk 40%)
Fair Price = Strong Demand $74,000 - 78,000 (willing to risk 25%)
Steal = Extreme Demand $42,000 - 50,800 (willing to risk 10%)
Thinking about how much you are willing to risk will help you level out your Fear of missing this move, and get pricing that meets your personal demand.
Short Term
My fellow traders, this is a nugget (inspired) from Al Brooks. The "Two Bar Trend Break" .
In a strong trend (not in a range), When you get a trend break (I like to go top of wick to top of wick for this trade), if the second bar doesn't have a huge topping tail, but closes near the top, you can enter this trade.
Here is a trade that happened this month That hasn't filled yet (it got close).
Entry At the close of the second green candle $116,000.
Measure the bottom of the First candle that broke (called the Signal candle) to the top of the second bar that broke (called the Entery Candle). If you take that measurement, and add it to your take profit, you will have a 1R Scalp (1 measure of risk to 1 measure of reward).
This isn't a true scalp, typically they should be in the same bar or next bar, but this follows similar principles.
That's all for BTC, stay tuned for more analysis as we go over Ethereum, XRP, and one more of your choosing.
Happy Trading!
@thecafetrader

BITCOIN BULLYING Bitcoin hit take profit previously and now I will be looking at another buy within this trend and price action combined with patterns

BTC/USD – Strong Buy Opportunity from Demand Zone BTC/USD – Strong Buy Opportunity from Demand Zone
🟢 Technical Outlook:
Bitcoin (BTC/USD) has tapped into a well-defined Demand Zone near 115,000–116,000, showing early signs of a potential bullish reversal. This level aligns with key liquidity zones, smart money concepts, and price inefficiencies — offering high-probability long setups.
🧠 Key Technical Highlights:
🔻 Equal Lows + Sell-Side Liquidity:
Market swept equal lows, grabbing liquidity below support — a common institutional setup before a bullish push.
✅ Break of Structure (BOS):
A prior BOS indicates a shift from bearish to bullish structure after liquidity collection.
📉 Fair Value Gap (FVG):
Price created and respected an FVG after the BOS, validating bullish intent.
📊 Imbalance Filled:
A prior price inefficiency has now been filled, completing a clean move from imbalance back into structure.
📈 Target Zone: 119,000 USD
Marked as the logical next stop — sitting near prior resistance and a liquidity zone.
🎓 Educational Insight:
This is a textbook Smart Money Concept scenario:
Sell-side liquidity sweep
Demand zone tap
Imbalance rebalancing
Shift in market structure
It shows how institutions often engineer liquidity grabs before a large directional move.

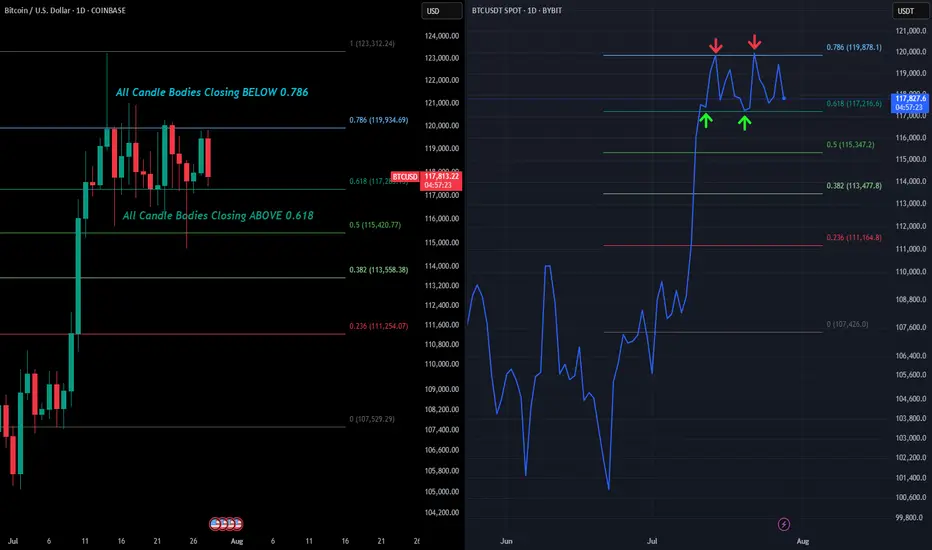
BTC - 1D RangeboundIf you saw our recent post on the warning signs of BTC's weekly chart, we are now going to zoom into the daily and examine how that structure will be decided.
For the last 2 weeks BTC's daily price action has been rangebound between 2 very important levels. The 0.786 (as we have been outline for the past couple weeks) and the 0.618.
So far every rejection (wick high) has happened around the $120.4k level. This is the 1.618 extension target we have had outlined for a while.
And if you look at the actual candle bodies, each has closed below that 0.786 confirming the rejections. The only way to negate this would be to close a daily candle ABOVE the 0.786 which would be over $120k on the Binance chart.
What we have also seen is bulls holding strong support at the 0.618. Everytime we wick below bulls quickly buy it up thus creating our range.
This can clearly be seen by the line chart we have added on the right. The line chart only takes into account candle body closes which shows the perfect bounces between support and resistance.
However if we close a daily candle below the 0.618 $117.2k then that would signal lower price action tests are likely to ensue. Will update this post once we get the confirmation breakout or breakdown from this micro range.
BTCUSD – Bulls Still in Control After New ATH 🔸 After the new All-Time High printed 10 days ago, Bitcoin entered a consolidation phase. So far, the market looks healthy and seems to be waiting for a trigger to continue the uptrend.
🔸 A clear support zone has formed around 116k, and as long as this level holds, bulls remain in full control of the market.
📉 For short-term traders and speculators:
Buying dips near 117.5k could offer solid risk/reward setups, with a target around 125k in case of a breakout.
Let’s see if the market gives us the trigger we’re waiting for. 🚀

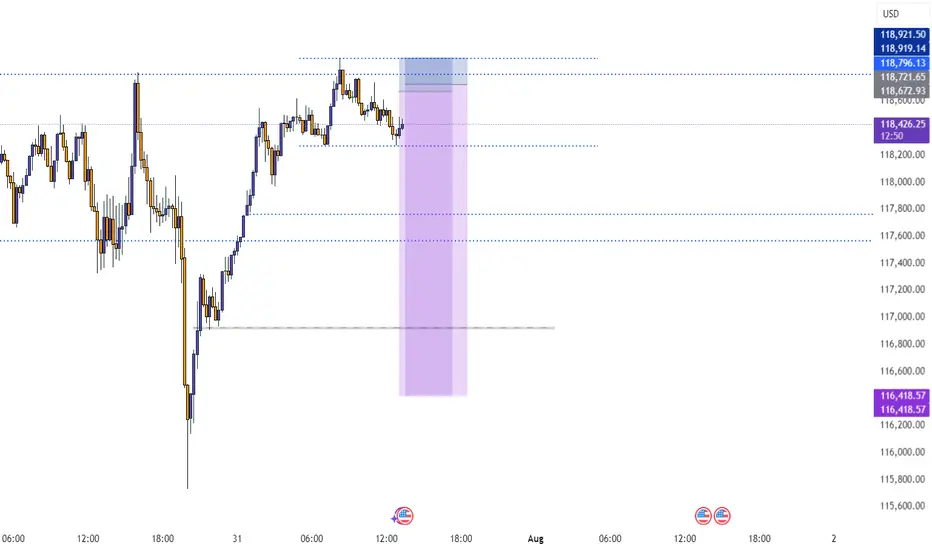
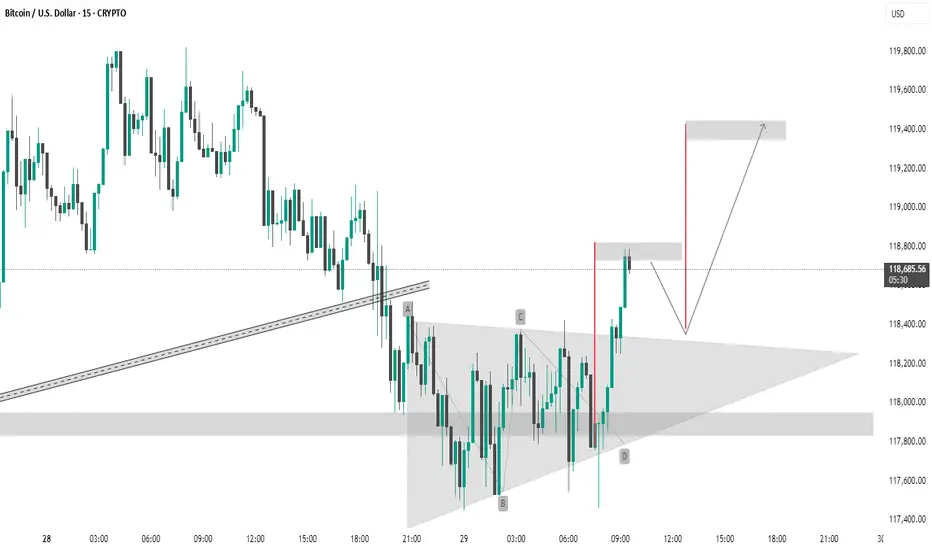
BTC #This Bitcoin (BTC/USD) 15-minute chartThis Bitcoin (BTC/USD) 15-minute chart shows a symmetrical triangle breakout. The pattern labeled A-B-C-D indicates consolidation within the triangle, followed by a bullish breakout. The price has broken above the upper trendline and is approaching the resistance zone around 118,800–119,400 USD. The chart suggests two scenarios:
Immediate breakout to the 119,400 resistance.
Short-term pullback to retest the breakout zone (~118,600), followed by a continuation to 119,400.
The setup implies a bullish bias with a potential upside target around 119,400 USD.
thanking you
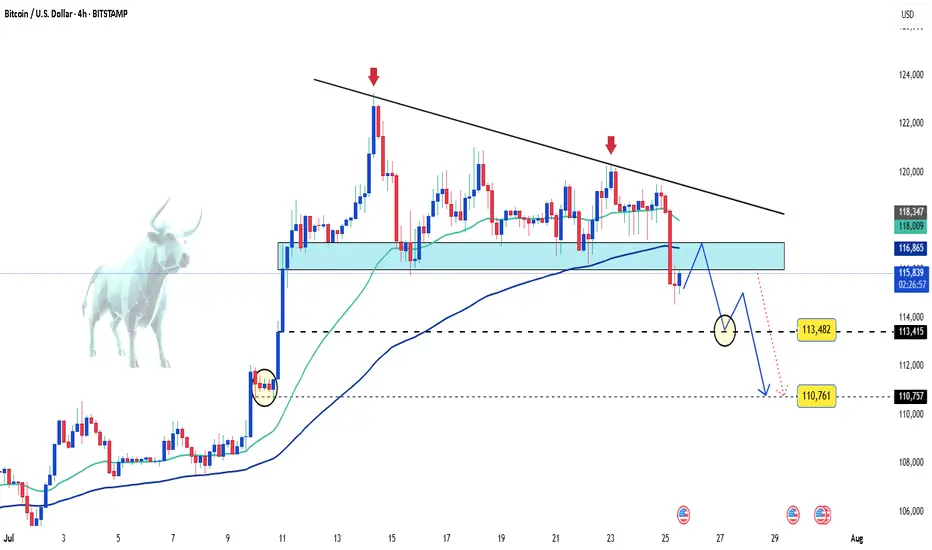
Bitcoin on the edge – Is a sharp drop coming?Bitcoin is keeping investors on edge as price action remains volatile and primed for an explosive move once news or capital flows ignite the market.
🌍 Latest market updates:
– Whales are back in accumulation mode, with on-chain data showing large wallets growing rapidly.
– The U.S. government has just transferred a significant amount of BTC to exchanges — is a dump coming?
– U.S. spot Bitcoin ETFs are witnessing record inflows after CPI came in lower than expected, fueling hopes that the Fed will pause further rate hikes this year.
📉 Technical outlook:
– On the H4 chart, BTC formed a tightening wedge pattern, which has now broken to the downside.
– A steep drop toward the 113,000 to 110,000 USD zone is entirely possible.
This looks like a classic break-retest setup — a golden window for strategic entries. If sell volume surges, it could be the perfect moment for bears to strike.
Stay sharp — and good luck!
BTCUSD IdeaWe are waiting for our asset to reach our action zone, and based on the reaction, we’ll decide on our next moves.ALWAYS WAIT FOR A CONFIRMATION TO SEE IF THE PRICE VALIDATES THE ZONE.and you what is your vision of the EURUSD its interests me! i wait you in the commentary