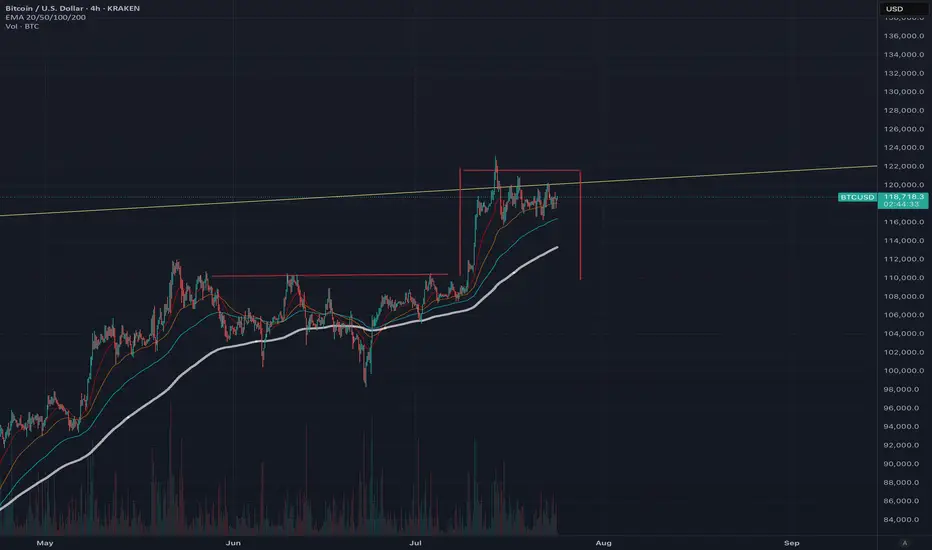
btc parabolic curvebitcoin parabolic curve pattern exits the base3 accumulation area and continues to rise sharply, with more to come
BTCUSD.P trade ideas


Beyond ICT & SMC: The Mathematical Revolution in Zone TradingIn the world of trading, there's a fundamental divide between traders who rely on subjective interpretation and those who trust mathematical precision. While concepts like ICT (Inner Circle Trader), SMC (Smart Money Concepts), and naked chart analysis have gained popularity, they all share one critical flaw: they're based entirely on personal interpretation.
The Subjectivity Problem
Ask ten ICT traders to mark their Order Blocks, Fair Value Gaps, or Breaker Blocks on the same chart, and you'll get ten different answers. Why? Because these concepts rely on:
Personal bias in identifying "significant" levels
Subjective interpretation of market structure
Discretionary decision-making on what constitutes a valid setup
Emotional influence on analysis
The same issue plagues SMC, CRT (Candle Range Theory), time-based analysis, and naked chart trading. One trader's "liquidity grab" is another trader's "breakout." One person's "strong support" is another's "weak bounce zone."
The Mathematical Solution
This indicator eliminates this guesswork entirely. Instead of relying on subjective interpretation, it:
Calculates exact entry levels using mathematical formulas based on session params
Identifies precise support/resistance zones
Standardises signals across all timeframes, ensuring consistency whether you're on 1m or 15m charts
Removes emotional bias by using algorithmic detection of significant price levels
Numbers Don't Lie
While an ICT trader might debate whether a level is "mitigation" or "inducement," our indicator simply states: "Entry at 1.0847, Stop at 1.0832." No interpretation needed. No second-guessing. Just mathematical precision derived from actual price action.
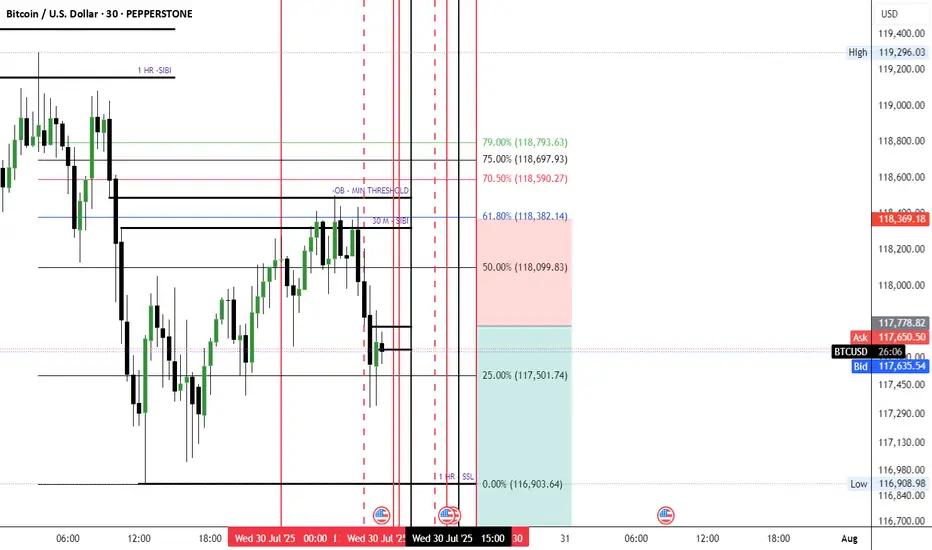
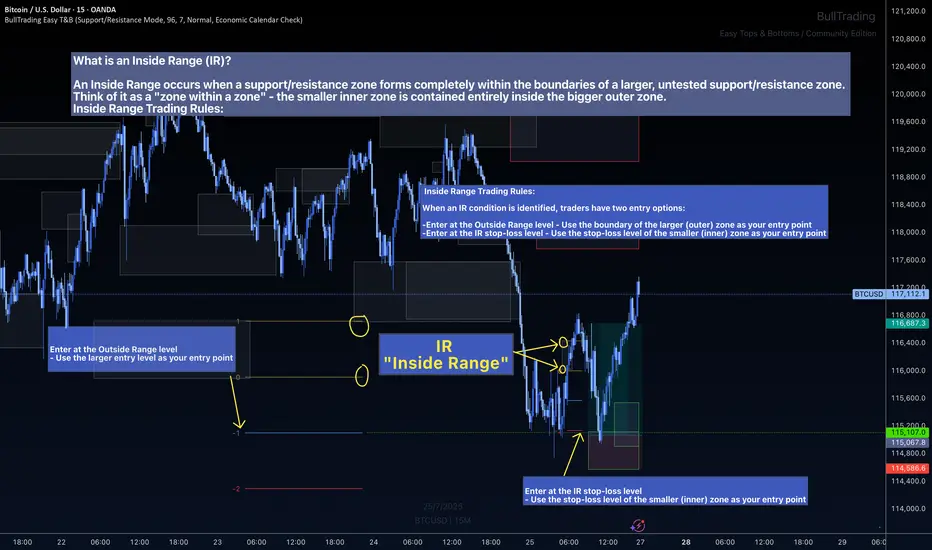
The Inside Range Advantage: When Zones Within Zones Create Superior Trading Opportunities
Most traders miss one of the most powerful setups in technical analysis: the Inside Range (IR). While ICT traders debate "nested order blocks" and SMC followers argue about "refined zones," you can easily identify Inside Ranges with this indicator and mathematically identify these high-probability setups with zero ambiguity.
What Makes Inside Ranges Special?
An Inside Range occurs when a new support/resistance zone forms completely within an untested larger zone. Think of it as the market revealing its hand twice – first showing you the broader area of interest, then pinpointing the precise level within it.
The Mathematical Edge
While discretionary traders struggle to identify these setups consistently, this indicator:
Automatically detects when a smaller zone forms within a larger untested zone
Calculates two precise entry options without any guesswork
Eliminates the confusion of nested levels that plague subjective analysis
Two Entries, Zero Confusion
Documentation and full trading system instructions can be found on the indicator's publication
When an IR forms, the indicator provides exactly two mathematically-derived entry options:
The Outside Range entry – Using the larger zone's entry level
The IR Stop-Loss entry – Converting the inner zone's stop level into an entry point
Compare this to SMC's "refined OB" or ICT's "nested FVG" concepts where traders endlessly debate which level is valid. With Inside Ranges, there's no debate – just two clear, calculated levels.
Inside Ranges represent areas where institutional interest overlaps. The larger zone shows initial interest, while the smaller zone within reveals refined positioning. By mathematically identifying these setups, you're trading where smart money has shown its hand twice.
Real Consistent Precision
Instead of squinting at charts trying to identify subjective "zones within zones," let mathematics do the heavy lifting.
In trading, consistency beats creativity. Stop drawing arbitrary lines and hoping for the best. Start trading with mathematical precision.
Documentation and full trading system instructions can be found on the indicator's publication →
Trade with confidence. Trust in mathematics. Trust in your Edge.
BTCUSD has boken up Trendline and SupportBTCUSD has boken up Trendline and Support, It may retrace futhur before regaining bullishness.

BTCUSD long my predict up to 128100
long possible entry 115150
take profit 128100
stop loss 113000
swing long

Major test for crypto bulls - BTC and ETH Bitcoin has dipped below $118,000, putting pressure on the bullish structure that’s held for the past two weeks.
The attempted breakout above $121,000 has failed, and price is now breaking down through the middle of the consolidation range, threatening short-term higher lows. On the 4H chart, this move resembles a failed breakout with a potential double-top near $121,000.
If Bitcoin can’t reclaim $116,000 quickly, the next downside levels to watch are $114,000 and $110,000.
Ethereum, meanwhile, has stalled just below $3,800 after a strong rally this month. Price action has flattened out over the past few days, with several failed attempts to push through that level. The key upside trigger remains $4,000.
But if $3,700 gives way, ETH may slide back to the $3,450–$3,300 region, where previous resistance and the rising trendline converge.
Where exactly is the most probable bottom of BTC for this cycle?This is the analysis based on the following data points
1. Monthly historical price action
2. Monthly Fibonacci Channel
3. Monthly Fibonacci Extension
4. EMA50 (Monthly)
5. RSI
We have been analyzing long term BTC price movements accurately since December 2021. Now that BTC is in sideway again, we are going to analyze the possible next moves. To be honest, current market is the hardest to analyze for us. There are mixed signals on the chart. We will try to provide as much information and perspectives as we can.
We will start with the Fibonacci extension which we have drawn based on monthly swing high/low. And zoomed in as a daily chart. Below you can see that the price bounced back exactly at 0.618 line of the fib extension. If you look at the Monthly chart above, it just touched monthly 50EMA line that day too. Coincidence? If we hit that golden pocket again and restart the bull run again, I won’t be surprised.
However, there is still a chance that we will go down further.
Let’s look at the monthly chart above for that assumption.
If we look at 2014/2015, 2017/2018, and 2019/2020 price actions, we are very near our maximum pain level. We are already in 6 months with -63% from the top. It also aligned with what we have suggested in our RSI based analysis here .
If we combine that two data points with the fib channel, we conclude that the area of fib channel golden pocket should be the bottom for this cycle. It will be -73% from the top. RSI monthly will also hit the bottom line.
One thing to note is that if we are going to break below that golden pocket, we will be looking at one of the worst bear market in the history.
Good luck.

Bullish bounce off swing low support?The Bitcoin (BTC/USD) is falling towards the pivot and could bounce to the 1st resistance.
Pivot: 115,415.51
1st Support: 113,466.96
1st Resistance: 120,573.43
Risk Warning:
Trading Forex and CFDs carries a high level of risk to your capital and you should only trade with money you can afford to lose. Trading Forex and CFDs may not be suitable for all investors, so please ensure that you fully understand the risks involved and seek independent advice if necessary.
Disclaimer:
The above opinions given constitute general market commentary, and do not constitute the opinion or advice of IC Markets or any form of personal or investment advice.
Any opinions, news, research, analyses, prices, other information, or links to third-party sites contained on this website are provided on an "as-is" basis, are intended only to be informative, is not an advice nor a recommendation, nor research, or a record of our trading prices, or an offer of, or solicitation for a transaction in any financial instrument and thus should not be treated as such. The information provided does not involve any specific investment objectives, financial situation and needs of any specific person who may receive it. Please be aware, that past performance is not a reliable indicator of future performance and/or results. Past Performance or Forward-looking scenarios based upon the reasonable beliefs of the third-party provider are not a guarantee of future performance. Actual results may differ materially from those anticipated in forward-looking or past performance statements. IC Markets makes no representation or warranty and assumes no liability as to the accuracy or completeness of the information provided, nor any loss arising from any investment based on a recommendation, forecast or any information supplied by any third-party.

BTC #Bitcoin (BTC/USD) 30-minute chart shows a recent breakThis Bitcoin (BTC/USD) 30-minute chart shows a recent breakout above a descending trendline (red) and an ascending wedge pattern. Price has broken out of a rounding structure, indicating a potential bullish reversal. The breakout candle is strong, suggesting bullish momentum. Key resistance lies near 120,000 (blue horizontal line), while support is around 115,600. Watch for confirmation of the breakout with volume or a retest of the breakout level for sustained upward movement.
thanking you

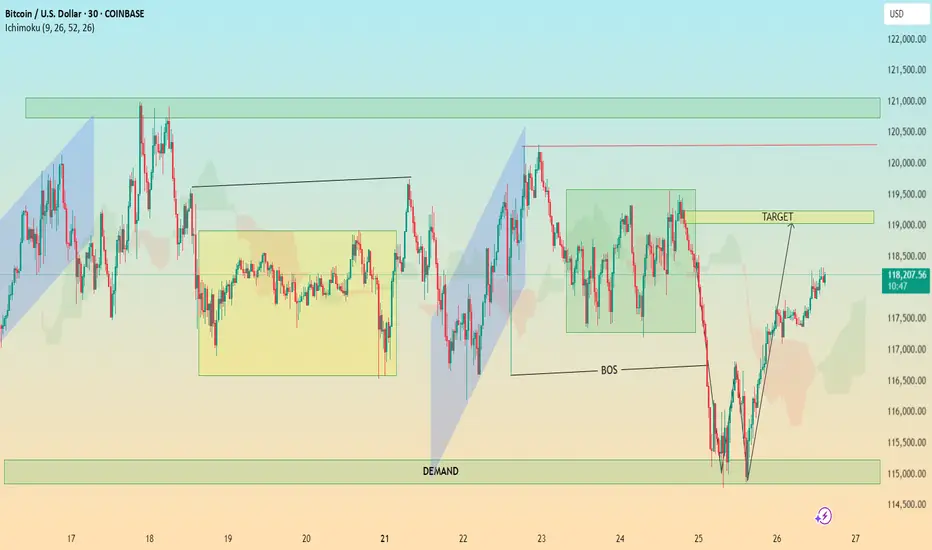
BTC In-Depth Technical Analysis: BTC/USD (30-Min Chart)🔍 In-Depth Technical Analysis: BTC/USD (30-Min Chart)
🟩 1. Demand Zone Reaction
Location: ~$114,500 – $115,500
Significance:
Price sharply reversed after a strong move into this demand zone.
This zone coincides with a liquidity grab below previous lows — textbook Smart Money trap.
Volume (if checked) would likely spike here, indicating institutional interest.
✅ Interpretation: Institutional demand stepped in, absorbing sell orders and triggering a reversal.
📉 2. Break of Structure (BOS)
Zone: Around July 24–25
Price broke below a key higher low, signaling temporary bearish structure.
However, this was quickly reclaimed after demand zone reaction — suggesting a fakeout BOS or a liquidity sweep.
✅ Interpretation: BOS caused shorts to enter, but reversal suggests a bear trap and continuation higher. The BOS served to fuel a more aggressive bullish rally.
🎯 3. Target Zone
Marked Target: ~$118,900–$119,200
Why This Area?
It aligns with a previous consolidation zone / supply before the sharp drop.
Also overlaps with Ichimoku cloud resistance and previous highs — strong confluence.
✅ Interpretation: Price is likely to face resistance here. If broken with strong momentum, bullish continuation to the next supply zone (~$121K) is possible.
⛓️ 4. Market Structure Analysis
Higher Lows Forming after demand reaction.
Price is forming a bullish market structure with an ascending wave pattern.
A break and retest of the $119K zone could lead to a mid-term rally.
Failure to break could result in:
A pullback to the $117,000 area
Or a deeper retest of the demand zone
✅ Trading Plan Options:
Bullish Bias: Buy pullbacks above $117,000 with $119,000 as target
Bearish Bias: Wait for strong rejection at $119,000 to short back to $115K
☁️ 5. Ichimoku Cloud Insight
Price has moved above the cloud, suggesting momentum shift to the upside.
The cloud is twisting bullish, supporting short-term bullish trend.
However, flat Kumo tops around $119K = likely rejection zone.
✅ Interpretation: Ichimoku confirms bullish potential, but price must close above the cloud + $119K zone to sustain trend.
📌 Key Takeaways for Publishing
Chart Idea Title:
“BTC/USD Demand Zone Reversal | Break of Structure & $119K Target in Sight”
Summary Description:
Bitcoin has reclaimed bullish momentum after a sweep into the $115K demand zone. A break of structure triggered shorts, but demand absorption led to a sharp reversal. Now, price is approaching the key $119K supply zone — a critical level that could determine if this is a short-term rally or the beginning of a new trend. Watch for either a clean breakout or a rejection for a possible retest of $117K or lower. Confluence from Ichimoku, BOS, and market structure support the analysis.
going lower or bouncing on resistance? market is respecting key support/resistance or channel boundaries. These points often become decision zones where big moves occur.
Signs this could be a fakeout:
BTC wicks above a resistance or below a support with little follow-through
Volume spikes only on the wick, then dies quickly
Price reverses back into the range soon after breaking it
If BTC recently broke a trendline with low volume, it smells like a trap move — a liquidity grab.
If it’s testing support again after failing to rally, and volume is increasing on red candles, a leg down is possible.
However, macro trend is still up unless we lose a major higher low (say, sub-$60k or sub-$56k depending on your chart).

The price re-entered the supply and showed signs of rejectionPrice is reacting from a supply zone marked in grey, suggesting potential short (sell) opportunity.
A clear Change of Character (ChoCH) is visible, indicating a possible shift from bullish to bearish structure.

Bart Simpson Pattern Forming? We are in Greed? A possible Bart Simpson pattern is forming, which typically indicates a market top and reversal, with a retest of <$109,000 very likely. This pattern could also create a bearish head and shoulders formation, strongly suggesting a near-term top.
Trading volume continues to decrease, and ETF inflows are now negative, with an increasing volume of BTC on exchanges indicating that sell pressure is mounting. In this situation, a flash crash is also quite likely, so be cautious about where you place your limit sell orders and stop losses..
Both short and long positions are currently low, suggesting there is a lack of direction in the market, whether up or down. This situation often occurs at the end of a bull run. While a push upward is a possibility, based on my analysis, I anticipate that this pattern will break down with an 80:20 probability. However, Bitcoin often challenges expectations and is famously unpredictable. However due to all the media hype and the rolling of capital into Alt coins and the dominance dropping I do believe we are very near the end of the bull run. This is not financial advice (NFA).
What's next for BTC?BTC is potentially forming a textbook bull flag with a measured target of $140k.
A solid break and retest of $120k would signal strength and a push towards the target.
Losing $114k or a strong close below it's current range support around $117k could signal a test of $110k as support - potentially great buy opportunities.

BTC/USD: Bullish Pennant Holds Above Breakout ZoneBitcoin is consolidating within a bullish pennant pattern just below the 120,000 level, following a sharp rally from the June lows. Price action has compressed between converging trendlines, forming higher lows and lower highs — a classic continuation formation in an uptrend.
Importantly, BTC remains well above prior resistance (now support) at 112,000, with both the 50-day SMA (109,837) and 200-day SMA (95,838) trending upward. This suggests strong medium- to long-term bullish structure.
Momentum indicators support the case for continuation:
MACD remains in positive territory, albeit with a slight bearish crossover, hinting at near-term indecision.
RSI is holding around 59.6, just below overbought, reflecting consolidation rather than distribution.
A breakout above the pennant resistance and psychological 120,000 barrier would likely trigger renewed bullish momentum, targeting fresh highs. Conversely, a breakdown below 116,000 could expose 112,000 as a key retest zone.
Bias: Bullish continuation favored while above 112,000. Watch for breakout confirmation from the pennant.
-MW

BTC on 4H
"Hello, focusing on BTC on the 4-hour chart, the price is currently in a bullish momentum on higher time frames. However, it is showing signals indicating a potential completion of its pullback to the $110,000 zone. In my opinion, the $122,000 zone could be a good area to consider a sell position, with confirmation on the 15-minute chart. I plan to wait for this zone and then decide on initiating a sell position. If you have any updates or alternative perspectives on this analysis, please feel free to share."
If you need further clarification or have more details to discuss, please let me know!

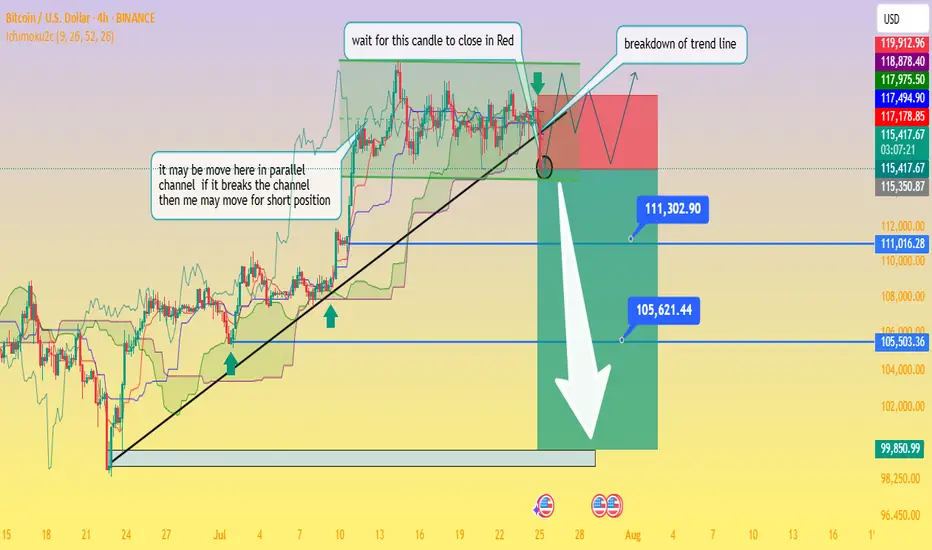
Critical Breakdown: BTC/USD Poised to Fall — Waiting on H4 CloseAnalysis of the BTC/USD 4‑Hour Chart
From the chart you provided, here's how the technical situation looks:
Ascending trendline support has been tested multiple times and was recently breached this afternoon, signaling a possible shift from the bullish setup to a bearish continuation.
The price is now trapped within a descending triangle formation beneath a well‑defined swing high resistance zone. This reflects indecision in the market, with neither buyers nor sellers in clear control
Business Insider
+15
Fxglory Ltd
+15
Bitcoin News
+15
.
Key levels to monitor:
Support zone: ~$115,500, extending down to ~$111,300 and ~$105,600 as deeper targets if bearish momentum strengthens.
Resistance zone: ~$119,000–120,000 area, forming strong overhead supply
Economies.com
DailyForex
Bitcoin News
.
The chart’s annotations align with a classic breakout strategy—with the caveat: wait for a confirmed close below the trendline before considering short positions (as noted in your “wait for this candle to close in red” comment).
Breakout confirmation would likely pave the way toward your indicated profit zones near ~$111k and ~$105k, with a larger potential down to ~$99.8k if further downside pressure builds.
🔍 What the Broader Market Signals
Technical sentiment from sources covering today’s analysis shows BTC/USD hovering just under $120,000, stuck within the defined range of $115.5k support to $120k resistance
Economies.com
.
While there’s still neutral momentum in indicators like RSI and MACD, the short-term direction leans bearish if the breakdown is confirmed on the H4 timeframe
Fxglory Ltd
.
Analysts emphasize that sustained movement above $116.5k could retarget resistance near $119–120k. A failure there and a move below $115.5k may thrust price deeper toward your downside zones
DailyForex
.
✅ Trading Strategy Overview
Scenario Trigger Target Levels
Bearish Breakdown H4 candle closes below trendline ~$115.5k $111.3k → $105.6k → possible $99.8k zone
Bullish Rejection Bounce back above ~$116.5k and trending above resistance $119k–120k retest, potential breakout if sustained
Neutral / Wait-and-see No decisive candle close yet Hold for confirmation
⛳ Final Thoughts
chart highlights a critical point: don’t act prematurely. Wait for a decisive H4 candle close below the trendline before committing to shorts. Confirmed bearish action around the breakout could open the path to the lower targets you identified. However, if price rebounds above support and climbs above $116.5k, a short-term retest of $119k–120k is still in range.
Traders should maintain prudent risk management—watching the unfolding price action around these pivot points without overreaching. Let me know if you'd like help crafting entry/exit zones or risk profiles for this setup!
Do you think I'm joking ???As I said, Bitcoin broke the triangle, and now with a slight price correction(109k), it could surge to $150k , and you still think I'm joking!!
Previous analysis

Eigen Labs CEO CriticalMilestone ReducesETH Scalability TradeoffIn a major leap toward next-generation blockchain infrastructure, Eigen Labs, the developer behind EigenLayer, has announced the achievement of what its CEO describes as a “critical milestone” in the evolution of Ethereum scalability—reducing the long-standing trade-off between decentralization, security, and performance.
Speaking at the Ethereum Scaling Summit in Seoul, Eigen Labs CEO Sreeram Kannan unveiled the platform's updated modular architecture, which enables “restaked security” for a broad spectrum of Layer 2 networks and decentralized applications.
“Scalability without compromise has always been the holy grail,” Kannan noted. “This milestone changes the calculus—we no longer have to sacrifice decentralization or security for throughput.”
The Challenge: Balancing the Blockchain Trilemma
Since its inception, Ethereum has faced the so-called blockchain trilemma: optimizing only two out of three key elements—security, scalability, and decentralization. While Layer 2s such as Arbitrum and Optimism address throughput, they often introduce trade-offs in validator assumptions or operational complexity.
EigenLayer aims to address this through a novel re-staking mechanism, which leverages the security of Ethereum’s mainnet by allowing ETH stakers to “re-stake” their assets to secure other networks and services.
This innovation could radically expand Ethereum’s trust footprint without duplicating infrastructure or introducing centralized checkpoints—a persistent issue with several scaling models.
Institutional Interest and Market Significance
Venture capital and institutional crypto funds are watching closely. In Q2 2025, Eigen Labs closed a $100M Series B round, with participation from a16z, Polychain, and Jump Crypto. The firm’s long-term roadmap includes interoperability modules that will allow Ethereum-based Layer 2s to share consensus and security guarantees—a breakthrough for composability and capital efficiency.
“EigenLayer is fast becoming a backbone protocol,” says Nadia Liu, a partner at crypto VC firm Framework Ventures. “By minimizing fragmentation, it unlocks value across the entire Ethereum ecosystem.”
What It Means for Developers and Enterprises
For developers, EigenLayer offers a plug-and-play model for building secure applications without launching bespoke validator sets. For enterprise clients, the appeal lies in a more cost-efficient, composable Web3 stack, opening the door to scalable DeFi, gaming, and tokenized asset platforms.
Kannan emphasized that several pilot integrations are already underway with major DeFi protocols and data availability layers. While he did not name them, sources close to the matter hint at collaborations with StarkWare, Celestia, and Coinbase’s Base.
Looking Ahead
The broader implications of EigenLayer’s progress are hard to overstate. If adopted at scale, the protocol could standardize how Ethereum-based projects achieve security, replacing fragmented systems with a unified, market-driven security layer.
With this milestone, Eigen Labs may have just shifted the scalability conversation—from a compromise-based model to one of scalable consensus as a service.
“The modular era is here,” Kannan concluded. “And it's one that doesn’t ask builders to choose between performance and principles.”

BTC / USD Daily ChartHello traders. This chart is for leveraged Bitcoin traders. Anyone freaking out about what Bitcoin will do should know that this dip now is only about a 10% dip or so from the ATH. We could easily shake out all the long positions in profit by revisiting the area marked on the chart. These temporary dips are for buying, not for getting taken out. Never forget that in order for you to win a trade using a leveraged account, someone or some entity must lose a trade. So it's better to try and ride the wave and trade the trend than to think we can outsmart algolorithmic stop loss hunting programs designed to take your profits. Better to DCA Bitcoin and Ethereum than to take chances of blowing your account on a perfect, yet volatile asset like BTC. Big G gets my thanks. Be well and trade the trend. Happy Friday.

BTCUSD lower toward <113,000-ishI think we are in an Elliotwave A-B-C-D-E pattern, whereas E is delevoping. Price target toward $112,319 - $113,925
From a daily perspective, we can go as lower towards the $95k's...but let see where the next few days takes us.
I'm wrong is we break/close $119,826

BTCUSDBTCUSD is correcting for more upside, last drop can happen just to complete the structure before upside starts again.
Disclosure: We are part of Trade Nation's Influencer program and receive a monthly fee for using their TradingView charts in our analysis.