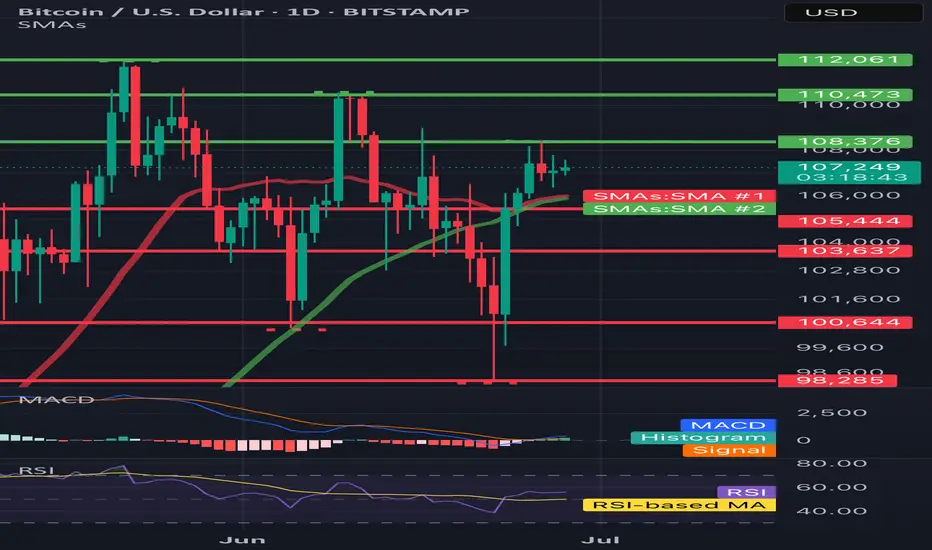
BTC/USD 1DHello everyone, let's look at the 1D BTC chart to USD, in this situation we can see how the 3rd peak formed us and we are currently fighting to maintain the price or a potential output up if we do not see a try to break out, you can expect a stronger relief.
However, let's start by defining goals for the near future the price must face:
T1 = 108376 $
T2 = 110473 $
Т3 = 112061 $
Let's go to Stop-Loss now in case of further declines on the market:
SL1 = 105444 $
SL2 = 103637 $
SL3 = 100644 $
SL4 = 98285
Looking at the RSI indicator, we see
As we entered the upper part of the indicator again, however, there is still a place to try to grow.
BTCUSD.PM trade ideas
Market next target ⚠️ Disruption & Analytical Weaknesses:
1. Support Zone Already Broken (Wick Penetration):
The candlestick wick clearly pierced the support level drawn on the chart.
This indicates that buyers are weak at that level — the support is not holding firmly.
Relying on this support for a bullish bias is risky, as it may soon turn into resistance.
2. Volume Confirms Weakness, Not Strength:
The bounce from the support zone happens on low or declining volume, suggesting lack of strong buying interest.
A legitimate bullish reversal should be backed by a volume surge — here, that’s absent.
3. False Sense of Recovery:
The analysis shows arrows projecting straight up to the “Target” level, implying a smooth bullish recovery.
This is unrealistic given the recent choppy price action and repeated failures to hold gains above 107,200.
Price action suggests uncertainty or distribution, not clean bullish momentum.
4. Tight Range and High Volatility Ignored:
Price has been ranging between ~106,400 and ~107,600 with rapid whipsaws.
This kind of structure is often indicative of indecision, and setting a clear directional target without breakout confirmation is premature

BTCUSD Short setup on the 30-min chart#BTCUSD Short setup on the 30-min chart.
Resistance holding strong.
> Entry: ~$107,140
> SL: $107,815
> TP: $105,437
> What are your thoughts? #Bitcoin #Crypto #TradingView

symmetrical triangle in progressBitcoin has been consolidating at this level for several weeks, easing some of the pressure in order to push above 120K. As of today, we have a clear formation—a large symmetrical triangle—which confirms the continuation of the upward trend and rules out any possibility of returning to lower levels.

Bullish bounce?The Bitcoin (BTC/USD) is falling towards the pivot and could bounce to the pullback resistance.
Pivot: 103,943.66
1st Support: 101.141.44
1st Resistance: 108,761.68
Risk Warning:
Trading Forex and CFDs carries a high level of risk to your capital and you should only trade with money you can afford to lose. Trading Forex and CFDs may not be suitable for all investors, so please ensure that you fully understand the risks involved and seek independent advice if necessary.
Disclaimer:
The above opinions given constitute general market commentary, and do not constitute the opinion or advice of IC Markets or any form of personal or investment advice.
Any opinions, news, research, analyses, prices, other information, or links to third-party sites contained on this website are provided on an "as-is" basis, are intended only to be informative, is not an advice nor a recommendation, nor research, or a record of our trading prices, or an offer of, or solicitation for a transaction in any financial instrument and thus should not be treated as such. The information provided does not involve any specific investment objectives, financial situation and needs of any specific person who may receive it. Please be aware, that past performance is not a reliable indicator of future performance and/or results. Past Performance or Forward-looking scenarios based upon the reasonable beliefs of the third-party provider are not a guarantee of future performance. Actual results may differ materially from those anticipated in forward-looking or past performance statements. IC Markets makes no representation or warranty and assumes no liability as to the accuracy or completeness of the information provided, nor any loss arising from any investment based on a recommendation, forecast or any information supplied by any third-party.

BTC Looking for a Wave 2 Reset Before the Real MoveBITSTAMP:BTCUSD looks like it just wrapped a clean ABC correction and kicked off a fresh 5-wave impulse. We’ve probably topped out on wave 1 heading into the weekend, Stoch RSI is flashing overbought, price is hitting resistance just under 108.3K, and we’re also seeing some bullish divergence creeping in.
I’m expecting a pullback from here, ideally into that 0.5–0.618 retrace zone (103.2K–104.4K). That would line up well with the mid-channel and EMA support. From there, we could be set up for a proper wave 3 breakout (as long as we don't get any more surprise tariffs or wars).
Fed still leaning dovish into Q4, even with some Q3 inflation and tariff noise. Rate cut odds ramp into Sept/Dec, so bigger picture looks constructive. In my eyes, the longer the FED holds off on these cuts, the longer this cycle extends.
Key zones I’m watching:
Support: 105.3K > 103.2K > 100.8K
Resistance: 108.3K > 112K > 114.5K+
If we dip and hold structure, I’ll be watching for confirmation to load into wave 3.

Trading balanceTrading balance The price of the asset has rebounded from the balance zone. With the prospect of growth into the resistance zone.
SPY/QQQ Plan Your Trade For 6-24 : Post Market UpdateThis post-market update highlights the weakening volume while my primary proprietary modeling system continues to stay BULLISH.
The markets are really quite interesting right now. Weakening volume in this Gapping uptrend, today, suggests traders are not buying into the ceasefire between Iran and Israel.
Additionally, the move in metals suggests a PANIC phase has setup in the US markets.
This type of panic phase typically leads to selling of assets and moving capital into CASH.
I suggest traders continue to prepare for a moderate melt upward trend over the next few days - but be prepared for any potential breakdown (possibly trying to FILL THE GAP).
This market appears to be running on fumes.
While I believe Trump's policies will lead to a stronger bullish price trend over the next few years, these disruptions and the potential for consumers to pull away from spending/economic activity over the second half of 2025 is still very real.
Buckle up.
At this point, hedge your trades, move some capital into CASH and prepare for bigger price volatility as we move into July 2025.
Get some.
#trading #research #investing #tradingalgos #tradingsignals #cycles #fibonacci #elliotwave #modelingsystems #stocks #bitcoin #btcusd #cryptos #spy #gold #nq #investing #trading #spytrading #spymarket #tradingmarket #stockmarket #silver

BTCUSD Short Idea - Looking for further downsideBTCUSD (15m timeframe).
* Bearish Trend: Price has been respecting the downtrend line.
* Structure Break (ChoCh): Multiple 'ChoCh' (Change of Character) signals indicate a shift in market structure to bearish.
* Supply Zone Entry: I'm looking for a retest of the recent supply zone around 107,208 - 107,059 for a short entry.
* Stop Loss: Placed above the last significant high and supply zone around 107,861.
* Target: Aiming for 105,445, potentially lower, targeting previous lows and liquidity.
Always manage your risk! Let me know your thoughts."

Bitcoin H1 | Potential bounce off an overlap supportBitcoin (BTC/USD) is falling towards an overlap support and could potentially bounce off this level to climb higher.
Buy entry is at 106,532.50 which is an overlap support that aligns closely with the 23.6% Fibonacci retracement.
Stop loss is at 104,600.00 which is a level that lies underneath a swing-low support and the 38.2% Fibonacci retracement.
Take profit is at 108,808.50 which is a swing-high resistance that aligns with the 127.2% Fibonacci extension.
High Risk Investment Warning
Trading Forex/CFDs on margin carries a high level of risk and may not be suitable for all investors. Leverage can work against you.
Stratos Markets Limited (tradu.com ):
CFDs are complex instruments and come with a high risk of losing money rapidly due to leverage. 63% of retail investor accounts lose money when trading CFDs with this provider. You should consider whether you understand how CFDs work and whether you can afford to take the high risk of losing your money.
Stratos Europe Ltd (tradu.com ):
CFDs are complex instruments and come with a high risk of losing money rapidly due to leverage. 63% of retail investor accounts lose money when trading CFDs with this provider. You should consider whether you understand how CFDs work and whether you can afford to take the high risk of losing your money.
Stratos Global LLC (tradu.com ):
Losses can exceed deposits.
Please be advised that the information presented on TradingView is provided to Tradu (‘Company’, ‘we’) by a third-party provider (‘TFA Global Pte Ltd’). Please be reminded that you are solely responsible for the trading decisions on your account. There is a very high degree of risk involved in trading. Any information and/or content is intended entirely for research, educational and informational purposes only and does not constitute investment or consultation advice or investment strategy. The information is not tailored to the investment needs of any specific person and therefore does not involve a consideration of any of the investment objectives, financial situation or needs of any viewer that may receive it. Kindly also note that past performance is not a reliable indicator of future results. Actual results may differ materially from those anticipated in forward-looking or past performance statements. We assume no liability as to the accuracy or completeness of any of the information and/or content provided herein and the Company cannot be held responsible for any omission, mistake nor for any loss or damage including without limitation to any loss of profit which may arise from reliance on any information supplied by TFA Global Pte Ltd.
The speaker(s) is neither an employee, agent nor representative of Tradu and is therefore acting independently. The opinions given are their own, constitute general market commentary, and do not constitute the opinion or advice of Tradu or any form of personal or investment advice. Tradu neither endorses nor guarantees offerings of third-party speakers, nor is Tradu responsible for the content, veracity or opinions of third-party speakers, presenters or participants.

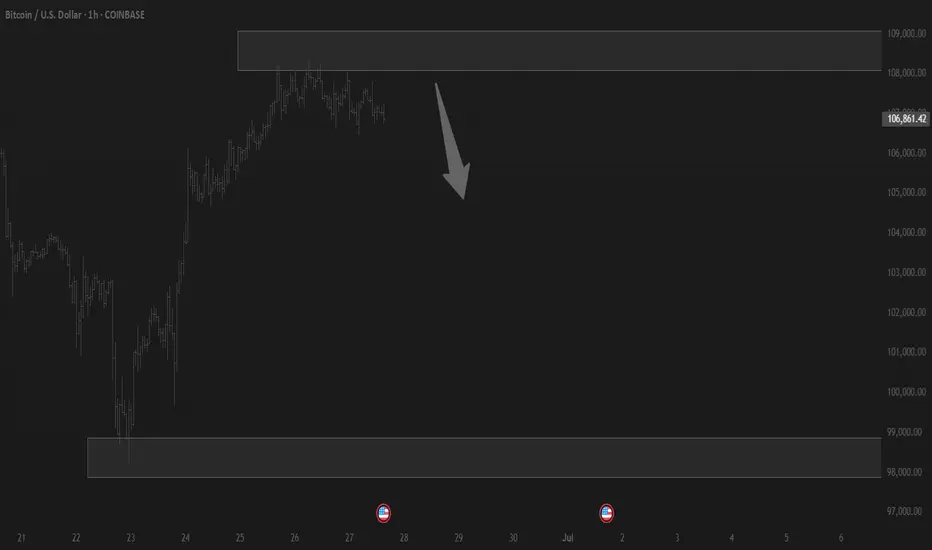
BTC Rebounds After 100000 Drop, Eyeing Short at 109500 Resistanc📈 BTC Rebounds After 100000 Drop, Eyeing Short at 109500 Resistance
BTC dropped below the 100000 threshold 🔻 and then rebounded near 98000 🔺. This movement is related to the decline of DXY and the reduction of geopolitical risks. Now, BTC is challenging the 110000 level 🔼. The overhead resistance is around 109500. First - time tests of the 110000 level typically trigger pullbacks, so we favor short positions here 📉
🚀 Sell@109500 - 108500
🚀 TP 107500 - 106500 - 105500
Accurate signals are updated every day 📈 If you encounter any problems during trading, these signals can serve as your reliable guide 🧭 Feel free to refer to them! I sincerely hope they'll be of great help to you 🌟 👇

Btcusd Prices To FallBitcoin (BTC) price remains steady above a key support level, trading slightly above $106,000 at the time of writing on Friday. The uncertainty looms as geopolitical tensions between Iran and Israel show no sign yet of an exit strategy from either side.

Could BTC Hit \$160,000 Before 2026?
As of **June 2025**, Bitcoin trades near **\$61,000**. But based on historical patterns, market signals, and macro trends, here’s a bold scenario that could unfold:
**📊 Key Signals:**
* The **2024 Bitcoin halving** cut new supply by 50%.
* **Institutional Bitcoin ETFs** now control over 6% of circulating BTC.
* **U.S. rate cuts** expected Q3 2025 could trigger a flood of new capital.
* **Global unrest** pushing investors toward alternative stores of value.
**🔥 Mind-Blowing Prediction:**
If Bitcoin follows even half of its average post-halving surge, we could see **\$150,000 BTC before March 2026**.
That’s a **+145% gain from today’s price** — within historical norms:
* 📈 2020 post-halving: +300%
* 📈 2016 post-halving: +600%
**⚠ Risks remain:** regulations, market shocks, or ETF outflows could stall momentum.
**✅ Bottom Line:**
If Bitcoin’s history repeats (or even rhymes), \$150k is not impossible — and 2025 could be the setup year.
#Bitcoin #BTC #CryptoPrediction #CoinMarketCap

BULISH ON BTChi .
this in my humble forcast for the BTC ATM
juste wait for confirmation in the zones i put and you can long

BTCUSD Massive Long! BUY!
My dear subscribers,
BTCUSD looks like it will make a good move, and here are the details:
The market is trading on 99659 pivot level.
Bias - Bullish
My Stop Loss - 97824
Technical Indicators: Both Super Trend & Pivot HL indicate a highly probable Bullish continuation.
Target - 10315
About Used Indicators:
The average true range (ATR) plays an important role in 'Supertrend' as the indicator uses ATR to calculate its value. The ATR indicator signals the degree of price volatility.
Disclosure: I am part of Trade Nation's Influencer program and receive a monthly fee for using their TradingView charts in my analysis.
———————————
WISH YOU ALL LUCK

1 Year of Bitcoin Bull Run Remaining? In the chart above, we’re analyzing Bitcoin’s historical cycles to see if the current cycle follows a similar pattern.
Bear Run (1 Year): In each of the last three cycles, Bitcoin experienced a bear market lasting exactly 1 year from the all-time high (ATH). This phase saw a significant drop in price as the market corrected.
Bull Run from Bottom (1,064 Days): In the last two cycles, once the bottom was established, Bitcoin entered a consistent bull market that lasted approximately 1,064 days. During this period, the price gradually climbed, eventually reaching new highs.
Current Bitcoin Cycle:
So far, the current cycle appears to be following the same pattern as previous cycles. We’ve already experienced a 1-year bear market after reaching the previous all-time high (ATH).
Currently, we have completed 2 years of a bull run from the bottom, aligning with the 1,064-day bull run observed in past cycles. Based on this historical pattern, we may have 1 year of bull run remaining, which could potentially push Bitcoin to new highs by late 2025.
If this trend continues, it suggests a strong opportunity for growth over the next year, mirroring the end phase of past cycles.
BINANCE:BTCUSDT BITSTAMP:BTCUSD CRYPTOCAP:BTC
Regards
Hexa

BTC LONG TP:108,000 24-06-2025Big green candle loading… 🚀
I’m looking to long between 105,300 and 105,800, targeting 107,800 – 108,300.
Clean setup with a 3.5 RR average, running on the 1-hour timeframe, expected to play out within 6 to 12 hours.
Technical context: The structure is primed — everything points to a big green candle coming. The setup is locked and ready.
If the move doesn’t happen within the estimated time, the trade becomes invalid.
We don’t use indicators, we’re not out here drawing lines or cute little shapes — I just give you a clean trade.

Bitcoin,when it’s all said and done.Bitcoin has no reason to revisit under 100k before a new high. Although markets are manipulated by large players often, it’s usually to change market sentiment for those who are over leveraged and ignorant of the whale games. If it were to wick down to below 100k, I strongly believe it will reverse violently to the upside surpassing ATH. There will be no WWIII. Believe in righteousness and give peace a chance.

Bitcoin Break: Watch 100K Revesal Or Test Of 95K.Bitcoin broke 100K support without any type of retrace attempt (YET). This move which is attributed to global events should not be entirely surprising. Most importantly do not OVERREACT, especially with all the nonsense hype this will generate. Here is a more effective way to process the current situation.
Avoid bias and pay attention to the bigger picture. In terms of wave count, Bitcoin can technically retest the 85K area and STILL be considered within a broader Wave 4. This implies the broader structure is still BULLISH (Wave 1 overlap). A swing trade or investing buying opportunity can develop in the 95K area or lower (see illustration).
The short term momentum is bearish as per break of 100K. This should guide shorter time frame strategies like day trades. A new bearish trend line is in play (see arrow). At this point without any meaningful reversal pattern in play (4H or above) look for bearish continuation patterns like consolidations (triangles) inside bars, etc. The 95K support would be a price objective to consider if you are open to aggressive short strategies. Keep in mind, shorting into such a low is HIGHLY risky and best suited for those who have adequate experience.
This situation proves once again, "expert" opinions mean nothing. A few short weeks ago, Bitcoin was poised to break out and everyone was going to be rich again (remember the Bitcoin conference?). So much for that. The market does NOT care what you, me or Michael Saylor thinks. It reflects the perception of the future, whether or not that future plays out.
This is precisely why CHARTS can offer value in terms of measuring potential and RISK. You don't even need to be that technical, just take a look at the weekly time frame. The previous week's bearish pin bar low was broken signaling weakness, NOT Bitcoin 100 million K.
Thank you for considering my analysis and perspective.

BTC LONG TP:106,600 24-06-2025We’re looking for a quick long from 104,500 to 105,100, aiming for targets between 106,400 and 107,100.
This move offers an average 4 RR on the 1-hour timeframe, and we expect it to play out within 12 to 16 hours.
Technical context: BTC still needs to reach the 107k area before showing signs of a reversal. This is a potential pre-drop pump setup.
Manage your stop-loss according to your strategy and stay updated for the next move.
We don’t use indicators, we’re not out here drawing lines or cute little shapes — I just give you a clean trade.
If price doesn’t move within the expected time, the trade becomes invalid.

₿itcoin: PullbackBitcoin has experienced significant selling since Friday, briefly slipping below the $100,000 mark. We previously mentioned that a sharper pullback wouldn't surprise us. Whether prices will drop a bit further remains to be seen for the moment. Ultimately, we still expect Bitcoin to climb into the upper blue Target Zone (coordinates: $117,553 – $130,891) before a broader C-wave sell-off occurs, pushing the price down to the lower blue Target Zone (coordinates: $62,395 – $51,323). There, we anticipate the low of the larger orange wave a, which should mark the start of another corrective upward move. Afterward, we're preparing for the last downward leg of blue wave (ii). However, if Bitcoin directly surpasses the resistance at $130,891 – and thus our upper blue Target Zone – we'll locate it still in blue wave alt.(i) (30% probability).
📈 Over 190 precise analyses, clear entry points, and defined Target Zones - that's what we do.

New 5 wave cycle?This is my idea for a new 5 wave cycle. Targets for each wave are in the chart. Could this be wave 1 of 5? Possible top for wave 5 in 2033 or around this time. After, our first real bear market, multiple years ( Maybe 5 or so)?

BTC LONG TP:106,400 24-06-2025Scalping opportunity in progress ⚡️
Entry zone: 105,500
Target zone: 106,400
RR: 1.5
Timeframe: 30m
Estimated duration: 2 hours
We’re jumping in on a quick continuation after the recent pump. The bullish pressure is still there, and this move aims to squeeze a fast gain before the next reversal.
Looking for a short right after if the setup confirms.
We don’t use indicators, we’re not out here drawing lines or cute little shapes — I just give you a clean trade.
If price doesn’t move within the expected time, the setup is invalid.
