Trading Recommendations for BTC/USDBitcoin and Ethereum are demonstrating stable growth amid new forecasts regarding the number of interest rate cuts expected from the Federal Reserve this year. Another dovish stance from the Fed Chair and criticism from Trump over Powell's inaction triggered buying on the U.S. market, which also impacted the cryptocurrency market.
Investor enthusiasm is fueled by expectations of more accessible financial resources, which typically drive capital into riskier assets like cryptocurrencies. Bitcoin, as the flagship of the crypto market, traditionally reacts first to changes in macroeconomic conditions. However, one should not forget the inherent volatility of the crypto market. Even positive macro signals do not guarantee sustainable growth-especially as Bitcoin has been hovering near its historical highs, where buyer interest has been waning recently. It's essential to c consider technical factors, market sentiment, and regulatory risks, all of which can significantly influence price dynamics.
Meanwhile, alongside Strategy, Japanese investment company Metaplanet purchases Bitcoin for its balance sheet. Data shows the company acquired an additional 1,234 BTC for approximately $132.7 million just one day after announcing a $515 million capital raise to fund its Bitcoin treasury strategy. The Tokyo-listed firm stated that this latest purchase at around $107,557 per Bitcoin raised its total holdings to 12,345 BTC. The company holds about $1.3 billion worth of Bitcoin based on current market prices. This makes Metaplanet the seventh-largest publicly listed corporate holder of Bitcoin, surpassing Tesla, which holds 11,509 BTC.
As for intraday strategy in the cryptocurrency market, I will continue to act based on any major pullbacks in Bitcoin and Ethereum, expecting the medium-term bullish market to persist
For short-term trading, the strategy and conditions are described below.
Buy Scenario
Scenario #1: I will buy Bitcoin today if it reaches the entry point around $106,227 aiming for a rise to $ 107,042. Near $107,042 I plan to exit the long position and sell on pullback. Before buying on a pullback, ensure the 50-day moving average is below the current price and the Awesome Oscillator is above zero.
Scenario #2: If the market does not react to a breakout, Bitcoin ca also be bought from the lower boundary at $105,039 with targets at $106,221 and $106,748.
Sell Scenario
Scenario #1: I will sell Bitcoin today if it reaches the entry point around $107,695 aiming for a drop to $106,008. Near $106,008, I plan to exit the short position and buy on a bunce. Before selling on a breakout, ensure the 50-day moving average is above the current price and the Awesome Oscillator is below zero.
Scenario #2: Bitcoin can also be sold from the upper boundary at $106,753 if there is no market reaction to a breakout, targtion the $104,651 and $103,888 levels.
BTCUSD.PM trade ideas

BITCOIN wave 5 north losing steam!NewsBTC
Fading Spot Volumes And Muted Futures Sentiment Threaten To Send Bitcoin Below $99,000 Again

BITCOIN: The $110K Crossroads - Bull vs Bear Battleground! The Setup: "The Healthy Pullback Hypothesis
🔵 BLUE SUPPORT TRENDLINE (Rising from ~$76K)
The Foundation: This ascending support has held multiple tests
Current Status: Price dancing right on this crucial line
Psychology: Bulls' last stand
🔴 RED RESISTANCE CHANNEL (Descending from $112K peak)
The Ceiling: Two parallel resistance lines creating downward pressure
Pattern: Classic bearish channel formation
Volume Profile: Declining volume suggests exhaustion
🟡 YELLOW HORIZONTAL ZONES
Key Level 1: ~$98K (Previous resistance turned support)
Key Level 2: ~$112K (The rejection zone)
🟢 BULLISH SCENARIO (65% Probability)
Setup: Breakout above red channel resistance (~$108K)
🚀 Rocket Ship: Explosive move to $120K+
📉 Reality Check: Deeper correction to $95K-98K range
Entry: $97K - 98K (confirmed breakout)
Target 1: $104K
Target 2: $110K
Stop Loss: $95K
____________________________
⚠️ Risk Disclaimer: This analysis is for educational purposes. Always manage risk and never risk more than you can afford to lose. Markets can remain irrational longer than you can remain solvent! ⚠️

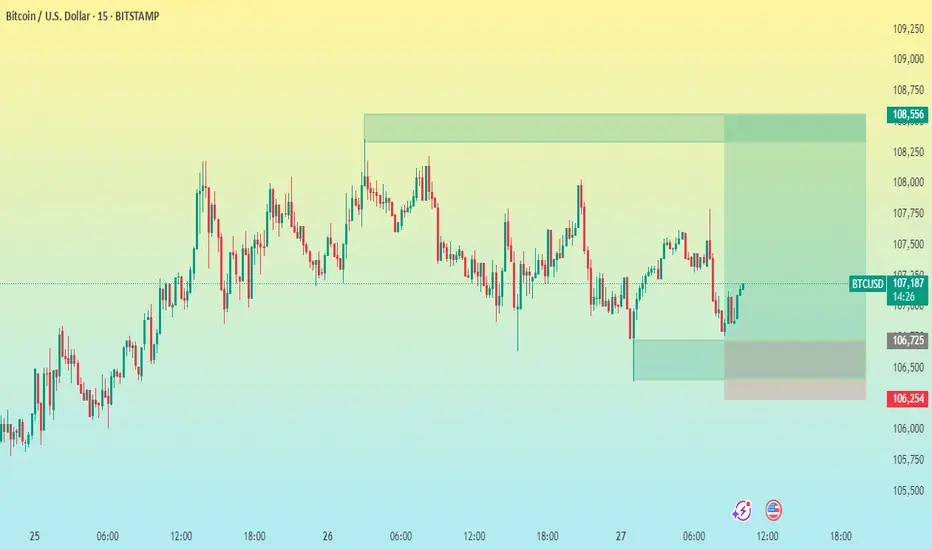
BTC/USD 15 M CHART PATTERN 🕵♂ Chart Context
Asset: Bitcoin (BTC) vs. USD
Exchange: Bitstamp
Timeframe: 15-minute
Date Range: June 25–27, 2025
Chart Type: Candlestick
---
📊 Technical Analysis
1. Trend
Short-term trend: Sideways to slightly bullish.
Market saw an earlier uptrend, then consolidation with lower highs and higher lows (forming a range).
Price is currently rebounding from the lower part of the range.
2. Key Levels
Entry Level: ~107,123 – likely where a long trade was entered.
Support Zone:
Minor: 106,725
Strong: 106,254 (stop-loss level, clear structure support)
Resistance Zone / Target: 108,556 – a prior high and possible supply zone.
3. Risk-Reward Ratio
Entry: 107,123
SL: 106,254 (−869 points)
TP: 108,556 (+1,433 points)
RR Ratio: ≈ 1.65:1 – acceptable for intraday trading.
Trading balanceTrading balance The price of the asset has rebounded from the balance zone. With the prospect of growth into the resistance zone.
Bullish bounce off pullback support?The Bitcoin (BTC/USD) is reacting off the pivot and could bounce to the 1st resistance which acts as a pullback resistance.
Pivot: 98,383.98
1st Support: 94,101.85
1st Resistance: 108,545.92
Risk Warning:
Trading Forex and CFDs carries a high level of risk to your capital and you should only trade with money you can afford to lose. Trading Forex and CFDs may not be suitable for all investors, so please ensure that you fully understand the risks involved and seek independent advice if necessary.
Disclaimer:
The above opinions given constitute general market commentary, and do not constitute the opinion or advice of IC Markets or any form of personal or investment advice.
Any opinions, news, research, analyses, prices, other information, or links to third-party sites contained on this website are provided on an "as-is" basis, are intended only to be informative, is not an advice nor a recommendation, nor research, or a record of our trading prices, or an offer of, or solicitation for a transaction in any financial instrument and thus should not be treated as such. The information provided does not involve any specific investment objectives, financial situation and needs of any specific person who may receive it. Please be aware, that past performance is not a reliable indicator of future performance and/or results. Past Performance or Forward-looking scenarios based upon the reasonable beliefs of the third-party provider are not a guarantee of future performance. Actual results may differ materially from those anticipated in forward-looking or past performance statements. IC Markets makes no representation or warranty and assumes no liability as to the accuracy or completeness of the information provided, nor any loss arising from any investment based on a recommendation, forecast or any information supplied by any third-party.

I don't know why ???Bitcoin is now at a point where it cannot be ignored! In my view, the bullish wave has started after the corrective wave ended. This wave could continue until it breaks the ascending triangle, then with a slight correction, push the price upward again. The current period and the coming days could be crucial in determining the market's trend.
Best regards CobraVanguard.💚

BTC Breakout or dropBitcoin has been trading in a range from 97.5K-112K for some time we tested 97K weekend and we bounce over 10% but we fail to make a ATH, also Bitcoin has strong bearish divergences that hardly anyone pays key attention to and these are almost identical to 2021 cycle top.
I have draw the resistance line and support from 2021 my theory is that IF we invalidate the bearish divergences we can see price action between 145K + . I do not think we can see a 320K price per bitcoin this cycle this will maybe happen in 2028 or 2032 cycle. Now if we do not breakout and invalidate the bearish divergences we can see the price dropping back to test the major 2021 support which is around 78K-84K only when this support if broken and we close a full body weekly candle below it then this confirms bear market has started.
Price action has move almost 8X from the 2022 ATL which is a decent return if you bought and hold.
If you enjoy the TA feel free to join my network its absolutely FREE.

BTC TRADE IDEA 22/06/25There are some places where price needs to ATK
Wait for reversal before chase that gap

BTC wait for Long
Bitcoin continues to struggle with its long-term weekly resistance.
In the short term, it’s likely that BTC will consolidate within the $100,000–$112,000 range.
Positioning heavily into altcoins during this phase may not be ideal. It’s more prudent to wait for either a confirmed breakout above weekly resistance or a pullback toward the $94,000–$92,000 support zone.
For now, the focus remains on short-term trading opportunities within this range. A potential long setup is outlined in the chart.
Disclaimer:
This analysis is based on my personnal views and is not a financial advice. Risk is under your control.

Turn off the noise. Listen to price. $XBTUSDFor me, BITMEX:BTCUSD.P is still in a bullish setup. If you are long, don't panic sell early yet. The signal to sell would be a break of my LIS which currently stands at 103703. If it makes new highs, it would be even more convincing that it wants to go higher ie. don't sell at new highs.
If a new high is made, i will be able to provide a min target to the upside. I will keep you updated.

Thief Trader Setup: Robbing the BTC/USD Market Reversal🏴☠️💰 Bitcoin Heist Blueprint: BTC/USD Robbery Plan by the Thief Trader Crew 💰🏴☠️
(Swing & Day Trade Outlook – Clean Entry, Clean Exit, No Fingerprints Left Behind)
🌟 Hi! Hola! Ola! Bonjour! Hallo! Marhaba! 🌟
To All Market Raiders & Silent Money Makers 🤑💸💰✈️
This isn't your average BTC/USD analysis — this is a strategic market heist, crafted from the Thief Trading Playbook.
We're planning a clean operation based on both technical setups and fundamental awareness.
Let’s enter smart, exit faster, and leave no trace — just profit. 🏆
🎯 THE GAME PLAN: Unlocking the BTC/USD Vault
📈 Entry – “The Vault’s Cracked Open!”
The plan kicks off with retest entries on the 15 or 30-minute chart.
Sell limits should be placed around recent highs or lows where market momentum pulls back.
Precision and patience are your tools.
🛑 Stop Loss – Backup Escape Route
Use the 1D swing high/low (e.g., 104.500) as your SL zone.
Position size smartly, factoring in risk %, lot size, and number of active orders.
🏁 Target – 94.000 (Or Bail Out Before It Gets Hot)
Don’t stick around too long — cash out near the zone or before if price slows or traps emerge.
Secure the bag, vanish before resistance bites back.
🧲 Scalpers – Quick In, Quick Out!
Stick to the short side only — short the bounces, trail your SL, and move with stealth.
Big players can strike straight; others can shadow the swing crew and trail behind with protection.
🧠 Why This Works – Market Pulse
BTC/USD is facing overbought pressure, consolidation traps, and is nearing a critical MA Zone where reversals tend to form.
Momentum shows signs of weakening, and the bears are regrouping — that’s where we slip in and out.
Supporting Factors Include:
Macro trends
Fundamental sentiment
COT positioning
On-Chain signals
Intermarket flow
Key psychological levels
🔍 All these build the narrative behind this bearish setup. This is more than just price action — it's a calculated move.
⚠️ Trading Risk Alert: Stay Off the Radar During News Drops 📰🚨
Avoid new entries during major news events — increased volatility = increased risk.
Use trailing stop-losses to lock in profits while staying protected during spikes.
❤️ Like the Plan? Power the Crew!
If this setup helped you see the market differently, hit the 💥Boost Button💥.
Every like supports the effort and helps sharpen our future plans.
Trade with style, move with purpose — Thief Trader Style.
🚀 Stay tuned for the next setup from the shadows. Until then — stay sharp, stay strategic, and always protect your profits. 🐱👤💰📉📈

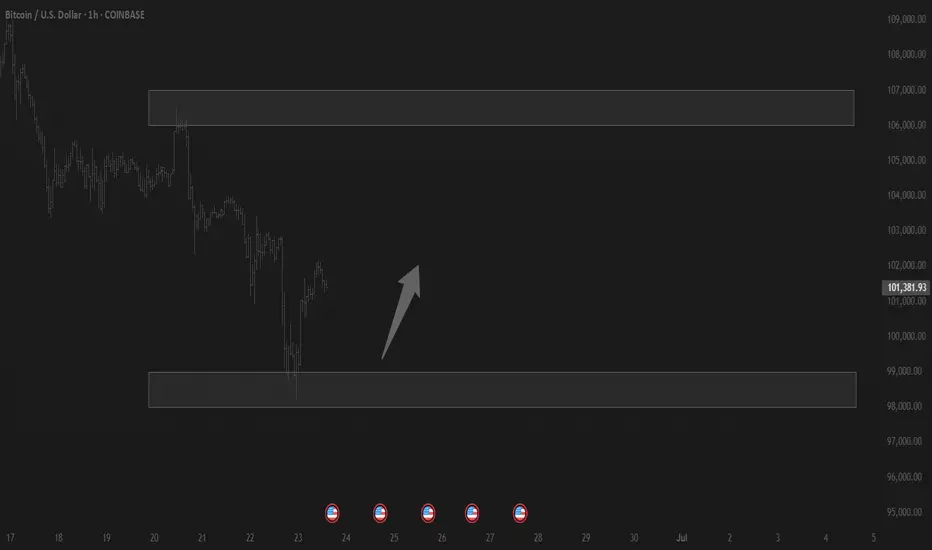
BTCUSD Descending channel breakout bullish possible from SupportBTCUSD Breakout Alert!
1H Timeframe Analysis
Bitcoin has broken out of the descending channel with a strong bullish candle — signaling a potential reversal from the key demand zone around 103,600.
📈 Technical Targets:
🔹 First Target: 108,000
🔹 Second Target: 110,000
This breakout could offer a solid long opportunity, but as always — manage risk wisely! ✅
💬 What’s your bias?
❤️ Like | 🔁 Share | 💭 Comment
📲 Join us for more real-time updates and insights!
#BTC #Bitcoin #CryptoTrading #TechnicalAnalysis #Breakout #BullishMomentum

#BTCUSD Buy 107248.20#BTCUSD Buy 107248.20
SL 106648.20
TP 107448.20
TP 108248.20
TP 109648.20
Trade at your own risk
Protect your capital
The Wizard 🧙♂️ SWFX

BTCUSD TRADE SETUP 📈 **Bitcoin (BTC/USD) 1H Chart Analysis — June 28, 2025**
🔍 **Pattern Identified: Bullish Flag Breakout**
🧠 **1. Market Context**
* This is the **1-hour chart** of **BTC/USD** on Binance.
* Price recently formed a **bullish flag pattern**, which is a **continuation pattern** signaling a potential breakout in the **direction of the previous trend (upward)**.
🔧 **2. Technical Breakdown**
🔹 **Trend Before the Flag**
* Price had a strong **impulsive move up** from \~105,000 to \~107,800.
* That was followed by a **consolidation phase** forming a downward sloping **channel** (blue parallel lines), creating the **flag**.
🔹 **Flag Channel**
* Price oscillated inside this flag for nearly 2 days (June 26–28).
* The **channel** is clearly defined, and price **respected both upper and lower bounds** during the consolidation.
🚀 **3. Breakout Confirmation**
* Price has now **broken out of the upper boundary** of the flag.
* A clean **break and candle close** above the trendline suggests **bullish momentum** is returning.
* This breakout is occurring around the **107,400–107,800** zone, which is also a **key structure level** acting as local resistance.
---
🎯 **4. Trade Setup**
✅ **Entry:**
* Around **107,400–107,800**, post-confirmation of the breakout.
❌ **Stop-Loss (SL):**
* Placed just below the **flag support / demand zone**, around **106,800**.
* This protects against a fake breakout or pullback into the flag.
🎯 **Target (TP):**
* Projected at **110,000**, which is aligned with the height of the initial flagpole projected from the breakout point.
* This also represents a psychological round number and a previous resistance level.
---
📊 **Risk-Reward Ratio (RRR)**
* **RRR = \~3:1**
* For every \$1 risked, the potential reward is \$3 — **excellent reward structure**.
---
📌 **Key Insights for the Traders**
* This is a **classic bullish flag breakout** play—very reliable in trending markets.
* **Volume confirmation** (not shown in chart but should be checked live) is important — higher volume during breakout gives stronger conviction.
* Watch for a possible **retest of the breakout level** (around 107,800) before the next move up.

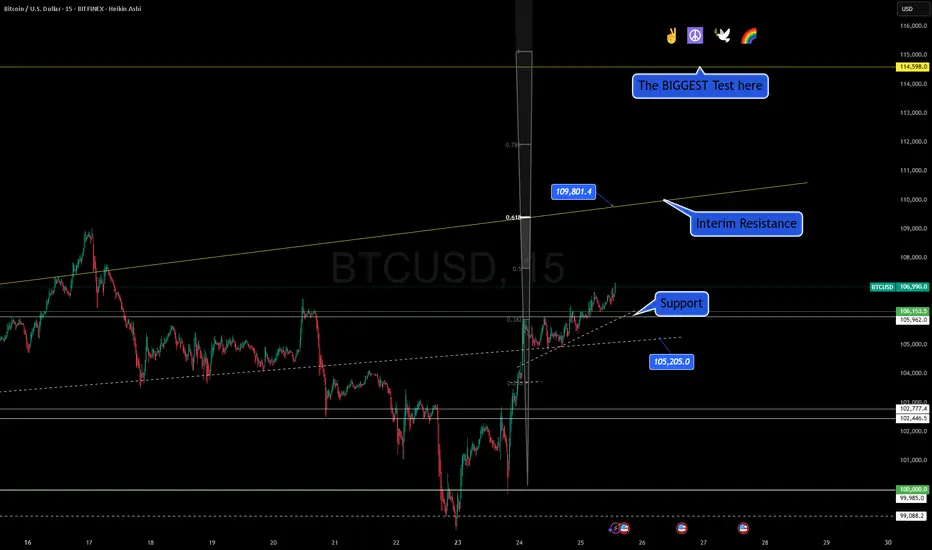
Updated Chart and Levels. Peace firstVideo:
🕊️💛 Bitcoin Love and Peace! Let's go 🚀🧘♂️
Hello Traders,
The world may be tense, but Bitcoin is offering a beacon of calm and opportunity. 🌍💡 We've established strong support at 106,153 and 105,962, and with peace settling in geopolitically and a softer tone from the Fed, the market is primed for movement.
📊 What I see:
Support is holding beautifully
Short-term breakout structure building up
Immediate resistance at 109,801
Bigger test zones at 113,800 and 114,598
Altcoins? They're sitting in the backseat. BTC dominance is around 65%, confirming that Bitcoin is the leader right now. If you're hunting momentum, this is where your focus should be.
As I always say—never long disaster, never short peace. And right now, with the War of 12 Days behind us, Bitcoin reflects hope and progress.
So let’s trade smart, stay grounded, and always remember—hate makes you part of the problem, love makes you part of the solution. Let’s build a world where even enemies become friends. 💞
One Love,
The FXPROFESSOR 💙
Disclosure: I am happy to be part of the Trade Nation's Influencer program and receive a monthly fee for using their TradingView charts in my analysis. Awesome broker, where the trader really comes first! 🌟🤝📈
BTC daily bull flag formationBTC is looking bullish on the daily chart in my opinion. One more pullback might be in order before we test new highs on the daily chart. The 100 sma has crossed over the 200 sma and the 50 sma is crossing the 21 sma. The rsi is neutral at time of publication. This bullish breakout could occur in late july after a pullback in the near term.
I think bitcoin is setting up to make another all time high push as summer draws on.
Not financial advice. Do your own DD.
Thanks for viewing the idea.
Comment what you think is going to happen over the course of this summer.

major ouchieUS involvement in the middle east just might spell the end for the bull portion of this current halving cycle
this structure is looking very precarious

Barb WireBTCUSD is potentially entering in a Barb Wire, meaning bulls and bears are in equilibrium and any breakout to either side has a good chance of being a false breakout.
I'm going to stay out of it for now.
If price breaks through the bear TL and make a strong reversal bar at the All Time High, it could potentially be a good short trade with high RR.

Bullish confirmation today on both the daily and 4hrly.Bullish confirmation today on both the daily and 4hrly.
4hrly Chart:
Caught the dip?

“DXY at 3-Year Low | Gold Slips, BTC Stalls – What PCE Data Meann this week’s Market Recap, we break down the key moves across the US Dollar Index (DXY), Gold (XAUUSD), and Bitcoin (BTCUSD) — and how they’re all being shaped by rising Fed uncertainty and looming U.S. inflation data.
🔹 DXY is hovering near 3-year lows as political pressure and expectations of Fed rate cuts weigh on sentiment.
🔸 Gold is slipping near 4-week lows as Middle East tensions ease and risk appetite returns.
🔹 Bitcoin remains flat but poised for a breakout, with macro data in the driver's seat.
We explain how each market is reacting, what traders are pricing in ahead of the upcoming PCE inflation data, and how to position yourself in the week ahead.
📌 Covered in this recap:
Market sentiment shifts and key news drivers
Practical insights for interpreting price action
What to watch in next week’s economic calendar
📊 Stay informed, stay prepared.
👉 Like, follow, and comment if you found this helpful. Let’s trade smart.

Bitcoin Love and Peace! Let's go🚀📈 Bitcoin Rally Gains Steam with Strong Support in Place 💪🧠
Hello Traders,
After a period of geopolitical tension and heavy volatility, the charts are finally giving us a breath of calm. 🕊️ BTC/USD on the 15-minute chart has formed a solid base of support between 106,153 and 105,962. This area has now held up well and is acting as a launchpad for potential upside continuation.
🔍 Technically speaking, we’re observing:
Price holding above the 0.5 Fib retracement
A short-term breakout structure forming higher highs
Key interim resistance at 109,801
Long-term resistance to watch at 113,800 and the crucial macro test at 114,598
With Bitcoin dominance sitting at 65%, it's clear: this is Bitcoin’s moment. Altcoins are lagging, and BTC is leading the charge.
⚖️ The broader narrative is also shifting. The Fed's dovish tone adds to market stability, and in times of peace, Bitcoin thrives. But the key level to monitor remains 109K. A breakout above that sets us up for a major move.
Let's keep an eye on this structure. A failure to hold the 105K zone would shift the outlook, but for now, all systems are GO 🚦.
🕊️ Remember, in both trading and life—hate divides, love unites. Choose to be part of the solution.
One Love,
The FXPROFESSOR 💙
Disclosure: I am happy to be part of the Trade Nation's Influencer program and receive a monthly fee for using their TradingView charts in my analysis. Awesome broker, where the trader really comes first! 🌟🤝📈

BTCUSD looks heavyBTCUSD looks heavy. Resistance at 109000.
I guess we may see a corrective move lower towards 100000 in the coming weeks.
I would sell here, with a stop at 109000.
