BTCUSD looks heavyBTCUSD looks heavy. Resistance at 109000.
I guess we may see a corrective move lower towards 100000 in the coming weeks.
I would sell here, with a stop at 109000.
BTCUSD.PM trade ideas

CHECK BTCUSD SIGNAL READ CAPTAINsell Setup)
Entry Zone: Around 106850.00\106650.00
Stop Loss: 107400.00
Take Profits:
TP1: ~106000.00
TP2: ~105300.00
Final Target: 104550.00

BITCOIN SHORT FROM RESISTANCE
BITCOIN SIGNAL
Trade Direction: short
Entry Level: 107,066.16
Target Level: 99,786.09
Stop Loss: 111,861.76
RISK PROFILE
Risk level: medium
Suggested risk: 1%
Timeframe: 1D
Disclosure: I am part of Trade Nation's Influencer program and receive a monthly fee for using their TradingView charts in my analysis.
LIKE AND COMMENT MY IDEAS

CHECK BTCUSD SIGNAL READ CAPTAINsell Setup)
Entry Zone: Around 107200.00 \107000.00
Stop Loss: 108000.00
Take Profits:
TP1: ~106400.00
TP2: ~105400.00
Final Target: 104600.00

BTC/USD – Critical Reversal or Breakout?Bitcoin is currently trading around $107,500, pressing against the upper boundary of a rising wedge on the 1H and 4H charts. The structure remains fragile, with weakening momentum and conflicting signals between short and mid-term indicators.
📌 Scenario 1 – Bearish:
The current move likely completes wave (b) of an ABC correction.
Price has reached ~0.735 retracement at $108,358.
Breakdown of wedge support (~$104,600) could activate wave (c) toward $101K–$98K, or even the 1.618 extension to $86,000 (seen on daily).
📈 Scenario 2 – Bullish Alternate:
If BTC breaks and closes above $108,500, with volume, we may have invalidation of wave (b).
This opens the door for a wave (5) extension toward $113,000.
🔍 Key Indicators:
RSI on 1H is weakening, under 50.
OBV is flat – no accumulation spike.
QQE shows Buy signals but lacks follow-through.
Volume remains unconvincing for continuation.
🎯 Conclusion:
BTC is at a make-or-break level. A clean breakout and retest above $108.5K flips the structure bullish. Until then, wedge breakdown is the higher-probability play. Watch the $104.6K zone closely for direction confirmation.

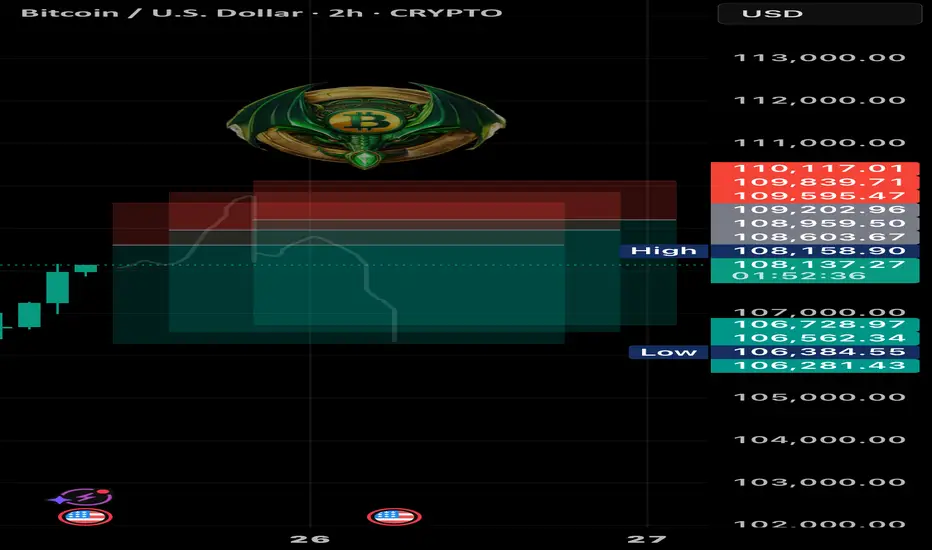
June 25 Bitcoin Bybit chart analysisHello
This is Bitcoin Guide.
If you "follow"
You can receive real-time movement paths and comment notifications on major sections.
If my analysis was helpful,
Please click the booster button at the bottom.
This is the Bitcoin 30-minute chart.
Nasdaq indicators will be announced at 11 o'clock shortly.
Nasdaq is rising vertically + renewing its all-time high.
Accordingly, I ignored the weekly MACD dead cross and
proposed the strategy for the pattern by substituting Tether dominance.
Although it is not visible on the screen,
I created today's strategy with the condition of maintaining the long position of $100,587.9 that was confirmed on the 23rd.
* One-way long position strategy when the red finger moves
1. $106,746 long position entry section / When the purple support line is broken
or when section 2 is touched, stop loss price
2. $108,66 long position 1st target -> Good 2nd -> Great 3rd target price
When section 1 at the top touches, it can be connected to an upward trend,
and section 2 is a sideways market.
At the very bottom and the very top,
I have indicated the maximum possible trend until tomorrow afternoon.
Up to this point, I ask that you simply use my analysis for reference and use only
I hope that you will operate safely with the principle of trading and stop loss.
Thank you.

Cup and Handle Hello Traders 👋 — Hope you're having a strong start to the week!
Let's dive into the BTCUSD Daily Chart 📈 — we’re looking at a Cup and Handle setup that's matured beautifully.
🔵 Price carved out a clean rounded base (cup), followed by a consolidation handle right below resistance.
🟠 The 200 SMA is holding as dynamic support.
⚡️ A confirmed break above 109K could launch price toward 130K+, with clear Fibonacci extension targets in sight.
Key Zones:
Handle Support: 100,472
Breakout Line: 109,360
Main Target: 130,867
Extended: 136K–144K
Structure ✅ | Momentum Building ⚡ | Risk Managed 🎯
Stay sharp, stay patient. Structure first — breakout next.

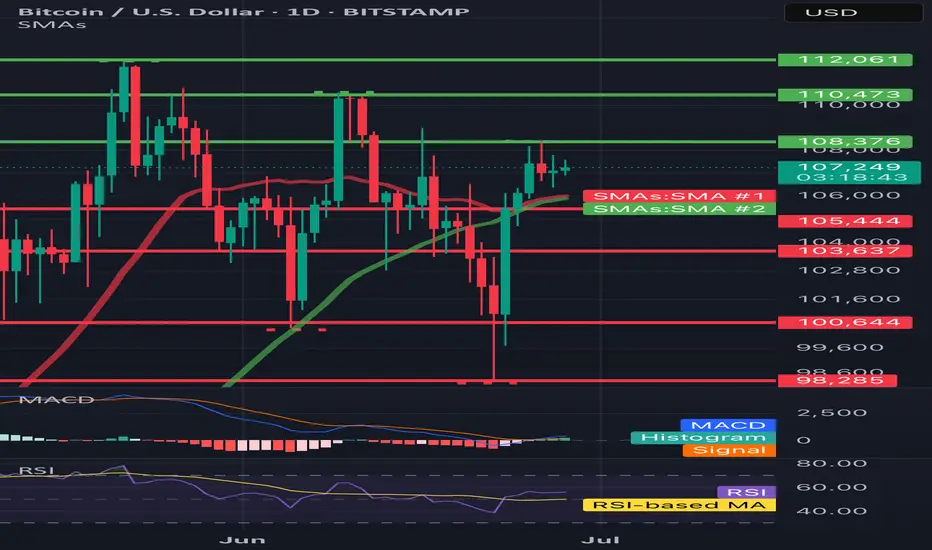
BTC/USD 1DHello everyone, let's look at the 1D BTC chart to USD, in this situation we can see how the 3rd peak formed us and we are currently fighting to maintain the price or a potential output up if we do not see a try to break out, you can expect a stronger relief.
However, let's start by defining goals for the near future the price must face:
T1 = 108376 $
T2 = 110473 $
Т3 = 112061 $
Let's go to Stop-Loss now in case of further declines on the market:
SL1 = 105444 $
SL2 = 103637 $
SL3 = 100644 $
SL4 = 98285
Looking at the RSI indicator, we see
As we entered the upper part of the indicator again, however, there is still a place to try to grow.
BTCUS pullback before bullish continuation.Here we can see the trend is still bullish, however a potential pullback back to around 105000 is expected. Lets gooo!!!
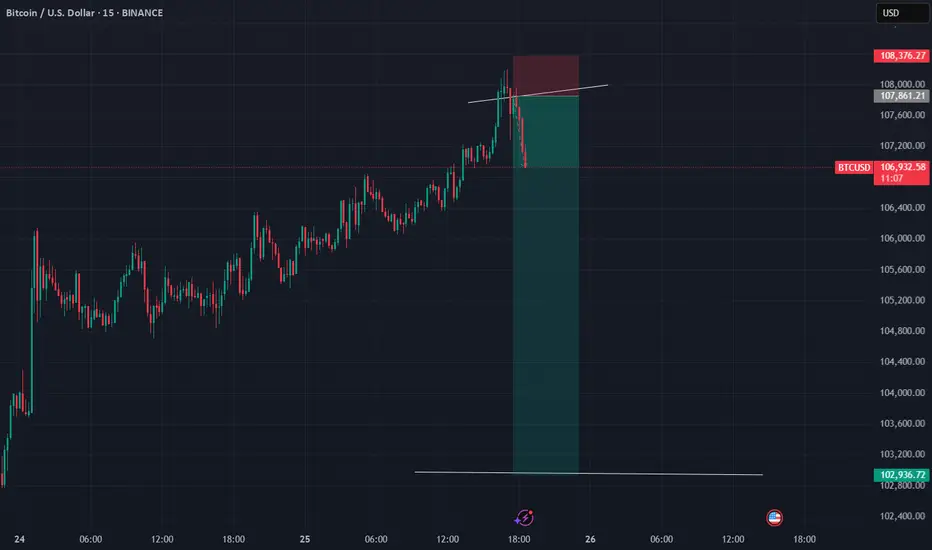
BTC SHORT TP: 106,300 25-06-2025Let’s be real — what’s coming looks like pure manipulation 😮💨
Setting a SHORT between 108,550 – 109,250, aiming for 106,200 – 106,550, with an average 3.3 RR.
🕑 Timeframe: 2H
⏳ Duration: 20–30 hours
Context: If you see a massive green candle… that’s not strength — that’s the short signal. Stops are pretty obvious in this kind of setup. Classic trap vibes loading.
If the move doesn’t happen within the estimated time, the setup is invalid.
We don’t use indicators, we’re not out here drawing lines or cute little shapes — I just give you a clean trade.
BTC: neutral case analysisBITFINEX:BTCUSD
Hello
Based on last 3 bull cycles and bear cycles, I did some calculations and this pattern is the result of it.
Take it with a pinch of salt, this might not even be close, but just past data gives me this fractal.
Here are the peak Bitcoin (BTC) prices for the years you mentioned:
2013: $1,156
2017: $19,497
2021: $67,566
We can now treat these as the values of the quadratic function:
a=1156 (for year 2013)
b=19497 (for year 2017)
c=67566 (for year 2021)
However, to apply the formula:
Price(x) = a⋅x2 + b⋅x + c
Using a quadratic fit to the BTC peak prices in 2013, 2017, and 2021, we get the following estimated prices:
2017: $19,497 (matches actual)
2021: $67,566 (matches actual)
2025: $145,363
Above is the AI calculation, I think it is about right.
Happy trading
Cheers

Bull-Flag within a Bull Flag means Exponential gains coming ???As of Friday, June 27, 2025, at 9:41:55 PM PDT, here's an analysis of Bitcoin:
Current Price & Performance:
Last Price: Approximately $107,280.10 (as of June 27, 2025)
Recent Performance: Bitcoin has been showing resilience above the $105,000 mark and has consolidated in a range between $100,000 and $110,000 recently, after hitting an unprecedented price of around $111,814 last month.
Bull Flag in a Bull Flag Pattern (Nested Bull Flags)
A "bull flag" is a bullish continuation pattern characterized by:
Flagpole: A sharp, strong upward price move.
Flag: A period of consolidation or slight retracement that forms a rectangular or parallelogram shape, typically with lower trading volume.
Breakout: A resumption of the uptrend with a strong move out of the flag, ideally on increased volume.
A "bull flag in a bull flag" (or nested bull flag) implies that a smaller bull flag is forming within a larger, ongoing bull flag pattern. This suggests a powerful, sustained uptrend where even the pauses for consolidation are themselves exhibiting bullish continuation characteristics.
Identifying this for Bitcoin:
To identify this pattern in Bitcoin, we would look for the following on a daily or higher timeframe chart:
1. The "Larger" Bull Flag:
Flagpole (Large): Bitcoin's overall parabolic run from its post-bear market lows to its recent all-time highs (e.g., $111,814). This multi-month or multi-year rally constitutes the significant "flagpole."
Flag (Large): The current consolidation phase Bitcoin is undergoing after reaching those all-time highs. This "flag" would be characterized by a broad trading range (e.g., between $100,000 and $110,000, or a wider range after its initial peak). This large flag would be a period of consolidation following the massive flagpole.
2. The "Smaller" Bull Flag (Nested within the larger one):
Flagpole (Small): Within this larger consolidation "flag," Bitcoin might experience shorter, sharper upward impulses. For example, if Bitcoin has a sudden 10% surge from $100,000 to $110,000 within the larger flag. This specific surge acts as the "flagpole" for the smaller flag.
Flag (Small): Following this smaller surge, Bitcoin then enters a mini-consolidation phase (a few days to a week or two), forming a tighter "flag" pattern within the broader trading range. This would be a slight downward or sideways channel on lower volume.
Breakout (Small): A breakout from this smaller flag would see Bitcoin push higher within the larger consolidation range, perhaps targeting the upper boundary of the larger flag (e.g., aiming for $110,000 or new highs).
Current Bitcoin State and the Pattern:
Based on recent market commentary and price action:
Overall Context: Bitcoin is in a long-term bull market, having recovered significantly from previous lows and testing all-time highs. This broad trend provides the context for large "flagpoles."
Larger Flag: Bitcoin's current consolidation around the $100,000-$110,000 zone, after its surge to $111,814, clearly fits the description of a large "flag" forming after a substantial "flagpole." This is a critical consolidation phase for the overall bull run.
Smaller Flag (Potentially Forming): Recent news mentions that Bitcoin surged over 10% since last Sunday (early June 2025) and has been consolidating between $100,000 and $110,000 for over three days. This description fits the start of a nested bull flag:
The 10% surge could be the smaller flagpole.
The consolidation for over three days within the $106,390 - $108,384 range after that surge could be the smaller flag formation.
If this smaller flag resolves to the upside, it would push Bitcoin towards the upper boundary of the larger flag ($110,000 to $112,000) or beyond.
Significance of a Nested Bull Flag:
Strong Underlying Momentum: The presence of a smaller bull flag within a larger one suggests exceptionally strong buying pressure and conviction among bulls. Even during periods of overall consolidation, traders are quick to accumulate on dips, leading to these smaller continuation patterns.
Layered Confirmation: It provides multiple layers of bullish signals. A breakout from the smaller flag reinforces the bullish bias within the larger flag, increasing the probability of an eventual breakout from the larger pattern.
Entry Opportunities: For traders, the smaller flags offer shorter-term entry opportunities within a larger trend, allowing them to capitalize on mini-surges as the broader consolidation unfolds.
Caution:
Confirmation is Key: Like all chart patterns, bull flags require confirmation. For the smaller flag, watch for a decisive breakout above its upper trendline on increasing volume. For the larger flag, the ultimate confirmation would be a sustained break above its all-time high resistance (around $112,000) on significant volume.
Volatility: Bitcoin is known for its volatility, and even continuation patterns can have false breakouts or deeper retracements than anticipated.
Volume: Volume confirmation is crucial. The "flag" portion should ideally show decreasing volume, while the "breakout" should be accompanied by a surge in volume.
In summary, Bitcoin appears to be currently in a large consolidation phase which could be interpreted as a significant "bull flag." Within this larger "flag," recent price action suggests the potential formation of a smaller, nested bull flag, where a recent mini-surge (small flagpole) is followed by a short consolidation (small flag). This indicates strong underlying bullish sentiment, with market participants potentially looking for a push towards the upper boundaries of the broader consolidation range.
This analysis is based on technical patterns and current market information. It is not financial advice. Always perform your own due diligence and consult with a financial professional before making investment decisions, especially in highly volatile assets like cryptocurrencies.

BTCUSD: Minimum target for this Cycle is 150,000Bitcoin turned neutral again on its 1D technical outlook (RSI = 52.882, MACD = -410.600, ADX = 22.509) as it recovered the losses of the last 2 days thanks to the Truce announcement between Israel and Iran. The long term picture couldn't be more bullish however as it hasn't even hit the bottom red zone of the Logarithmic Growth Curves model. According to the Time Cycles that mark each Cycle High, the Top for this Cycle is estimated to be between October and December. By October 2025, the top of the first profit taking zone (lightest pink) would be $150,000. That is technically the bare minimum of Top that should be expected based on the current LGC model. Technically it can even hit $200,000 but fundamentals have to help a lot in this scenario (adoption, ETFs, rate cuts).
## If you like our free content follow our profile to get more daily ideas. ##
## Comments and likes are greatly appreciated. ##

BITCOIN Trump and the 1D EMA100 saved the day!Bitcoin (BTCUSD) rebounded yesterday on its 1D EMA100 (green trend-line) and along with Trump's truce announcement between Israel and Iran, it sent the market into a buying frenzy and back above the $105k mark.
Technically, the 1D EMA100 isn't something to be ignored as since the November 2022 market bottom, each Bullish Leg (Channel Up) that started had a contact (or near) with it that resulted into a considerable bullish extension.
The 1st Channel Up even breached below it, but after rebounding, it reached the 1.382 Fibonacci extension before the next correction. The 2nd Channel Up rebounded exactly on the 1D EMA100, and reached the 1.618 Fibonacci extension. The 3rd Channel Up almost hit the 1D EMA100 and then rebounded to the 2.0 Fibonacci extension.
It is obvious that the pattern follows a progression and each Fib extension peak is higher than on the previous Channel Up. As a result, it is not unlikely to see a High even above the 2.0 Fib ext ($168k) on the current (4th) Channel Up, however on the short-term we would still welcome the 1.382 Fib 'minimum' expectation, targeting $130000.
Do you think we should at least be expecting that? Feel free to let us know in the comments section below!
-------------------------------------------------------------------------------
** Please LIKE 👍, FOLLOW ✅, SHARE 🙌 and COMMENT ✍ if you enjoy this idea! Also share your ideas and charts in the comments section below! This is best way to keep it relevant, support us, keep the content here free and allow the idea to reach as many people as possible. **
-------------------------------------------------------------------------------
💸💸💸💸💸💸
👇 👇 👇 👇 👇 👇

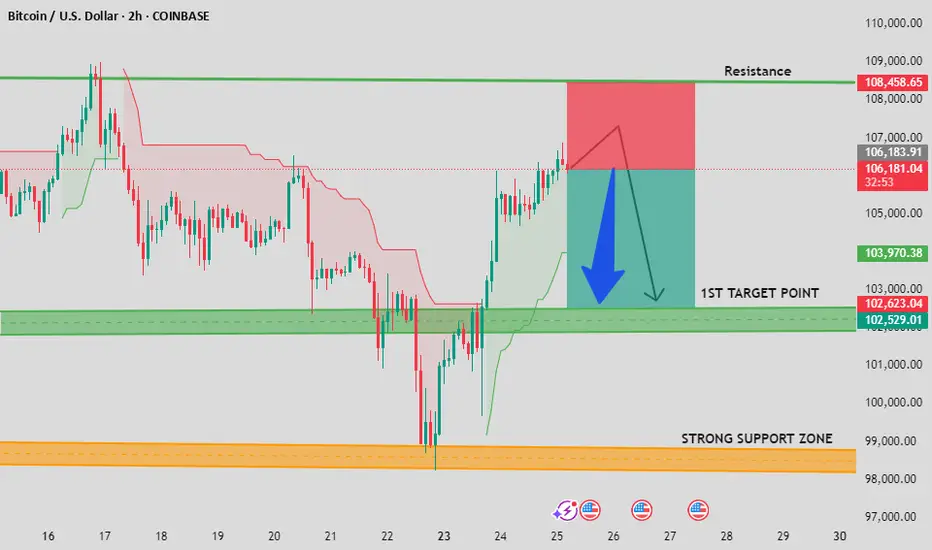
BTC/USD Resistance Rejection + Bearish Structure FormingBitcoin has reached a strong resistance zone near $107,500–$108,500, showing signs of rejection. Based on the 2H chart, price has formed a bearish pattern after a sharp rally, suggesting a potential short opportunity.
📊 Technical Confluence:
Resistance zone holding firm
Bearish engulfing candle at top
Overbought conditions + potential reversal
Price breaking back below local support
🔽 Target Zones:
1st Target: $102,500 – $102,600
Final Target (Strong Support Zone): $98,500 – $99,500
🕒 Watch for confirmation on lower timeframes before entry. Risk management is key.
Unusual situation - Will you short BTCUSD?Going short is not the first thought when talking about BTCUSD, yet the 3 recent lower highs together with an "evening star" pattern are saying exactly that.
Will you take this offer?
What do you think?
Comment below, share your thoughts and analysis!!
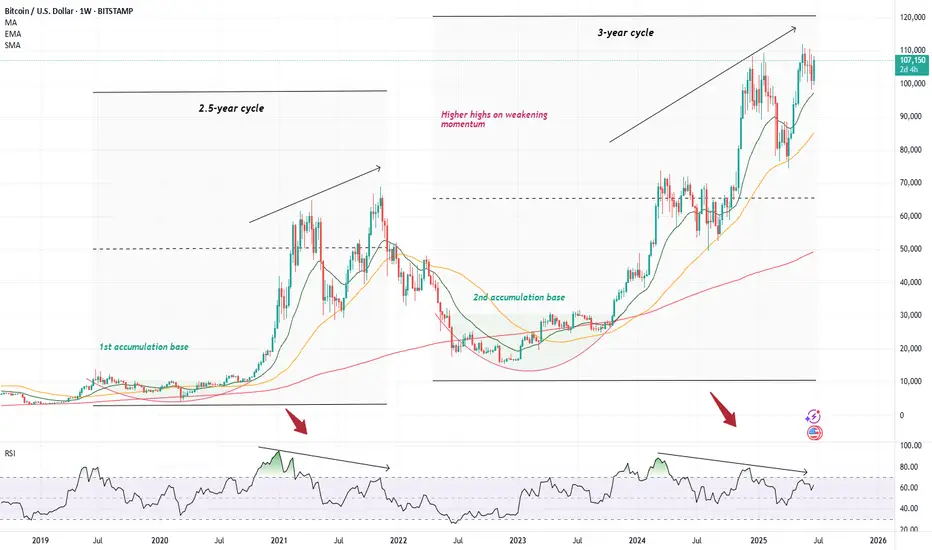
Cautionary tale on BitcoinI decided to temporarily depart from my usual trade ideas to wave a cautionary finger at the chart of Bitcoin, where I have noticed a rather worrying pattern within the weekly charts. However, before I delve in, I would like to stress that I am a very rigid believer in the long-term prospect of our monetary saviour and what I am supposed to write about only concerns the usual, inevitable cyclicality that always entails the otherwise upward-sloping trajectory of Bitcoin ( CRYPTO:BTCUSD )
Although overall this has not felt like much of a crypto bull run given the apparently absent performance of altcoins (apart from an occasional 1000x on a well-targeted memecoin), Bitcoin has, in the meantime, trod its usual path upwards. Since the '22 lows, it has mimicked its regular pattern where after a devastating plummet lower, it has spent several long months accumulating until it has burst out of its cocoon to provide a 6x return to its strong believer. However, the mimicking is almost too good as we have now started painting a very similar picture to what eventually transpired to be the '21 top. We have reached a strong above >100k top only to hit a vicious correction (announcement of tariffs), similar to what Bitcoin did in May of 2021 (China crackdown, tech selloff). The price then quickly consolidated - which I am not an avid fan of as a formation of a more robust base would be more preferable (though would take longer ) - and bitcoin shot back up again, quickly reclaiming the previous highs; just like it did in October/November 2021. This creates an unfortunate setup best represented by the series of lower highs on an RS I while the price keep climbing higher - creating the probably best-know bearish signal with higher highs built on weaker and less robust momentum.
We know how this ended in 2021, and I am not suggesting that Microstrategy should blow up, go bankrupt and sell all its bitcoin (though definitely a possibility) - however, one must admit that there are currently quite a lot of uncertainties that could unwind at any time (one such coming on July 8th with the second version of the lets-blow-up-the-stock-market day). With a stock market priced to perfection, and with what seems like a large pile of uncertainties hovering in the air, it seems like any one of these could light up the fire underneath these lovely valuations we have reached, and although I would love for cryptocurrency prices to be completely independent of the stock market, we usually know how this goes.
So, what to do about this? Preferably nothing . If you are as much of a believer as I am in the necessity of bitcoin in today's financial world, this is just another blip in an otherwise long and profitable ride. So, I won't be any selling any of it - hopefully only adding once we decline. I would also add that I am not expecting as much of a bloodbath as last time. I think Bitcoin has reached a point where the 80-90% declines become very rare. However, regarding my other allocations in crypto assets, I am not as optimistic, hence I decided to sell most of everything else. Although I love the premise of Ethereum, the chart looks pretty horrific, currently drawing a perfect head-and-shoulder on a 4h chart (which I might write about as well as a short idea).
I will end this essay the same way I started it - I know absolutely nothing, and maybe I will come back at the end of the summer, beautifully tanned and relaxed as we all are in Europe, and find everything at all-time highs. I just currently believe the risk-reward ratio is not skewed in my favour, and I don't know how about you, but I tend to listen to my probability gods, especially on the eve of another strong SPAC year .
Bitcoin Order Book - How To Trade ItBitcoin Order Book Analysis | Massive BTC Liquidity Zones You Need to Watch
In this video, we break down the Bitcoin (BTCUSD) order book and highlight the biggest buy and sell levels currently driving market sentiment. These are the exact price zones where whales and institutions are placing large orders—often creating powerful support and resistance that can trigger breakout or reversal setups.
In This Breakdown:
• Where major buy/sell walls are forming in the BTC order book
• How order book depth can predict short-term price direction
• Real-time liquidity pockets traders are watching now
• Key price levels to watch for possible long/short entries
This is a must-watch if you’re actively trading BTC and want to track where the smart money is stacking their positions.
⸻
Tools Featured:
• BTCUSD real-time chart
• Order book heatmap / depth
• Liquidity zone visualizations
• Volume profile overlays
• Sentiment Tool
⸻
Use this insight to position your trades around high-probability reversal or breakout zones. Comment your BTC target below, and follow for daily pro-level crypto insights.
⸻
#Bitcoin #BTCUSD #OrderBookAnalysis #BTCOrderFlow #WhaleActivity #LiquidityZones #CryptoTrading #PriceAction #CryptoTA #BitcoinStrategy

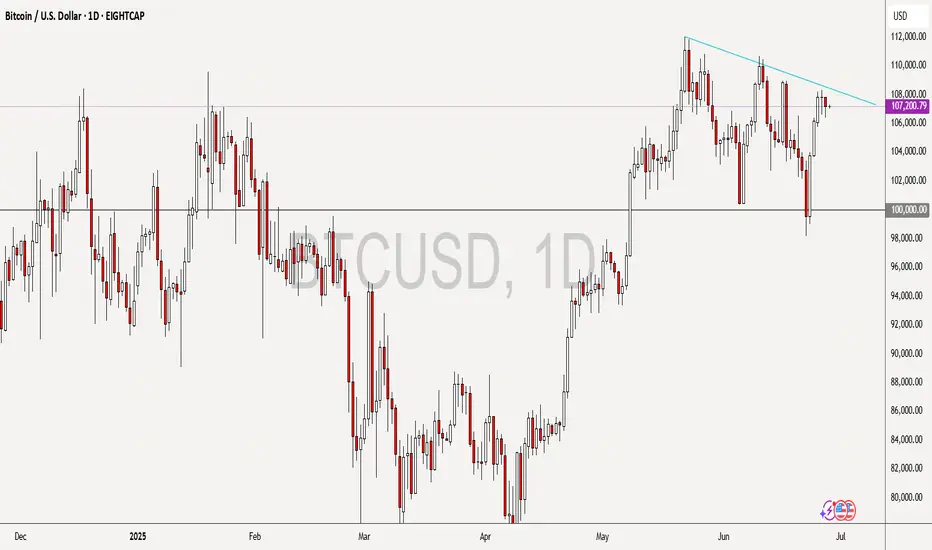
Market next target ⚠️ Disruption & Analytical Weaknesses:
1. Support Zone Already Broken (Wick Penetration):
The candlestick wick clearly pierced the support level drawn on the chart.
This indicates that buyers are weak at that level — the support is not holding firmly.
Relying on this support for a bullish bias is risky, as it may soon turn into resistance.
2. Volume Confirms Weakness, Not Strength:
The bounce from the support zone happens on low or declining volume, suggesting lack of strong buying interest.
A legitimate bullish reversal should be backed by a volume surge — here, that’s absent.
3. False Sense of Recovery:
The analysis shows arrows projecting straight up to the “Target” level, implying a smooth bullish recovery.
This is unrealistic given the recent choppy price action and repeated failures to hold gains above 107,200.
Price action suggests uncertainty or distribution, not clean bullish momentum.
4. Tight Range and High Volatility Ignored:
Price has been ranging between ~106,400 and ~107,600 with rapid whipsaws.
This kind of structure is often indicative of indecision, and setting a clear directional target without breakout confirmation is premature

BTCUSD printing a bullish flag BTCUSD printing a bullish flag expected to make a all time high, entry with a buy stop above the last HH, RR .75: .75

BTCUSD Analysis | Bearish Setup Unfolding?Bitcoin is trading within a descending channel, respecting lower highs and lower lows. The recent price action shows a sharp bounce from the $98,600 support zone, but the bigger picture still hints at potential downside.
🔍 Key Technical Insights:
Descending Channel remains intact – structure suggests bearish continuation.
Price bounced from $98,626 support, but is struggling below key resistance at $108,622.
A possible lower high formation near $106K–$107K could trigger the next drop.
Bearish projection remains valid if price fails to break above the descending trendline.
🟢 Upside Scenario: If bulls manage to break above $109K resistance, we could see a bullish reversal.
🔴 Downside Target: If the bearish setup confirms, we may revisit the $98,000–$99,000 support area once again.
📌 Plan Accordingly:
Wait for price action confirmation near resistance. Patience pays in volatile zones like this!
#BTCUSD #Bitcoin #CryptoAnalysis #TradingView #BTCUpdate #CryptoTrader #TechnicalAnalysis

Bitcoin Top is In! Bear considerationsPrice has been carving out an unclear correction off the high. The recent structure has many squinting. Is it done or the calm before another wave of selling?
I am weighing two bearish scenarios here. One is more aggressive than the other. But both start with the same idea. No new high before another low.
Let’s start at the top.
The initial move down off the recent high could count as an impulse. Whether that is a wave 1 or a wave A is still up for judgment. Either way, that first leg sets a bearish tone at the larger degree.
Here’s where it gets interesting. The correction since then shows traits of a flat. A running one at the moment.
This opens the door to two active bearish projections:
A wave C collapse, implying a completed A B C correction and a downside resolution.
A wave 3 drop, for a possible top if this is an impulsive sequence.
That is the fork in the road. And it all hinges on the next move.
Right now, the smallest degree impulse off the low is doing some heavy lifting.
If that pivot holds and we only get an internal retracement like a micro wave 2, the door is still open for upside continuation.
But if that impulse gets invalidated, I would expect bears to press. First for a break below 100k, then toward the 95k area.
Here is how to think about it:
Hold the small impulse → Potential upside
Break the impulse base → Wave C or 3 likely underway
Context still leans bearish. Lower highs are still in play. But we are hunting a specific structure to confirm it.

Bitcoin's Bullish DriversThe four bullish drivers behind Bitcoin's rally:
1.Institutional involvement: BlackRock and other institutions have accumulated large positions through ETFs, with OTC inventory declining, creating a scarcity effect in the market.
2.Policy tailwinds: Escalating expectations of Federal Reserve rate cuts have enhanced Bitcoin's attractiveness under low-interest-rate environments.
3.Regulatory breakthrough: China's Guotai Junan International has obtained regulatory approval, opening a compliant channel for Chinese capital.
4.Technical support: The 50-day moving average has broken above the 200-day moving average, forming a "golden cross" that confirms the long-term upward trend.
BTCUSD
buy@106000~107000
SL:105000
TP:108000~109000
I am committed to sharing trading signals every day. Among them, real-time signals will be flexibly pushed according to market dynamics. All the signals sent out last week accurately matched the market trends, helping numerous traders achieve substantial profits. Regardless of your previous investment performance, I believe that with the support of my professional strategies and timely signals, I will surely be able to assist you in breaking through investment bottlenecks and achieving new breakthroughs in the trading field.
