Bitcoin Order Book - How To Trade ItBitcoin Order Book Analysis | Massive BTC Liquidity Zones You Need to Watch
In this video, we break down the Bitcoin (BTCUSD) order book and highlight the biggest buy and sell levels currently driving market sentiment. These are the exact price zones where whales and institutions are placing large orders—often creating powerful support and resistance that can trigger breakout or reversal setups.
In This Breakdown:
• Where major buy/sell walls are forming in the BTC order book
• How order book depth can predict short-term price direction
• Real-time liquidity pockets traders are watching now
• Key price levels to watch for possible long/short entries
This is a must-watch if you’re actively trading BTC and want to track where the smart money is stacking their positions.
⸻
Tools Featured:
• BTCUSD real-time chart
• Order book heatmap / depth
• Liquidity zone visualizations
• Volume profile overlays
• Sentiment Tool
⸻
Use this insight to position your trades around high-probability reversal or breakout zones. Comment your BTC target below, and follow for daily pro-level crypto insights.
⸻
#Bitcoin #BTCUSD #OrderBookAnalysis #BTCOrderFlow #WhaleActivity #LiquidityZones #CryptoTrading #PriceAction #CryptoTA #BitcoinStrategy
BTCUSD.PM trade ideas

Bitcoin's Bullish DriversThe four bullish drivers behind Bitcoin's rally:
1.Institutional involvement: BlackRock and other institutions have accumulated large positions through ETFs, with OTC inventory declining, creating a scarcity effect in the market.
2.Policy tailwinds: Escalating expectations of Federal Reserve rate cuts have enhanced Bitcoin's attractiveness under low-interest-rate environments.
3.Regulatory breakthrough: China's Guotai Junan International has obtained regulatory approval, opening a compliant channel for Chinese capital.
4.Technical support: The 50-day moving average has broken above the 200-day moving average, forming a "golden cross" that confirms the long-term upward trend.
BTCUSD
buy@106000~107000
SL:105000
TP:108000~109000
I am committed to sharing trading signals every day. Among them, real-time signals will be flexibly pushed according to market dynamics. All the signals sent out last week accurately matched the market trends, helping numerous traders achieve substantial profits. Regardless of your previous investment performance, I believe that with the support of my professional strategies and timely signals, I will surely be able to assist you in breaking through investment bottlenecks and achieving new breakthroughs in the trading field.

How about another RR2 Short?Lets try for a RR2 Sell..
Entry: 107100
SL: 108500
TP1: 106000
TP2:104800
See below for Reason and Full Analysis:

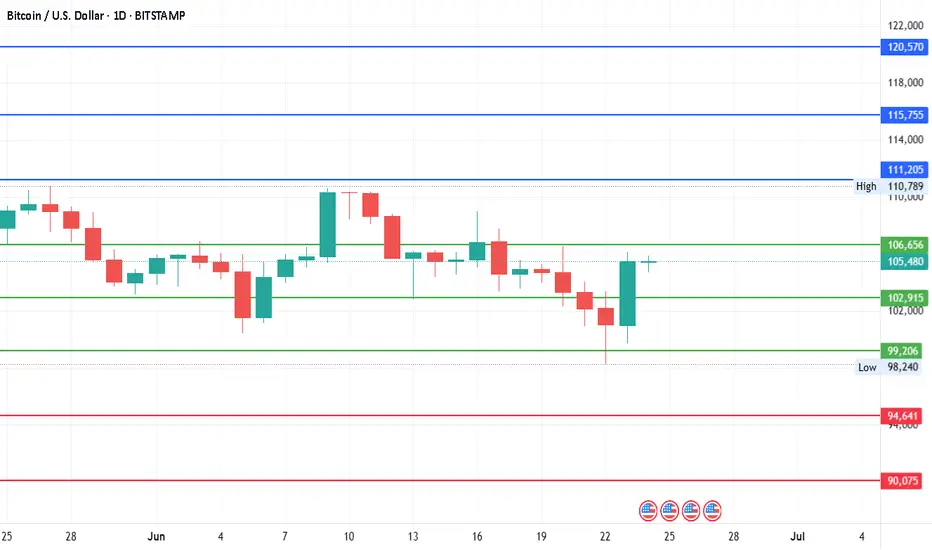
#Bitcoin - Pivot is $102915 | Target $125385 or $80445 ?Date: 24-06-2025
#Bitcoin
Current Price: 105375
Pivot Point: 102915.00 Support: 99206.48 Resistance: 106655.63
#Bitcoin Upside Targets:
Target 1: 111205.31
Target 2: 115755.00
Target 3: 120570.00
Target 4: 125385.00
#Bitcoin Downside Targets:
Target 1: 94640.74
Target 2: 90075
Target 3: 85260
Target 4: 80445.00
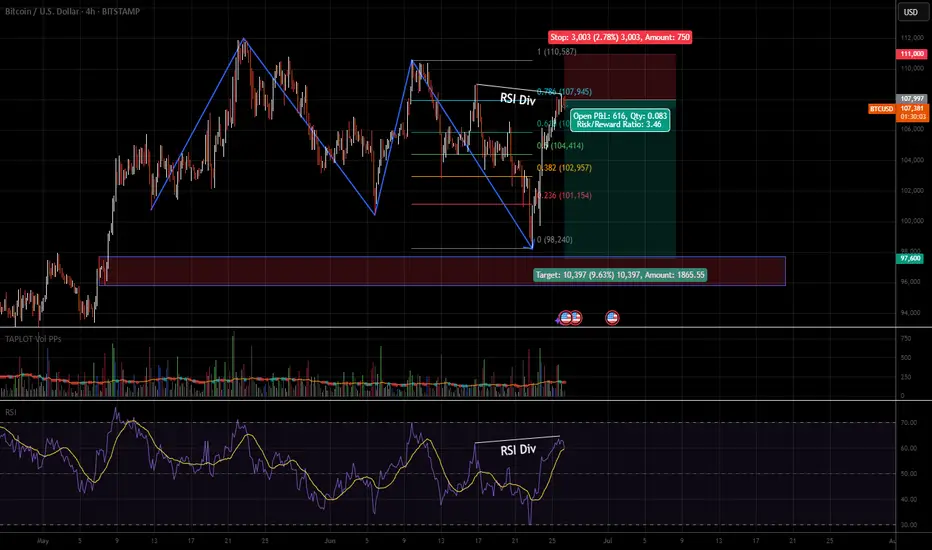
BTC Another Short SetupI want to try another BTC short position here.
BTC perform very well but we're still in QT.
RSI Div is obvious. Price going up but volume going down.
It's worth to try.
If you want to be in safe pos, wait till 1H structure break to bearish.
Bitcoin on Resistance levelMy current view. I am sitting mostly in cash waiting for a breakout or fall to buy the dip NFA

110K, maybe 112K at the bestMorning folks,
So, previous setup is done perfect, and BTC even reached 108K area. Now we think that upside potential is limited, at least in short-term. Price is coming to resistance area around 110K and previous top. Some intraday targets point on 112K area as well, but I wouldn't count now on something more extended.
The point is US Dollar stands at record monthly Oversold. So, its weakness in short term is limited as well. Besides, we're coming to very bumpy period of tariffs negotiations from 9th of July, debt ceil discussion and BBB voting, as early as tomorrow...
So for now, uncertainty and risk overcome the upside potential on BTC.

Bitcoin is gearing up for 120K and 140K (1D)The flip zone has been reclaimed, but no proper pullback had occurred. The recent pullback came with a sweep of the all-time high (ATH), which has caused confusion and uncertainty among market participants.
In fact, this drop can be interpreted as a pullback to the flip zone, accompanied by an ATH hunt.
We expect the price, after touching the green zone and forming a base around this level, to move toward the targets of 120K and 140K — which we currently consider as Bitcoin’s final targets for this cycle.
A weekly candle close below the invalidation level would invalidate this analysis.
For risk management, please don't forget stop loss and capital management
When we reach the first target, save some profit and then change the stop to entry
Comment if you have any questions
Thank You

BTC BUY NOW ?BITSTAMP:BTCUSD
Bitcoin flushed out .
Next Impulse started from 98200 - 98400 range.
Entered long @98700 with SL the low.
Expecting a rally & holding it to ATH
Small Risk and changing SL to CtC when it crosses 100300

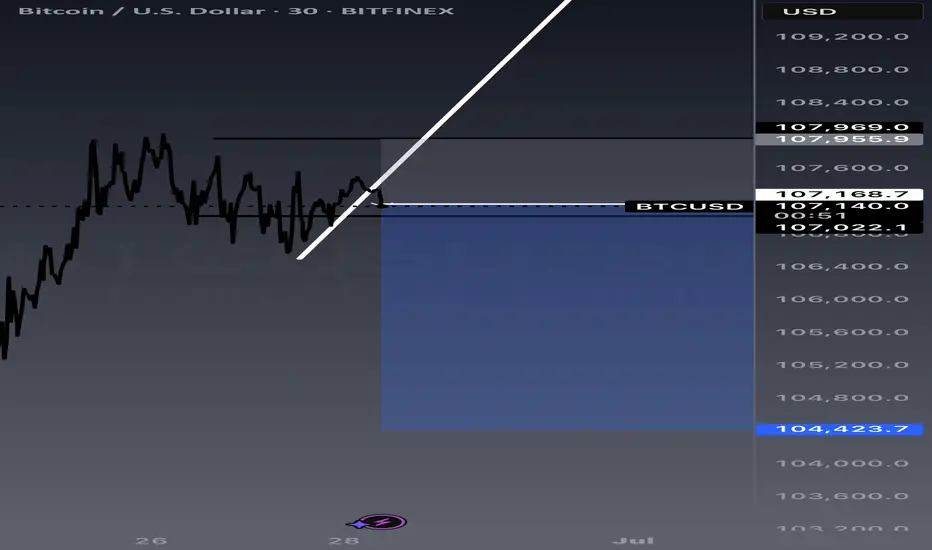
Bitcoin Price Chart Analysis (30-Min, BITSTAMP🔍 Key Observations:
1. Resistance Zone (106,500–107,000):
Price is testing a strong horizontal resistance area, marked by the green rectangle.
This zone has acted as resistance multiple times (highlighted with orange circles), suggesting supply pressure.
2. Triple Top Formation:
The three orange circles mark failed breakout attempts at the resistance level, forming a triple top pattern, a bearish reversal signal.
Each top is followed by a price drop, showing seller dominance near this zone.
3. Current Price Action:
Price is currently at 106,777, near the resistance peak again.
A downward arrow points to a projected target of 104,399, implying a potential short-term bearish move if rejection happens again.
4. Support Zones:
104,399 is marked as a short-term target and potential support level.
A major support zone also exists around the 100,000 level, indicated by the green horizontal box and upcoming economic events (red/blue news icons).
5. Trendlines & Patterns:
Earlier trendline breakouts (rising wedge and falling wedge) led to short rallies and corrections.
The most recent bullish move seems to be losing momentum at this resistance.
---
📉 Conclusion:
The chart suggests a bearish bias in the short term unless Bitcoin breaks and holds above the 107,000 resistance level.
If rejected again, the price may fall toward the 104,399 target, and possibly lower if bearish momentum strengthens.
Traders may look for confirmation (e.g., bearish candlestick patterns, volume drop) before entering short positions.

BTCUSD – Short Setup in Play📉 BTCUSD – Short Setup in Play
Exchange: Coinbase | Timeframe: 1D
Price has just tapped into a key supply zone after reclaiming a prior level, but momentum looks overextended. If the rejection holds, I’m expecting a drop toward the 103.3K zone, with possible continuation into 102.8K and below.
🔽 Short Bias Active
📍 Entry Region: 107.8K
🎯 Target: 103.3K
⛔ Invalidation: Clean breakout above 112K
A pullback first wouldn’t surprise me—liquidity still needs to be swept.
Let’s see how BTC behaves at the highs. ⚔️
#Bitcoin #BTC #Crypto #PriceAction #TradingView #BTCUSD #GlobalHorns

BITCOIN'S BIG BOUNCEBitcoin’s daily chart shows a textbook liquidity sweep followed by a strong recovery. After dipping below the critical $100,000 psychological level late last week, price tagged a low around $99,000 before reversing sharply. This move likely shook out overleveraged longs and trapped breakout shorts – setting the stage for a high-volume bounce. Importantly, BTC reclaimed both the $100,716 horizontal support and the 50-day moving average – signaling renewed short-term bullish momentum.
Currently, Bitcoin is trading just below the key resistance level at $105,787 – a price zone that has repeatedly acted as a ceiling throughout June. A decisive breakout and close above this level would likely open the door to a move toward the $112,000 range highs. Until then, $105,787 remains the level to beat. If price rejects from here, the $100K zone becomes crucial once again – with $92,817 as the next major support below.
Volume has been supportive on the bounce, suggesting real demand stepped in on the sweep of the lows. For bulls to maintain control, they’ll want to see continued strength above the 50-day moving average and a clear break of resistance. For now, the structure looks constructive – but the next couple of daily closes will determine whether this was just a relief rally or the start of a broader continuation higher. We are basically trading between two key levels in a small range.

Bitcoin Break: Watch 100K Revesal Or Test Of 95K.Bitcoin broke 100K support without any type of retrace attempt (YET). This move which is attributed to global events should not be entirely surprising. Most importantly do not OVERREACT, especially with all the nonsense hype this will generate. Here is a more effective way to process the current situation.
Avoid bias and pay attention to the bigger picture. In terms of wave count, Bitcoin can technically retest the 85K area and STILL be considered within a broader Wave 4. This implies the broader structure is still BULLISH (Wave 1 overlap). A swing trade or investing buying opportunity can develop in the 95K area or lower (see illustration).
The short term momentum is bearish as per break of 100K. This should guide shorter time frame strategies like day trades. A new bearish trend line is in play (see arrow). At this point without any meaningful reversal pattern in play (4H or above) look for bearish continuation patterns like consolidations (triangles) inside bars, etc. The 95K support would be a price objective to consider if you are open to aggressive short strategies. Keep in mind, shorting into such a low is HIGHLY risky and best suited for those who have adequate experience.
This situation proves once again, "expert" opinions mean nothing. A few short weeks ago, Bitcoin was poised to break out and everyone was going to be rich again (remember the Bitcoin conference?). So much for that. The market does NOT care what you, me or Michael Saylor thinks. It reflects the perception of the future, whether or not that future plays out.
This is precisely why CHARTS can offer value in terms of measuring potential and RISK. You don't even need to be that technical, just take a look at the weekly time frame. The previous week's bearish pin bar low was broken signaling weakness, NOT Bitcoin 100 million K.
Thank you for considering my analysis and perspective.

BTCUSD HTFBitcoin is a decentralized digital currency that you can buy, sell and exchange directly, without an intermediary like a bank. Bitcoin’s creator, Satoshi Nakamoto, originally described the need for “an electronic payment system based on cryptographic proof instead of trust.”
Every Bitcoin transaction that’s ever been made exists on a public ledger accessible to everyone, making transactions hard to reverse and difficult to fake. That’s by design: Core to their decentralized nature, Bitcoins aren’t backed by the government or any issuing institution, and there’s nothing to guarantee their value besides the proof baked in the heart of the system.

1 Year of Bitcoin Bull Run Remaining? In the chart above, we’re analyzing Bitcoin’s historical cycles to see if the current cycle follows a similar pattern.
Bear Run (1 Year): In each of the last three cycles, Bitcoin experienced a bear market lasting exactly 1 year from the all-time high (ATH). This phase saw a significant drop in price as the market corrected.
Bull Run from Bottom (1,064 Days): In the last two cycles, once the bottom was established, Bitcoin entered a consistent bull market that lasted approximately 1,064 days. During this period, the price gradually climbed, eventually reaching new highs.
Current Bitcoin Cycle:
So far, the current cycle appears to be following the same pattern as previous cycles. We’ve already experienced a 1-year bear market after reaching the previous all-time high (ATH).
Currently, we have completed 2 years of a bull run from the bottom, aligning with the 1,064-day bull run observed in past cycles. Based on this historical pattern, we may have 1 year of bull run remaining, which could potentially push Bitcoin to new highs by late 2025.
If this trend continues, it suggests a strong opportunity for growth over the next year, mirroring the end phase of past cycles.
BINANCE:BTCUSDT BITSTAMP:BTCUSD CRYPTOCAP:BTC
Regards
Hexa

Multiple confirmations on BTC sellsWe see BTC losing momentum on 4hr time frame. HL was just broken creating a LL, then we see price forming multiple bearish candles at poi. CTL is broken confirming this idea for potential entry!
#BTCUSD Buy 107248.20#BTCUSD Buy 107248.20
SL 106648.20
TP 107448.20
TP 108248.20
TP 109648.20
Trade at your own risk
Protect your capital
The Wizard 🧙♂️ SWFX

BTCUSD TRADE SETUP 📈 **Bitcoin (BTC/USD) 1H Chart Analysis — June 28, 2025**
🔍 **Pattern Identified: Bullish Flag Breakout**
🧠 **1. Market Context**
* This is the **1-hour chart** of **BTC/USD** on Binance.
* Price recently formed a **bullish flag pattern**, which is a **continuation pattern** signaling a potential breakout in the **direction of the previous trend (upward)**.
🔧 **2. Technical Breakdown**
🔹 **Trend Before the Flag**
* Price had a strong **impulsive move up** from \~105,000 to \~107,800.
* That was followed by a **consolidation phase** forming a downward sloping **channel** (blue parallel lines), creating the **flag**.
🔹 **Flag Channel**
* Price oscillated inside this flag for nearly 2 days (June 26–28).
* The **channel** is clearly defined, and price **respected both upper and lower bounds** during the consolidation.
🚀 **3. Breakout Confirmation**
* Price has now **broken out of the upper boundary** of the flag.
* A clean **break and candle close** above the trendline suggests **bullish momentum** is returning.
* This breakout is occurring around the **107,400–107,800** zone, which is also a **key structure level** acting as local resistance.
---
🎯 **4. Trade Setup**
✅ **Entry:**
* Around **107,400–107,800**, post-confirmation of the breakout.
❌ **Stop-Loss (SL):**
* Placed just below the **flag support / demand zone**, around **106,800**.
* This protects against a fake breakout or pullback into the flag.
🎯 **Target (TP):**
* Projected at **110,000**, which is aligned with the height of the initial flagpole projected from the breakout point.
* This also represents a psychological round number and a previous resistance level.
---
📊 **Risk-Reward Ratio (RRR)**
* **RRR = \~3:1**
* For every \$1 risked, the potential reward is \$3 — **excellent reward structure**.
---
📌 **Key Insights for the Traders**
* This is a **classic bullish flag breakout** play—very reliable in trending markets.
* **Volume confirmation** (not shown in chart but should be checked live) is important — higher volume during breakout gives stronger conviction.
* Watch for a possible **retest of the breakout level** (around 107,800) before the next move up.

BTC Consolidates Above Pivot – Bullish Momentum Toward 113,770?BITCOIN OVERVIEW
Crypto Breakout or Crash? Powell's July Message Becomes the Deciding Factor
Federal Reserve Chair Jerome Powell’s testimony on Capitol Hill has intensified the uncertainty surrounding risk assets.
He emphasized that while inflation has eased significantly since mid-2022, it remains “somewhat elevated”, and the Fed is in no rush to shift its policy stance.
This leaves markets with a binary outcome: crypto breakout or macro-driven pullback—and July may be the turning point.
TECHNICAL OUTLOOK – BTC/USD
Bitcoin remains in bullish momentum, having stabilized above the pivot level at 107,750.
The price is currently pushing toward the key resistance zone between 108,950 and 110,360.
A breakout above this zone would likely lead to continuation toward the next ATH target at 113,770.
However, consolidation is expected between 108,950 and 106,320 until a breakout occurs.
Key Levels
Pivot Line: 107,750
Resistance: 108,950 → 110,360 → 113,770
Support: 106,320 → 104,150

Decoding the Dollar's Next MoveThe Dollar Index (DXY) currently stands at a critical crossroads, with its weekly close below 98.00 poised to dictate the trajectory of major asset classes for the coming weeks. The DXY closed as a bearish weekly candle at 97.2, confirming the "Bearish Dollar Scenario" as it closed below the 98.00 level. The market sentiment is currently cautious, awaiting clear directional cues from the DXY2. Our analysis will explore the Bearish Dollar Scenario, outlining potential price movements and actionable recommendations across a range of correlated assets

btcusd bitcoin entering bear market that will last 1 year to 20kBearish divergence on rsi and mcad indication of bear market that usually last year.
Bottom is approximately 20k were also unfilled CME gap still exists.

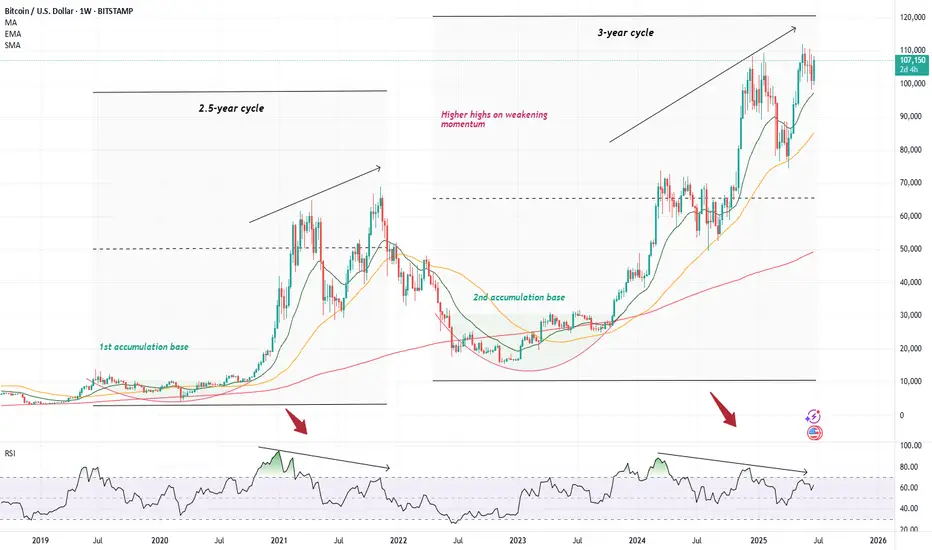
Cautionary tale on BitcoinI decided to temporarily depart from my usual trade ideas to wave a cautionary finger at the chart of Bitcoin, where I have noticed a rather worrying pattern within the weekly charts. However, before I delve in, I would like to stress that I am a very rigid believer in the long-term prospect of our monetary saviour and what I am supposed to write about only concerns the usual, inevitable cyclicality that always entails the otherwise upward-sloping trajectory of Bitcoin ( CRYPTO:BTCUSD )
Although overall this has not felt like much of a crypto bull run given the apparently absent performance of altcoins (apart from an occasional 1000x on a well-targeted memecoin), Bitcoin has, in the meantime, trod its usual path upwards. Since the '22 lows, it has mimicked its regular pattern where after a devastating plummet lower, it has spent several long months accumulating until it has burst out of its cocoon to provide a 6x return to its strong believer. However, the mimicking is almost too good as we have now started painting a very similar picture to what eventually transpired to be the '21 top. We have reached a strong above >100k top only to hit a vicious correction (announcement of tariffs), similar to what Bitcoin did in May of 2021 (China crackdown, tech selloff). The price then quickly consolidated - which I am not an avid fan of as a formation of a more robust base would be more preferable (though would take longer ) - and bitcoin shot back up again, quickly reclaiming the previous highs; just like it did in October/November 2021. This creates an unfortunate setup best represented by the series of lower highs on an RS I while the price keep climbing higher - creating the probably best-know bearish signal with higher highs built on weaker and less robust momentum.
We know how this ended in 2021, and I am not suggesting that Microstrategy should blow up, go bankrupt and sell all its bitcoin (though definitely a possibility) - however, one must admit that there are currently quite a lot of uncertainties that could unwind at any time (one such coming on July 8th with the second version of the lets-blow-up-the-stock-market day). With a stock market priced to perfection, and with what seems like a large pile of uncertainties hovering in the air, it seems like any one of these could light up the fire underneath these lovely valuations we have reached, and although I would love for cryptocurrency prices to be completely independent of the stock market, we usually know how this goes.
So, what to do about this? Preferably nothing . If you are as much of a believer as I am in the necessity of bitcoin in today's financial world, this is just another blip in an otherwise long and profitable ride. So, I won't be any selling any of it - hopefully only adding once we decline. I would also add that I am not expecting as much of a bloodbath as last time. I think Bitcoin has reached a point where the 80-90% declines become very rare. However, regarding my other allocations in crypto assets, I am not as optimistic, hence I decided to sell most of everything else. Although I love the premise of Ethereum, the chart looks pretty horrific, currently drawing a perfect head-and-shoulder on a 4h chart (which I might write about as well as a short idea).
I will end this essay the same way I started it - I know absolutely nothing, and maybe I will come back at the end of the summer, beautifully tanned and relaxed as we all are in Europe, and find everything at all-time highs. I just currently believe the risk-reward ratio is not skewed in my favour, and I don't know how about you, but I tend to listen to my probability gods, especially on the eve of another strong SPAC year .
103 to 101K trade and reverse H&S patternMorning folks,
So, our Thu setup is done perfect, both targets are met and even more. Now we consider two different fast trades on BTC.
Now context remains bearish and 103K is rather strong 4H resistance area. So, first trade is scalp "Sell" from ~ 103K with "at least" target of 101K. In fact, choosing of 101K as a minimal target is based on the 2nd trade.
2nd trade is potential reverse H&S is sentiment on the market will start changing. But this is not the fact yet. That's why I place downside arrow here as well, if H&S will not be formed or start failing, BTC could drop lower so, downside trade might be even better.
