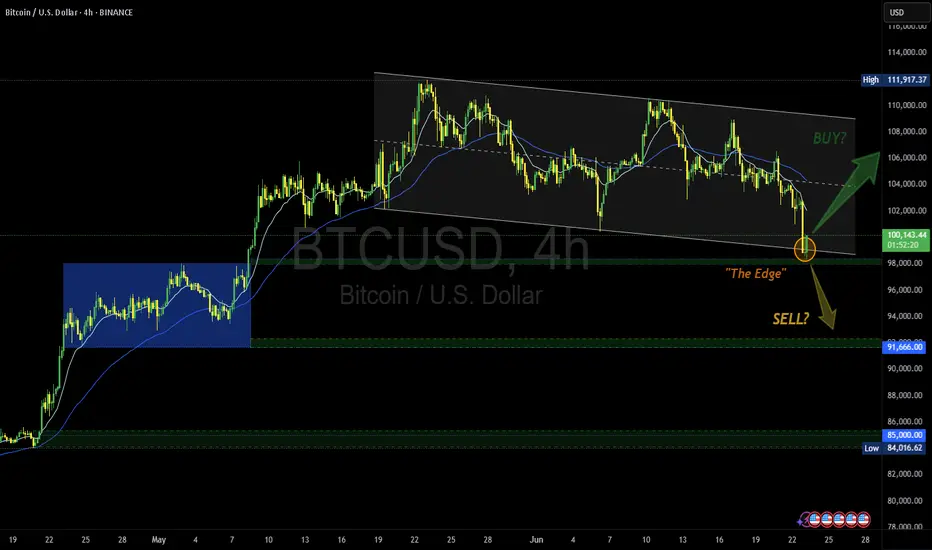
Another Edge - Decision time | Buy? or Sell? share your opinionTitle: BTCUSD: At The Edge – Decision Time Looms
Idea: Bitcoin is currently flirting with "The Edge"—a key decision zone near $98,000 where trend dynamics could shift sharply. After touching the lower boundary of a descending channel, BTC is testing support that could mark either a springboard for a bullish reversal or a trapdoor for further downside.
If bulls reclaim territory above the descending resistance line and push toward $104,000, we may see a trend breakout and renewed upside momentum. Confirmation with volume would strengthen the case for a long position, targeting the $111,917 level.
However, failure to hold "The Edge" could open the door to a swift move lower toward the $91,666 then $85,000 support zone, especially if accompanied by broader risk-off sentiment.
Trade Plan:
• Long above $100K with confirmation and strong volume;
target $111,917.
Stop below $97K.
• Short on breakdown below $97K with bearish momentum;
target $91,666.
Stop above $100K.
Watching: Volume spikes, macro news, and behavior around the channel boundaries.
🚀 Will Bitcoin bounce off the edge—or fall into the abyss?
#MJTrading #BTC #Bitcoin #Buy #long #chart #signal #forex
BTCUSD.PM trade ideas
BTCUSD ATH Hunt is onBTCUSD will shoot up very soon. A bullish flag emerging right in time. Trump announces ceasefire and potentially stops WW3, what a Hero. Stock up on some of this coin you're gonna need it.

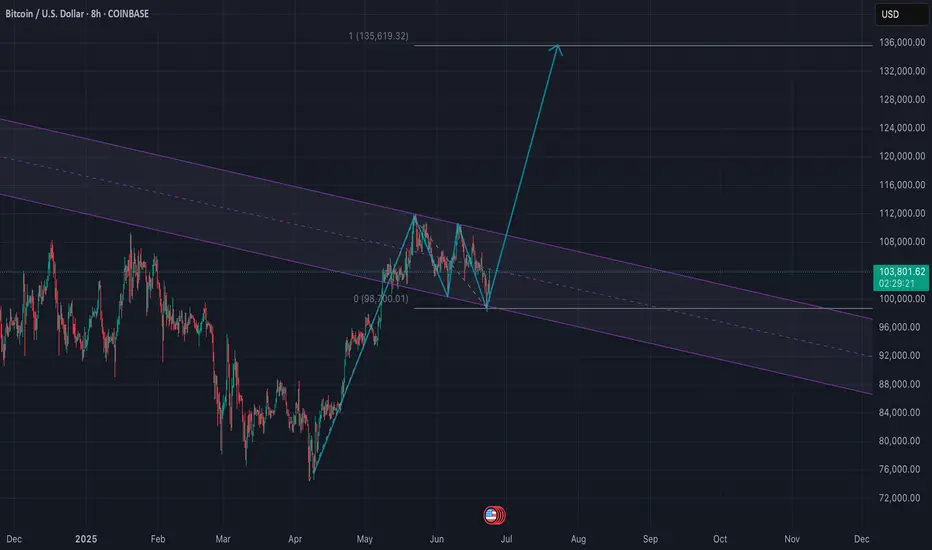
Next target, minimum $135kTo me this looks like a very obvious bull flag. Next target, $135k derived from the length of the flag pole and repeating it from the recent low.
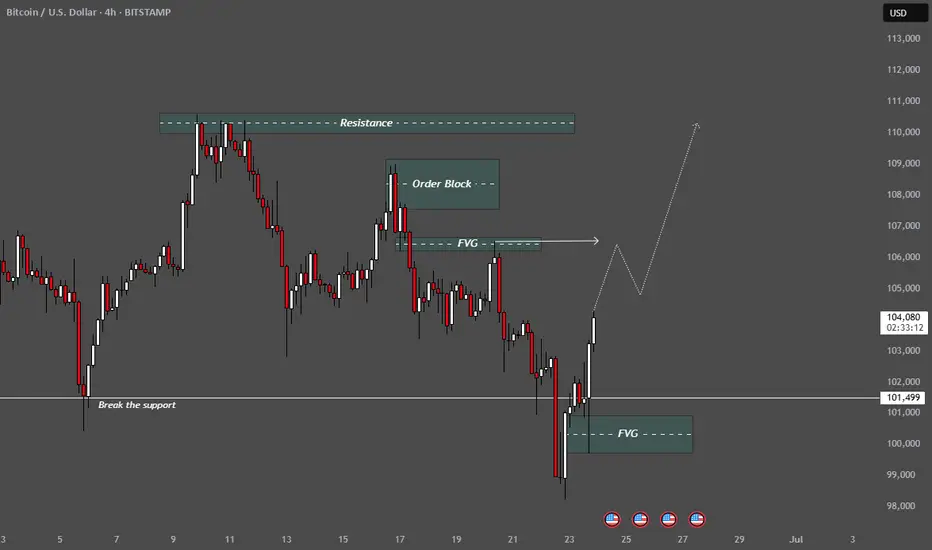
Liquidity grab below support, FVG and OB structures,1. Support & Resistance Levels
Resistance Zone (highlighted at the top):
Around the 110,000–112,000 range.
Previous Support (horizontal line at 101,499):
Labelled as “Break the support” — price had broken below it but is now pushing back above.
📦
Smart Money Concepts (SMC):
2. Order Block (OB)
Marked near 105,000: A key supply area where institutional activity likely occurred. Price may react here (retest or rejection).
3. FVG (Fair Value Gaps)
Two zones marked as FVG:
Lower FVG around 100,000–101,000: recently filled and acted as support.
Upper FVG just above 105,000: potential target zone before price pushes higher.
📈
Projected Price Path:
The dotted white line shows a bullish forecast:
Price breaks back above the previous support.
Pulls back into the FVG or OB.
Then rallies toward 110,000+ resistance zone.
🧠
Interpretation:
This analysis suggests a bullish reversal scenario based on:
Liquidity grab below support,
FVG and OB structures,
Expectation of institutional buying and upward continuation.
BTCUSD 4-Hour Analysis – Sell Setup IdeaCurrently, the trend on BTCUSD is bearish. On the 4-hour chart, I’m watching for a reaction at the Balanced Price Range (BPR) zone. This area aligns with a daily Rebalanced Breaker (-RB), adding higher time frame confluence.
In addition to the BPR, there’s an Order Block (OB) within the same region, and a nearby swing high, which strengthens the case for a bearish reaction. If price respects this zone, I expect continuation to the downside targeting the 98,000 and the 96,000 price level.

BTCBTC will be moving sideways and a drop for the next few days.
Disclosure: We are part of Trade Nation's Influencer program and receive a monthly fee for using their TradingView charts in our analysis.

B/$We have already seen a level below $100,000.
I think there is still more to go before it turns up.
I don't see any resistance for a trend reversal at the moment.
So you can hold your short positions and just move your stop loss even lower.

Bitcoin Holds $100k as Risk Assets Shrug Off Mideast TensionsWeakness in risk assets has been relatively contained so far on Monday in Asia, despite the escalation in geopolitical tensions in the Middle East over the weekend—including in bitcoin.
Yes, it’s down, but not by any margin that sets this open apart from the usual. And having bounced after a brief dip below the psychologically important $100,000 level—which also doubles as wedge support—it’s generated a potential long setup if risk appetite improves.
Longs could be considered above $100k with a stop beneath today’s low to protect against a reversal. Targets include $102,500, $106,500 or even $109,000, depending on your preferred risk-reward.
While momentum signals are neutral to mildly bearish, the price action so far has been constructive for the setup.
Good luck!
DS

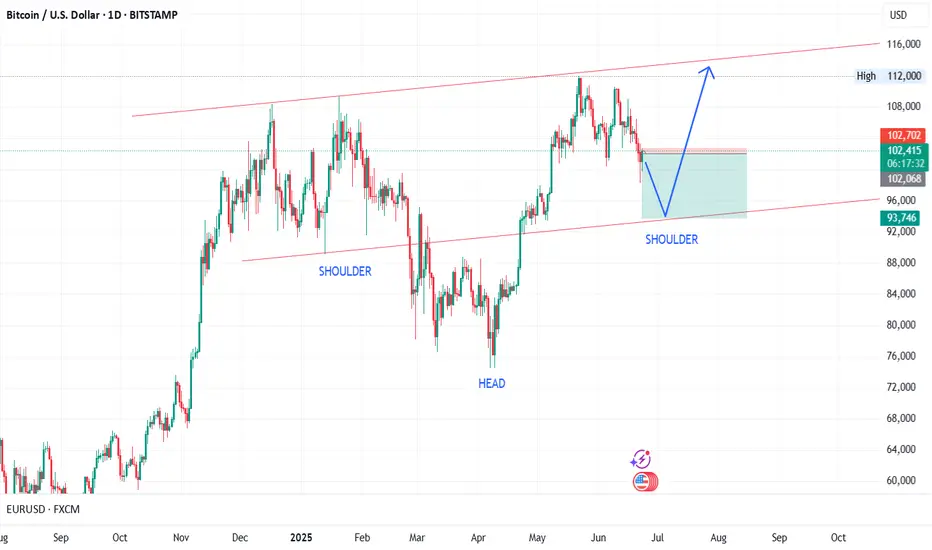
BTC short because head and shoulders pattern.It shows a baseline with three peaks with the middle peak being the highest. The head and shoulders chart pattern depicts a bullish-to-bearish trend reversal and it signals that an upward trend is nearing its end.
WAW we ended up again following my imaginary lines .... I'm seeing a potential upside: if war accelerates government spending, it could push central banks to print more money — and that could be fuel for Bitcoin.
Historically, wars come with massive fiscal demands. Governments tend to ramp up military budgets, fund support packages, and stimulate their economies to manage instability — and that often leads to increased money printing.
More fiat currency in circulation typically leads to inflation or a devaluation of purchasing power. In that kind of environment, investors and everyday people start looking for stores of value outside of traditional currencies — like gold, real estate… and now, Bitcoin.
Bitcoin was literally born in response to central banks abusing the money printer. Its fixed supply — 21 million coins — makes it an attractive hedge against inflation and monetary debasement. If war accelerates global instability and fiscal irresponsibility, Bitcoin could benefit as a safe-haven asset.
So yes — war is tragic. But in purely macroeconomic terms, if it triggers massive government spending, printing, and inflation, it could send Bitcoin flying.

Bitcoin Tests Key Support-Healthy Correction Within Bull MarketHealthy Pullback, Strong Structure:
Bitcoin’s recent dip is a constructive correction within a broader bull trend, as it tests the critical $100,000–$105,000 support zone—a former resistance area from early 2025.
Institutional Demand Holds the Line:
Maintaining levels above the psychologically important $100,000 mark highlights continued institutional accumulation and reinforces the underlying strength of the trend.
Momentum Reset, Base Building:
This pullback has helped reset overbought conditions from the prior rally, laying the foundation for the next potential leg higher.
Key Levels to Watch:
Support: $100,000–$105,000
Breakout Trigger: A close above $108,000 would confirm uptrend continuation
Outlook: Bullish bias remains valid as long as support holds
Investor Opportunity:
With structure intact and downside contained, this consolidation presents a favorable risk-reward setup for long-term investors looking to position ahead of a potential breakout.
#Bitcoin #BTC #CryptoMarket #TechnicalAnalysis #SupportAndResistance #BullMarket #RiskReward #InstitutionalBuying #MarketOutlook #PriceAction

Bitcoins next stop, $93-96k?I think we will go lower to test the area below on the daily chart where the quarterly anchored vwap and 200ma are both hanging out together. I will be watching for direction at this level based on price action when we get there. Not financial advice.

BTCUSD SELLSMajor H4 zone has been broken and retest is being made. Possible for price to continue further down to next support zone around 96,000

$BTC Heading to the Long-Awaited 200DMA Retest ~$96kFULFILL THY PROPHECY 📖
CRYPTOCAP:BTC making its way down to the long-awaited 200DMA retest, which just so happens to show confluence with the .618 Fib level at $96k.
RSI shows a bit more room to the downside as well.
Make sure to get those bids in!

BTC-bias shortBearish indications:
Trend line support broken.
Major support broken.
Evening star candle in 4 hr before the support break.
Made a new low.
MA 21 being respected in 5 min.
formation of HS in 5 min while support break.
Bullish indications:
Bullish divergence in 15 min.
Trade plan bias short @ 103880
SL:104725
TP1:102970
TP2:102188
TP3:101351

BTC SWEEPS THE LOWSBitcoin just performed a textbook liquidity sweep, dipping below the psychological $100,000 level and the early June swing low near $100,377. This move triggered stop-losses and drew in short positions before quickly rebounding back above support – a classic example of "grab and go" price action designed to collect liquidity.
This kind of move often traps impatient bears and can act as a springboard for a short-term reversal if bulls manage to hold the reclaimed level. While today’s candle hasn’t closed yet, the wick below $100K shows aggressive buying interest. If we see confirmation over the next couple of days – particularly with a close back above the key $101,450–$101,800 range – it strengthens the case for a bounce.

CHECK BTCUSD SIGNAL READ CAPTAINbtcusd sell now ✅
entry point (101850.00) (101700.00)
TAKE PROFIT 1: (101200.00)
TAKE PROFIT 2: (100450.00)
LAST TARGET(99700.00)
STOP LOSS (102400.00)

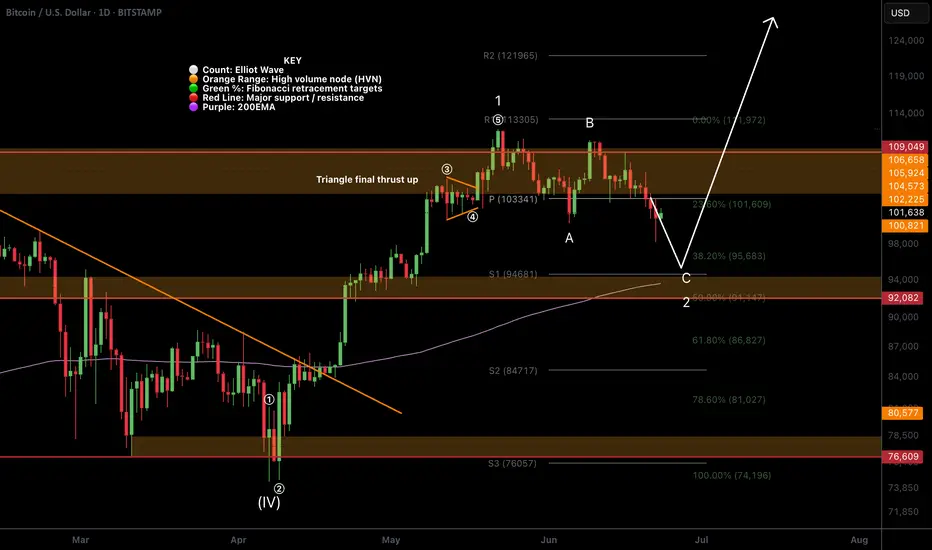
BTC Textbook Elliot Waves!CRYPTOCAP:BTC local analysis hasn't changed in a few weeks.
Price printed another text book Elliot motif wave, with the wave 4 triangle terminal pattern ending in the usual thrust up with a poke above all time high.
Price is also printing a textbook ABC for wave 2 with 5 waves down for A, 3 waves up for B and a strong wave C down to finish. Wave C's are always the strongest.
Pattern suggests price has one more push lower to complete this corrective wave tapping the quadruple support: S1 daily pivot, ascending daily 200EMA, major support High Volume Node (HVN) and 0.5 Fibonacci retracement at 92-94k range.
Most investors are publicly calling for buys in this area so price may be front run by the whales! The consensus often do not get what they want.
Safe trading
Bitcoin (BTC): Buyers Took Back Control Over $100KBitcoin has bounced and showed some buyside volume near major support area near $100K. After the re-test of 100EMA where price dipped lower than $100K we have had a decent recovery every since.
Monday is starting strong with price jumping back above $100K and most probably we will see some fruther buyside dominance from here.
Swallow Academy

BTC/USD:Intraday Trading Analysis and StrategyI. Daily Chart Trend Analysis
On the daily timeframe, BTC/USD closed with a small bearish candle yesterday, forming a consecutive series of bearish candles that clearly indicate a downtrend. The price continues to trade below the moving average system, and the technical indicators have formed a death cross, further confirming the bear-dominated market structure. However, in this clear downtrend, two key risks require attention:
1.Oversold rebound risk: After sustained declines, the market may experience a significant corrective rally.
2.Priority of risk control: Regardless of market movements, strict stop-loss management and position sizing remain core trading principles.
II. Hourly Chart Technical Analysis
The hourly chart shows that the price fell sharply under selling pressure during U.S. trading hours yesterday, breaking below the key $100,000 level. This morning, the price rebounded strongly after hitting a low, with the breakdown level near $102,700. Currently, the K-line forms a large bullish candle, and the technical indicators have formed a golden cross, suggesting that a corrective rally is likely to continue today. Note that if the price breaks above the breakdown level of $102,700, the short-term downtrend may be disrupted, and the market could shift to a range-bound pattern.
BTCUSD
sell@102000-102500
tp:101000-100500
I am committed to sharing trading signals every day. Among them, real-time signals will be flexibly pushed according to market dynamics. All the signals sent out last week accurately matched the market trends, helping numerous traders achieve substantial profits. Regardless of your previous investment performance, I believe that with the support of my professional strategies and timely signals, I will surely be able to assist you in breaking through investment bottlenecks and achieving new breakthroughs in the trading field.

Bitcoin's Failed 60-Day Cycle: Relief Rally Before More DownsideBitcoin has officially failed its current 60-day cycle by breaking below the previous cycle low on June 5th, touching $100,000. This marks a key structural shift that traders should not ignore.
📉 What’s Next? Likely Scenario:
The highest probability setup now is a relief rally toward the Stoch RSI highs on the 1-Day and 3-Day timeframes, followed by a move downward into the 60-day cycle low, projected to form between late July and early August. This aligns with a potential retest of the Value Area Low from April, a key support zone to watch.
📈 Upside Target:
If we do see bullish continuation in the short term, the main upside target is $105,000. This level is significant as it clusters three Weekly Point of Control (POC) levels from May and June, making it a high-liquidity magnet for price. Historically, Bitcoin tends to gravitate toward these levels when several align closely.
💼 Current Positioning:
I’m currently long BTC and ETH, and I’m watching closely for Stoch RSI to top out on the 1-Day and 3-Day timeframes. I’ll look to reduce or exit those positions as we approach those cycle peaks.
🔔 Pro Tip: Price often seeks out stacked POC levels. If you’re a volume profile trader, keep $105K on your radar.
📌 P.S. For access to my custom indicators and deeper cycle analysis, check the description in my profile.

BTC To new ATH, Let's bet!For my followers, they know I dont usually write out the reasons for a trade during the week unless on weekends, reason been the nature of my trades. I enter on market orders and then I post, any time wasted to be outlining reasons will make them not to enter the trade.
BTC is still bullish, I know the bears are coming, they always do, I know the cycle will end, it always does but now is not the time. Main reason is, everyone is now bearish.
The chart hasn't also showed bearish signs, just retracement.
I highlighted below 100k as my next POI because of the liquidity there, I've been buying since yesterday, I hope you do too. If not, this is another opportunity.
For those that said R:R is big, Learn to hold your winning trades please, in that way you'll maximize profit and also reduce frequency of trades. If you can't, just open a new account, fund $100 and then trade my signals there. The account will be bigger than your main account by this years ending.
I trade forex too, if you've any question regarding how you'll do this, ask away in the comment section
I will show you how I do it
Now someone said we wont be seeing a new ATH. I think he is very wrong and knows nothing. I will attach a post I made when BTC went below 77k and I was bullish and I outlined the reasons there.
Enjoy
Please, hold this trade.
Follow me as my trades are market orders, so you'll see them no time and enter them on time.
BTC GLOBAL M2 LAG - NEXT TARGET 140K +The chart shows Global M2 on a 12-week lag. Notice how closely BTC price aligns. If current trend continues, we should see 140k or so by September.
