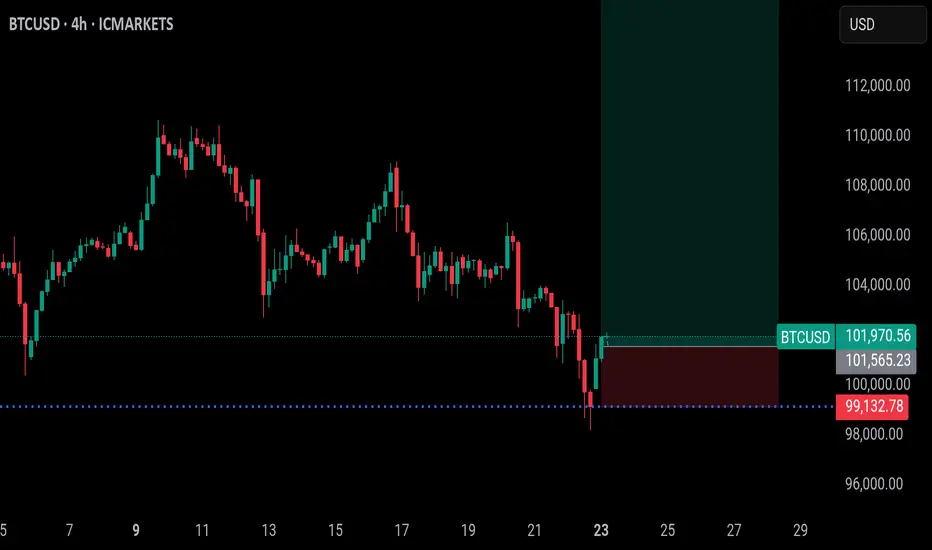
Bitcoin's Failed 60-Day Cycle: Relief Rally Before More DownsideBitcoin has officially failed its current 60-day cycle by breaking below the previous cycle low on June 5th, touching $100,000. This marks a key structural shift that traders should not ignore.
📉 What’s Next? Likely Scenario:
The highest probability setup now is a relief rally toward the Stoch RSI highs on the 1-Day and 3-Day timeframes, followed by a move downward into the 60-day cycle low, projected to form between late July and early August. This aligns with a potential retest of the Value Area Low from April, a key support zone to watch.
📈 Upside Target:
If we do see bullish continuation in the short term, the main upside target is $105,000. This level is significant as it clusters three Weekly Point of Control (POC) levels from May and June, making it a high-liquidity magnet for price. Historically, Bitcoin tends to gravitate toward these levels when several align closely.
💼 Current Positioning:
I’m currently long BTC and ETH, and I’m watching closely for Stoch RSI to top out on the 1-Day and 3-Day timeframes. I’ll look to reduce or exit those positions as we approach those cycle peaks.
🔔 Pro Tip: Price often seeks out stacked POC levels. If you’re a volume profile trader, keep $105K on your radar.
📌 P.S. For access to my custom indicators and deeper cycle analysis, check the description in my profile.
BTCUSD.PM trade ideas

BTC To new ATH, Let's bet!For my followers, they know I dont usually write out the reasons for a trade during the week unless on weekends, reason been the nature of my trades. I enter on market orders and then I post, any time wasted to be outlining reasons will make them not to enter the trade.
BTC is still bullish, I know the bears are coming, they always do, I know the cycle will end, it always does but now is not the time. Main reason is, everyone is now bearish.
The chart hasn't also showed bearish signs, just retracement.
I highlighted below 100k as my next POI because of the liquidity there, I've been buying since yesterday, I hope you do too. If not, this is another opportunity.
For those that said R:R is big, Learn to hold your winning trades please, in that way you'll maximize profit and also reduce frequency of trades. If you can't, just open a new account, fund $100 and then trade my signals there. The account will be bigger than your main account by this years ending.
I trade forex too, if you've any question regarding how you'll do this, ask away in the comment section
I will show you how I do it
Now someone said we wont be seeing a new ATH. I think he is very wrong and knows nothing. I will attach a post I made when BTC went below 77k and I was bullish and I outlined the reasons there.
Enjoy
Please, hold this trade.
Follow me as my trades are market orders, so you'll see them no time and enter them on time.
Bitcoins next stop, $93-96k?I think we will go lower to test the area below on the daily chart where the quarterly anchored vwap and 200ma are both hanging out together. I will be watching for direction at this level based on price action when we get there. Not financial advice.

BTC GLOBAL M2 LAG - NEXT TARGET 140K +The chart shows Global M2 on a 12-week lag. Notice how closely BTC price aligns. If current trend continues, we should see 140k or so by September.

$BTC Heading to the Long-Awaited 200DMA Retest ~$96kFULFILL THY PROPHECY 📖
CRYPTOCAP:BTC making its way down to the long-awaited 200DMA retest, which just so happens to show confluence with the .618 Fib level at $96k.
RSI shows a bit more room to the downside as well.
Make sure to get those bids in!

$BTC Lost $100K Support – Retesting From Below Bitcoin broke CRYPTOCAP:BTC Lost $100K Support – Retesting From Below
Bitcoin broke the key $100K support and dropped to $98,200, but has now bounced slightly and is trading near $100,800. However, the situation remains bearish.
🔸 Key Support Zone at 99,763 – 103,112 (Broken & Retesting):
This zone is now being tested from below. If BTC fails to reclaim it, downside pressure continues.
🔸 Upside Target: 110,324 (Invalidated)
Only a strong move back above $103K can revive bullish momentum.
🔸 Risk Level at 100K:
If today’s daily candle closes below $100K, expect more downside — next major target is around $92,000.
🔸 Outlook:
BTC is in a bearish retest phase.
If $100K holds as resistance → expect further dump to $92K.
If reclaimed with strength → structure may stabilize.
Shorts still in profit — manage wisely.
Stay alert. Global tension keeps markets highly reactive. Keep risk tight and follow the trend.

[BTC] What if ...If we have to reach a new ATH soon, I want it to be after this kind of catalyser event, massive liquidations, huge levels sweeped and very pessimistic post on X about the end of the 4 years cycle.
So let's see what CRYPTOCAP:BTC can do next ...
Great Trade !

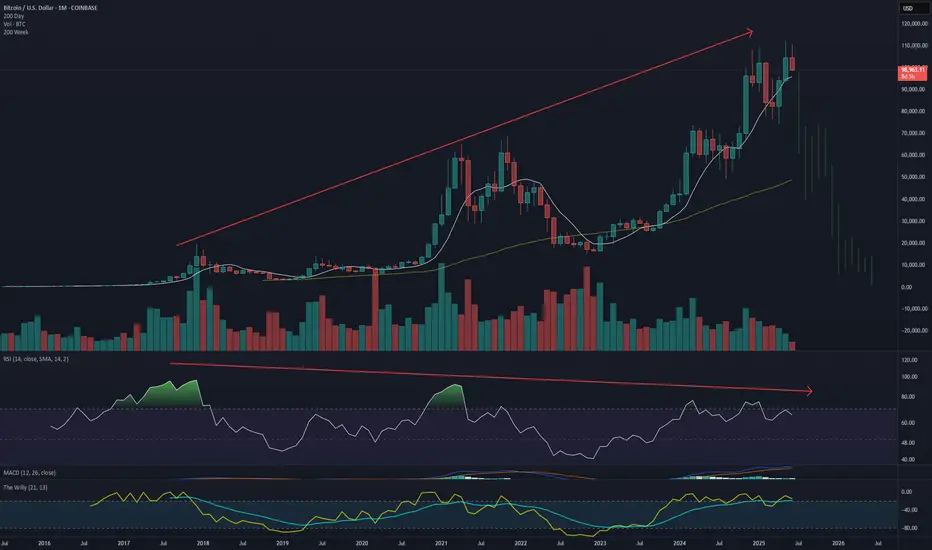
Bitcoin to under 1000 by mid 2026Three drives of bearish divergence, proof of diminishing returns cycle once again, proving that next cycles diminished returns will not even break new highs after the bear marker...if there even is a next cycle... which I doubt will occur since the only appeal of bitcoin is to get rich quick and once it loses that then its over.
Anyway, i would call for zero but i doubt that occurs right away, probably get some diehard delusional cultists buying down there stopping it from going right away, maybe bounces around a bit afterward but the destination ultimately is zero.
BTCBTC will be moving sideways and a drop for the next few days.
Disclosure: We are part of Trade Nation's Influencer program and receive a monthly fee for using their TradingView charts in our analysis.

BTC weekly sellon large timeframe BTC going to area between 70k and 6ok because we are now in correction period.

BITCOIN | Bullish DivergenceBITCOIN has been in bearish trend so far but it has now formed bullish divergence which may initiate a new bullish trend.

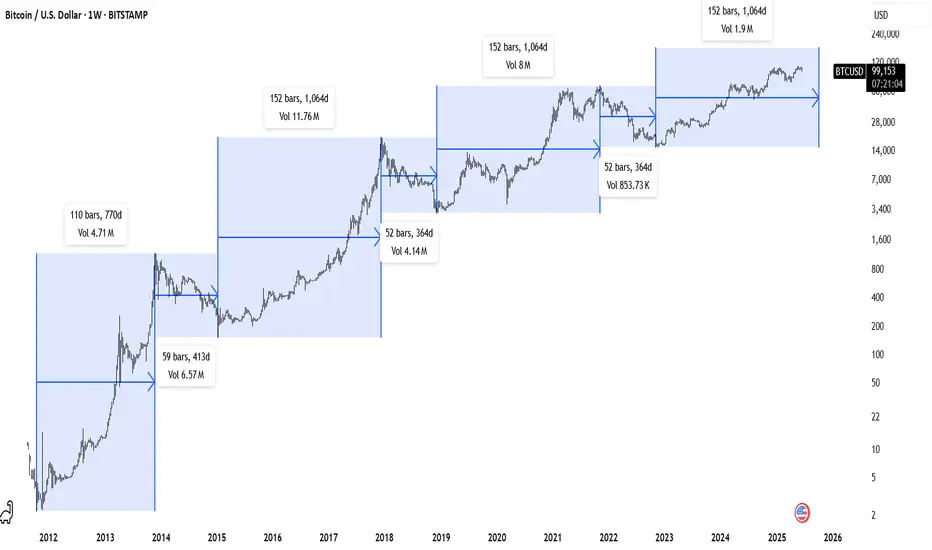
BTC Weekly - Time PatternsBitcoin Weekly Chart
52 Wk & 152 Wk Patterns // Diminishing returns
For my own personal logs.
BTC / USDT - Short Set-UpEvening friends,
Looks like a probable idea, since we're just printing a lower low.
I shorted it already, lets see it play out.
Trade thirsty, my friends!

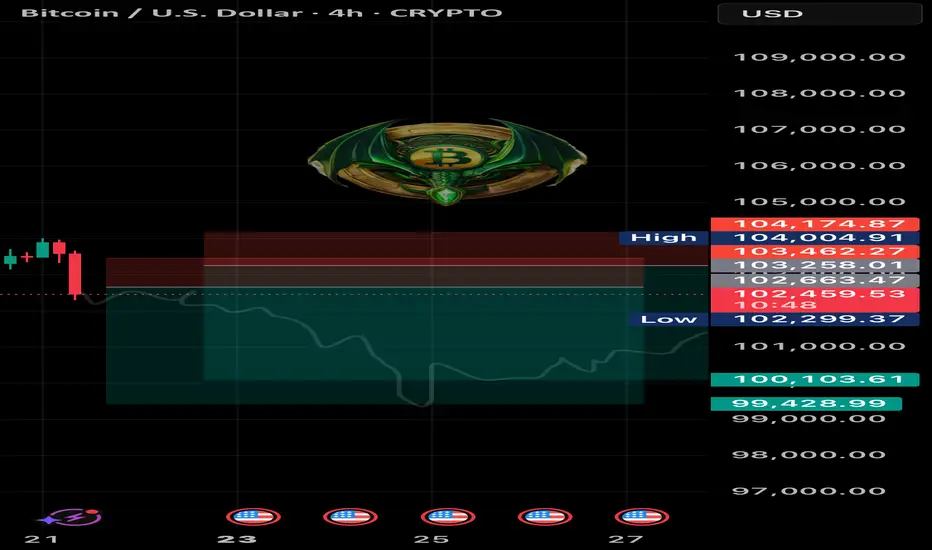
BTC SHORT TP:-100,000 21-06-2025What if this is the one that nukes it all? 😮💨
I’m entering a short between 102,500 and 103,600, aiming for a target around 99,500 – 100,200, with an average RR of 4.
This is based on the 4H timeframe, and should play out in the next 48 to 60 hours.
The structure still favors bearish continuation. If BTC breaks through the 100k level, we might be staring at a black swan scenario.
Manage your stop according to your risk plan and stay tuned for updates.
We don’t use indicators, we’re not out here drawing lines or cute little shapes — I just give you a clean trade.
If the move doesn’t happen within the estimated time, the trade is invalid.
#Btc Breakdown Begins: Double Top + Iran-Israel Tensions = CrBitcoin has clearly formed a double top pattern and is currently hanging near the critical 100K support. If this level breaks, we may first see a fall to 90K, followed by a deeper decline toward 73.5K. If that too fails to hold, the market could slide drastically to 64K–45K zones. The pattern indicates Bitcoin is exiting the distribution phase, with profit booking at aggressive levels.
The Iran-Israel conflict, intensified by U.S. involvement, has triggered panic and short positions across the market. This is a high-risk environment, and long entries could be dangerous right now. Caution is advised — we are entering a potentially sharp correction phase.

Wyckoff Structure Targets 92K–94K Retest Before Continuation!A rare and highly instructive market structure is currently unfolding, presenting a textbook case of Wyckoff pattern integration across multiple timeframes.
Over the past weeks, I’ve been tracking a series of smaller Wyckoff accumulation and distribution patterns nested within a larger overarching Wyckoff structure. Each of these smaller formations has now successfully completed its expected move — validating the precision of supply/demand mechanics and the theory’s predictive strength.
With these mini-cycles resolved, the spotlight now shifts to the final, dominant Wyckoff structure — a larger accumulation phase that encompasses the full breadth of recent market activity. According to the logic of Phase C transitioning into Phase D, price appears poised to revisit the key retest zone between 92,000 and 94,000, a critical area of prior resistance turned demand.
📉 Current Market Behavior:
📐 Multiple minor Wyckoff patterns (accumulations/distributions) have played out as expected, both upward and downward — lending high credibility to the current macro setup.
🧩 All formations are nested within a major accumulation structure, now in the final phase of testing support.
🔁 The expected move is a pullback toward the 92K–94K zone, before the markup phase resumes with higher conviction.
📊 Wyckoff Confidence Factors:
✅ All Phase C spring and upthrust actions respected
✅ Volume behavior aligns with Wyckoff principles (climactic action → absorption → trend continuation)
✅ Clean reaccumulation signs within current structure
✅ Institutional footprint visible through shakeouts and well-defined support/resistance rotations
💬 Observation / Call to Action:
This setup is a rare opportunity to witness multi-layered Wyckoff theory in motion, offering not only a high-probability trading setup but also an educational blueprint. I invite fellow traders and Wyckoff analysts to share their interpretations or challenge the current thesis.
➡️ Do you see the same structural roadmap?
Let’s discuss in the comments.

#202525 - priceactiontds - weekly update - bitcoinGood Day and I hope you are well.
comment: Full bear mode. Bulls still trying to make bears doubt it and we are not moving fast enough but we are also not making higher highs. We are close to my validation level for the bears, which is a daily close below 100k. I do think any print above 104k would invalidate my thesis. Targets for bears today/tomorrow are 98k and if we have enough momentum we see 90k.
We are still seeing bigger tails above daily bars which means bulls are trying but since are printing lower lows for two weeks, they are failing. Bears now need to move strongly below 100k and then we can start the acceleration down.
current market cycle: trading range until follow-through below 100k
key levels: 100k - 111k
bull case: Bulls are still hopeful, that’s why we are still above 110k but the next touch could break it and I doubt many will hold long or scale into new ones there. Best bulls can get right now is to go sideways for longer and stay above 100k. I mean… Staying above 100k is as bullish as it get’s if you be honest.
Invalidation is a daily close below 100k - next support below 100k is 98k and then comes 93k
bear case: Bears need to print below 100k and close below. That’s the whole story. Next targets below are then 98k and 93k, breakout-re-test prices. Until they achieve that, it’s slightly higher probability that we move sideways but this market won’t be able to hold above 100k if big indexes sell-off.
Invalidation is above 107k
short term: Bearish but could wait for confirmation below 100k. I doubt we get above 107k again and continue inside the range
medium-long term - Update from 2025-06-22: Daily close below 100k is confirmation. First target below 100k is 97k the breakout retest and after that is the 50% retracement around 93k. I have no bullish for the next weeks/months. Once the gap to 97k closes we are likely in a bear trend again and I expect to hit at least 85k over the summer.

Break-Out Bros vs. Range Followers – will BTC rip?Bitcoin just kissed the channel roof at 109–110 k. Same line has stuffed every rally since April, so 112 k on a daily close is the whole story: print it and we leave the dungeon.
Under the hood the bulls finally have ammo – price back above the 50-day, bands squeezed, volume upticking, RSI mid-50s. Enough spark to torch shorts if resistance snaps.
Range Followers aren’t sweating. Their cash machine is simple: dump 110 k, scoop 100 k. Holiday liquidity = fake-out heaven. Slip under 105 k and gravity drags us straight to that comfy demand couch.
So it’s binary: close over 112 k, momentum fires toward 118 k; fail, and we ping-pong in the box again. Pick a side, slap on a stop, and remember: Bitcoin’s favourite sport is humiliating whichever crowd screams loudest.


Bitcoin can rebound from resistance level and start to declineHello traders, I want share with you my opinion about Bitcoin. Recently, the price broke above a local resistance and quickly approached the key resistance level at 110000, which also aligns with the upper boundary of the seller zone (110000 - 110700 points). This area has already proven its strength multiple times, causing sharp rejections in the past. Moreover, the price has tested it again recently and failed to break through. In addition, we can see a triangle structure, which fits the logic of a pennant pattern after a bullish wave. However, the latest move upward has already lost momentum near the apex, and the price is now trading just under the upper edge of this formation. That makes this zone technically overloaded and vulnerable to a downside reversal. Based on this, I expect Bitcoin to test the resistance level one more time and then roll back down toward TP 1 at 106000 points, a zone near previous liquidity accumulation and a local consolidation range. If selling pressure increases, the price might aim for the buyer zone (103800 - 103100). Given the current rejection at resistance, the structure of the triangle, and the reaction inside the seller zone, I remain bearish and expect further decline toward the support. Please share this idea with your friends and click Boost 🚀
Disclaimer: As part of ThinkMarkets’ Influencer Program, I am sponsored to share and publish their charts in my analysis.


BTC setup with a 3.9 risk-to-reward ratio.Is BTC beginning a bullish move toward 120K?
This setup offers a 3.9 R:R with an
Entry at 109,000
Stop loss at 106,355
Target 120,000
Not financial advice.

80k BTC On The Move - WHAT It Means 80,000 BTC Wallet Movement (2011 Miner)
• Source: 8 wallets containing 10,000 BTC each — mined in 2011, dormant for 14 years
• Total Value: Over $8.6 billion USD
• Timing: Moved on July 4, 2025 — largest dormant BTC transfer in history
• New Addresses: Funds moved to modern SegWit wallets
• Probable Owner: Likely a single early miner with 200k+ BTC history
Possible Reasons for the Move
• Key Rotation: Upgrading to modern wallets for better security
• Recovered Access: Private keys may have been recently recovered
• Market Strategy: Positioning for profit-taking or major sell-off
• Yield Farming: Preparing COINBASE:BTCUSD for use in DeFi/lending platforms
• Collateral Use: Possibly for loans, stablecoin leverage, or RWAs
• Estate Planning: Legal restructuring or generational wealth setup
• OTC Transfer: Could be prepping for off-exchange institutional sale
• Psychological Warfare: Could be intended to spook or manipulate the market
• Regulatory Response: Aligning with new compliance or tax jurisdiction
Market Reaction
• COINBASE:BTCUSD Price Dip: Price briefly fell below $108,000 post-move
• ETF Context: Movement occurred despite record ETF inflows
Key Note: These wallets had not been touched since COINBASE:BTCUSD was worth ~$0.78. Their reactivation adds uncertainty and opportunity in a fragile macro environment.
• What to do????: Watch the orderbook to find these large bitcoin moves in case of exchange selling
Near term support & resistance
$106000 support
$109500 first resistance
👍 If this breakdown helped your trading, smash that Like and drop a comment below—let me know what you think will happen with the 80k COINBASE:BTCUSD . 👍
Best Reguards
MartyBoots, 17-year market trader
