BTCUSD What Next? BUY!
My dear subscribers,
My technical analysis for BTCUSD is below:
The price is coiling around a solid key level - 10750
Bias - Bullish
Technical Indicators: Pivot Points Low anticipates a potential price reversal.
Super trend shows a clear buy, giving a perfect indicators' convergence.
Goal - 10825
About Used Indicators:
By the very nature of the supertrend indicator, it offers firm support and resistance levels for traders to enter and exit trades. Additionally, it also provides signals for setting stop losses
Disclosure: I am part of Trade Nation's Influencer program and receive a monthly fee for using their TradingView charts in my analysis.
———————————
WISH YOU ALL LUCK
BTCUSD.PM trade ideas
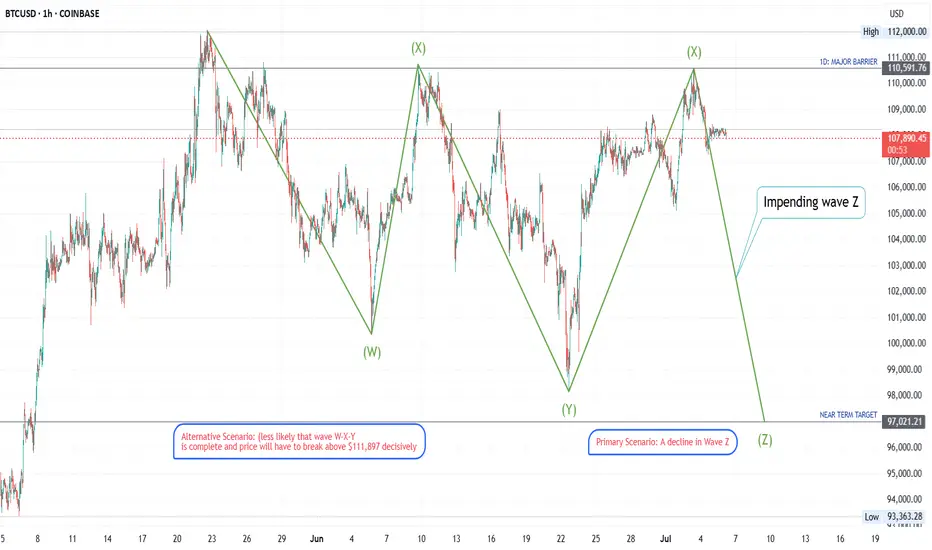
Wave Pattern: Complex Correction (Triple Three) on BITCOINThe price action on this BTC chart displays the characteristics of an overlapping, sideways, and downward-drifting nature of the price swings strongly indicates a complex corrective pattern. The most fitting pattern is a Triple Three, denoted as W-X-Y-X-Z. This is an extended consolidation pattern composed of three simpler corrections (W, Y, and Z) linked by two intervening waves (X).
Most Probable Next Moves
Based on the identification of the market being at the end of a second Wave X, the following are the most probable scenarios:
Primary Scenario: A Decline in Wave Z
The highest probability path is a decline in Wave Z.
Immediate Move: The price is expected to turn down from the current resistance area (the peak of the second Wave X, roughly $110,600).
Structure of the Move: Wave Z will itself be a corrective pattern, most likely another zig-zag (structured as A-B-C down).
Price Target: A common characteristic of a Triple Three is that Wave Z will often push to a new low for the entire structure. The chart's pre-marked "NEAR TERM TARGET" at $97,021 is a logical objective. This would involve breaking below the previous Wave Y low of $98,225.
Alternative Scenario (Less Likely)
A less probable scenario is that the entire W-X-Y correction completed at the June 23rd low. In this case, the rally since then would be the beginning of a new impulsive uptrend (Wave 1). This is considered less likely because the rally from late June to early July appears corrective and lacks the powerful, non-overlapping structure typical of a new impulse wave. For this scenario to gain credibility, the price would need to decisively break above the major barrier at $111,897.
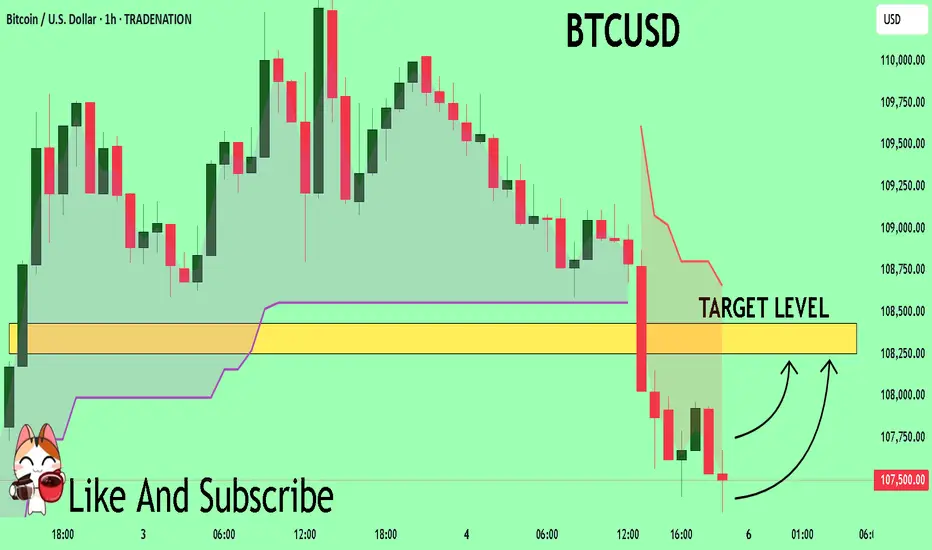
Bitcoin May See Short-Term Pullback After Hitting $108,000📊 Market Overview:
Bitcoin surged to $108,000 amid renewed risk-on sentiment, a softer US dollar, and slightly declining bond yields. However, weekend trading sees lower liquidity, and some profit-taking has emerged. Traders are also cautious ahead of next week’s Fed-related news.
📉 Technical Analysis:
• Key Resistance: $108,500 – $110,000
• Nearest Support: $106,200 – $105,500
• EMA 09 (1H): Price is above EMA 09, indicating bullish momentum remains.
• Candlesticks & Volume: Doji candle and falling volume in 1H → suggests weakening upside momentum and possible retracement.
📌 Outlook:
Bitcoin may face a short-term pullback if it fails to break above $108,500 and no fresh catalysts emerge. Holding above $106,200 would keep the broader bullish structure intact.
💡 Suggested Trade Setup:
🔻 SELL BTC/USD at: 108,200 – 108,500
🎯 TP: 106,800
❌ SL: 109,300
🔺 BUY BTC/USD at: 106,200 – 105,500
🎯 TP: 107,800
❌ SL: 104,800

BTCUSD: Target Is Up! Long!
My dear friends,
Today we will analyse BTCUSD together☺️
The market is at an inflection zone and price has now reached an area around 108,067 where previous reversals or breakouts have occurred.And a price reaction that we are seeing on multiple timeframes here could signal the next move up so we can enter on confirmation, and target the next key level of 108,140. Stop-loss is recommended beyond the inflection zone.
❤️Sending you lots of Love and Hugs❤️

109159This channel is not providing individualized trading or investment advice, nor is it a banking service, brokerage service, trading service, investment service or money management service

BTC Down then Bounce from 92kIt's going go to down, hit this 50% fib which is also some historical S/R level, then bounce from there.

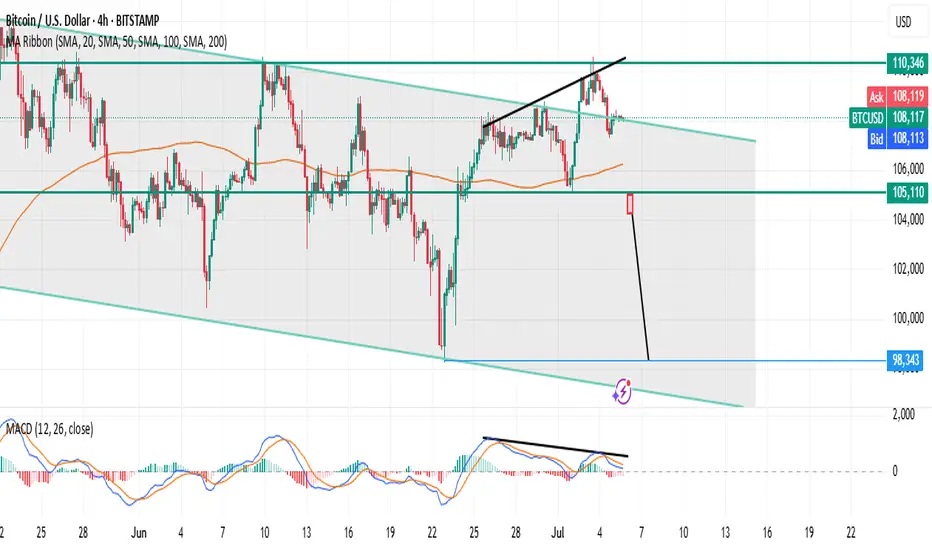
BTC/USD (4H): Classic FRL short setup unfoldingTrading = capital management under uncertainty.
Bitcoin is trading inside a clear descending channel on H4.
Price recently tested the upper boundary of this channel while forming a bearish divergence on MACD. This divergence hints at a weakening upward phase, signaling a possible phase shift according to Fractal Reversal Law (FRL).
Why is this a classic FRL setup?
✅ Phase Identification:
The prior local upward phase within the descending channel is weakening.
✅ Reversal Pattern:
A double top / wedge has formed at the upper boundary with a bearish divergence.
✅ Neckline:
The neckline aligns with the MA100 cluster on H4, now acting as a horizontal rubicon.
✅ Confirmation:
We wait for a full candle close below the neckline on H4 to confirm the phase shift.
✅ Targets:
– TP1: Mid-channel grey zone.
– TP2: Lower boundary of the channel.
✅ Stop:
Above the recent highs or channel top, depending on your risk management.
Plan:
Wait for H4 close below neckline → enter short.
Use the channel structure for target planning.
Manage risk with a tight, structure-based stop.
This is a clean FRL textbook scenario:
Phase → Pattern → Neckline → Confirmation → Target.
It aligns with the larger market structure, using the combination of price action, divergence, and structure clarity to guide your trade decisions.
Triple Bearish DivergenceWe have bearish divergence on the MACD(Chris Moody) and the CCI and the RSI. Also the MACD looks like it can make a bearish cross over in the future. BTC is near all time high and volume is drying up and this week candle is forming a hanging man(week is not over yet). If the Bulls can keep price above the 10 EMA 103,333.98(purple curve) they have a fighting chance but the bears are patiently waiting.

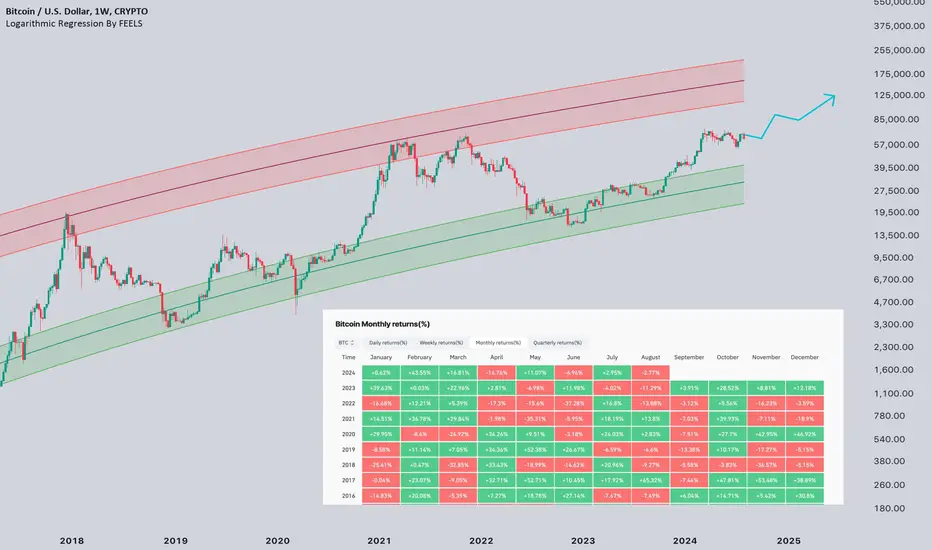
Why Bearish?Why are we falling and why do I think there will be no deep correction?
🗣The first is, of course, geopolitics, risks are growing again in the Middle East,
🗣The second is additional liquidity from the US government and mt GOX.
🗣A crisis of narratives, nothing very positive will happen in the next 2 months, and the seasonality in those months also does not give anything positive.
🗣Fears that key rates will be lowered will bring negativity to the market, as has been the case historically.
Why these are not big problems?
💡Geopolitics. I don't want to delve into possible options, but in the basic version, I expect a repetition of the option as it was in April, after which the situation cooled down.
💡The market will absorb the liquidity here and as in the past, as we saw in the story with the sales of the German government.
💡I think there will be narratives, and seasonality does not show us a deep correction, only consolidation.
💡I consider that the negative will be only in snp500 and then very short-term. In general, lowering rates is positive, both for business and for risky assets such as cryptocurrencies.
P.S. In the table of seasonality, I left only the necessary months, taking away bear years and too early years.
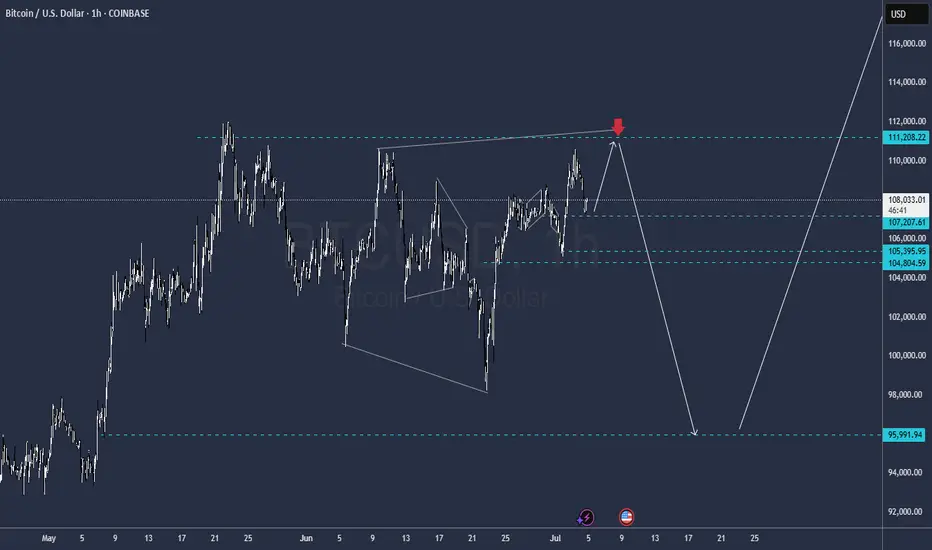
Upward to 111k+ 4h chartThis is a 3 wave corrective move NOT a bullish move. Looking at 111-112k then epic down side. Running flat may keep the target above 74k

Current Pivot Points on the BtcUsd Pair📈 Classic Pivot Points (Daily Timeframe)
Using yesterday’s data:
High = $109,723.7 (Jul 3)
Low = $108,544.8
Close = $108,590.5
investopedia.com
+15
marketmilk.babypips.com
+15
dailyforex.com
+15
investing.com
+1
coinlore.com
+1
Compute:
Pivot Point (PP) = (109723.7 + 108544.8 + 108590.5) / 3 ≈ $108,953.0
Resistance 1 (R1) = (2 × PP) – Low ≈ $109,361.2
Support 1 (S1) = (2 × PP) – High ≈ $108,182.3
Resistance 2 (R2) = PP + (High – Low) ≈ $109,912.0
Support 2 (S2) = PP – (High – Low) ≈ $108,023.0
These central and level lines offer key zones where price might reverse, pause, or breakout.

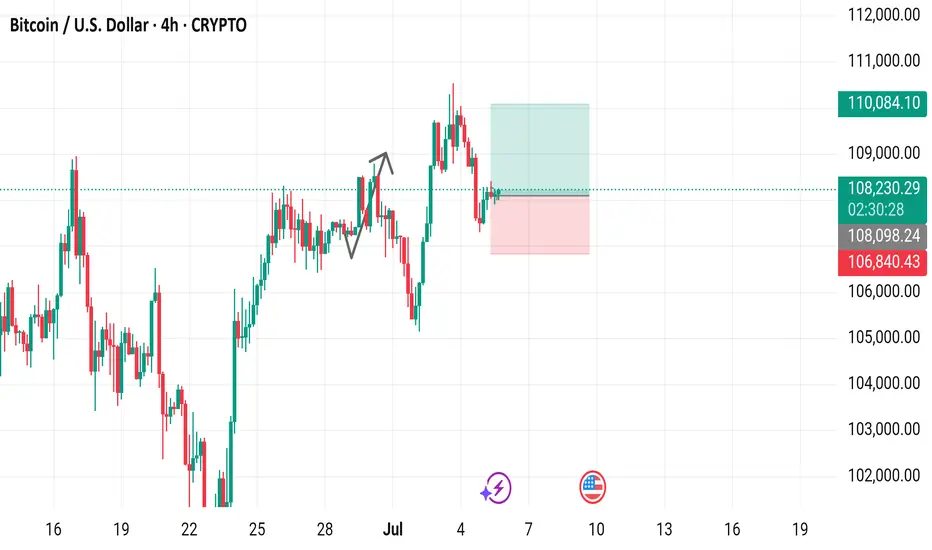
Bitcoin / U.S. Dollar 4-Hour Chart - CRYPTO4-hour candlestick chart displays the Bitcoin (BTC) to U.S. Dollar (USD) price movement, currently at $108,252.17 with a 0.21% increase (+$230.82). The chart highlights a recent upward trend with key price levels marked, including a buy price of $108,252.17 and a sell price at the same level. Support and resistance zones are indicated with a pink shaded area around $106,840.43 to $108,252.17 and a green shaded area near $110,084.10. The chart spans from late June to July 7, 2025, with the latest data point at 06:27 PM PKT on July 5, 2025.
Magic awaits for Bitcoin!The breakout from this pattern will likely come within weeks.
I think Q3-Q4 Bitcoin will absolutely blow our minds.
US institutions have been accumulating Bitcoin for almost a year.
They don't buy tops.

40 Year Rough EstimateThis chart looks silly, I know. Turn on log to see it a bit better. It sounds absurd, but so does just about any market.
The only thing I can see stopping this is a return to the gold standard. As long as money can be printed for free, it will. Bitcoin can't.
I suspect we'll start seeing the qSAT (quadrillionSAT) shorthand or something, because you can always add more zeroes.

BTCUSDT - single support, short below.#BTCUSDT.. .market placed a very reasonable low tha tia around 107200
Keep close it and short below that only.
Good luck
Trade wisely

BTC CORRECTION MAY NOT BE OVER YET Dear Traders,
Whilst I believe that BTC is still generally bullish, I also think it is important for traders to always pay attention to what price is doing and not what we think price is going to do, and this is simply what we mean by price action in simple terms.
As we can see, the bullish momentum is generally slowing down and we have seen three attempts made by price to swing above the previous high of $112,000 that kept failing. We have also seen two Lower Lows (LLs) on the daily and a Lower High (LH) followed by a Double Top, which is currently seeing price pulling back and can be seen better in lower timeframes which may also be forming and giving us some bearish patterns. This is enough signal and warning for buyers to pay detailed attention to what is going on and look for high probability buy trade set up rather than emotional trading or placing random entries.
I think there are 2 possible good options for buyers, the first is a buy-stop set up above the previous high of $112,000 up to the next psychological levels at $115,000 and $120,000.
The next option would be to buy from the middle of the yet to be mitigated FVG below current price level but we must take cognizance of the order flow below it as price may also tap into it before going up.
Sellers may consider a sell stop to the FVG or wait for confirmation, which is a bodily close below the immediate unmitigated Bullish OB.
The summary of my idea is that, BTC may make another Lower High (LH) and Lower Low (LL) before the next Bullish Run but we just need to pay attention to what price is doing and not get carried away with our emotions.
I remain neutral for now

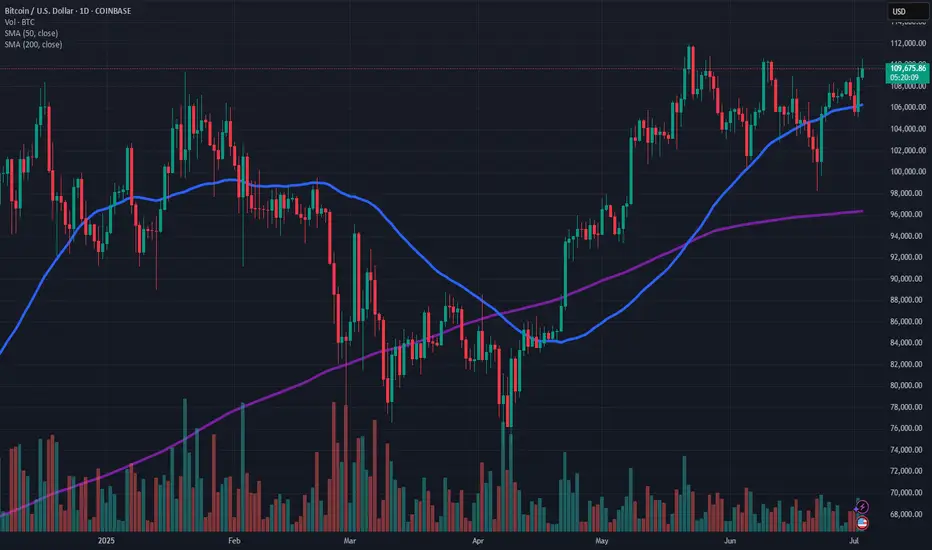
Are we still in an oscillator?Been over a month in this channel now. Now clear signs of breaking up or down. We are likely headed back to the 30 day SMA, and from there who knows. I tend to like the upside here being above the SMA, but we all know it can crack down and retest the lows yet again. I'm saying we retest the highs first.

Bitcoin UPDATEThe sell is @ 111.200
I think it still has to make a new high, sell is not ready just yet
levels highlighted
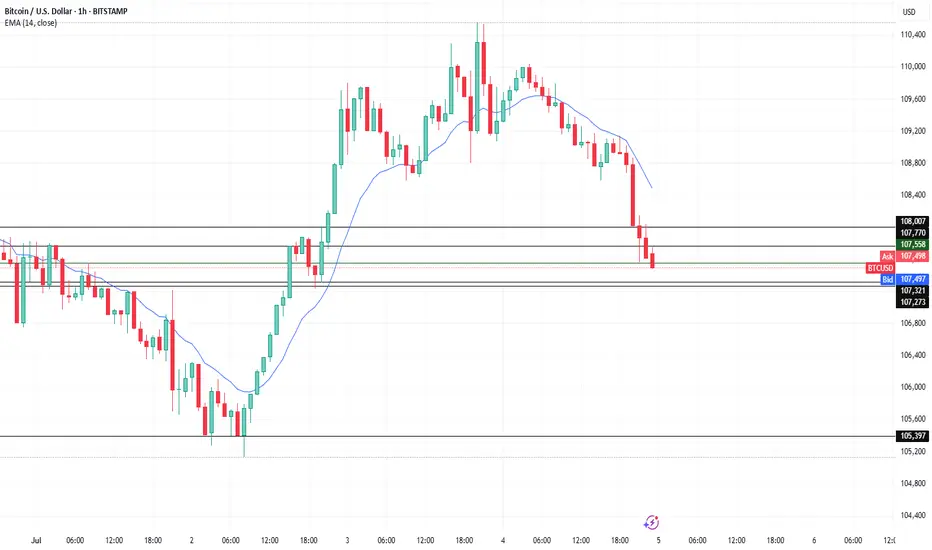
BTC/USD – Intraday Rebound Before Possible Breakdown PairTimeframe: 1H
Exchange: Bitstamp
Bias: Bearish
Posted by: Indonesia1945
Bitcoin is currently holding above the 107,273 support zone after a sharp intraday sell-off. The price has failed to break this key level decisively, which opens the possibility of a short-term rebound before further downside continuation.
Technical Zone Identification:
Immediate Support: 107,273
Resistance to Watch: 107,770 (former support turned resistance)
Major Downside Target: 105,400
Indicator Support:
Price trades below EMA 14, indicating ongoing bearish pressure.
No bullish divergence on RSI, suggesting that any rebound may be corrective rather than trend-reversing.
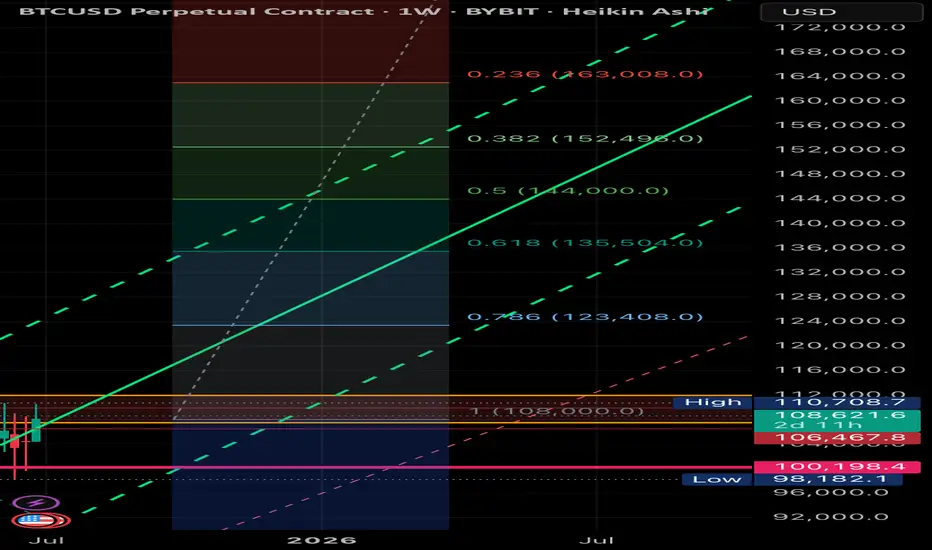
BTCUSD Halving Pic Cycle next top at 140 000 in next 3 MonthsFirst Halving (Nov 28, 2012)
- Price at halving: ~$12.
- Peak price: ~$1,150 (Nov 29, 2013, ~366 days later). Multiple: $1,150 / $12 ≈ 95.83x
- Bottom after peak, before second halving (Jul 9, 2016): ~$185 (Jan 14, 2015, ~413 days after peak).Drop from peak: $1,150 to $185 = -83.9%.
Price relative to halving: $185 / $12 ≈ 15.42x the halving price.
Second Halving (Jul 9, 2016):
- Price at halving: ~$651.
- Peak price: ~$19,700 (Dec 17, 2017, ~526 days later). Multiple: $19,700 / $650 ≈ 30.31x.
- Bottom after peak, before third halving (May 11, 2020): ~$3,122 (Dec 7, 2018, ~355 days after peak).Drop from peak: $19,700 to $3,122 = -84.2%. Price relative to halving: $3,122 / $650 ≈ 4.80x the halving price.
Third Halving (May 11, 2020):
- Price at halving: ~$8,800.
- Peak price: ~$67,549 (Nov 8, 2021, ~546 days later). Multiple: $67,549 / $8,750 ≈ 7.72x.
- Bottom after peak, before fourth halving (Apr 19, 2024): ~$15,479 (Nov 21, 2022, ~378 days after peak). Drop from peak: $67,549 to $15,479 = -77.1%. Price relative to halving: $15,479 / $8,750 ≈ 1.77x the halving price.
Fourth halving (Apr 19, 2024):
- Price $65,000.
- Dipped to $49,577 on May 7, 2024 (18 days post-halving. Estimated multiple: ~2.21x (based on trend analysis).
- Projected peak price August-November 2025: $64,000 × 2.21 ≈ $140,000.
- Drop from peak: $30 000 August–September 2026
at 80% drop from peak and 0.5x of last Halving price
Price Fifth Halving April 2028 $123456

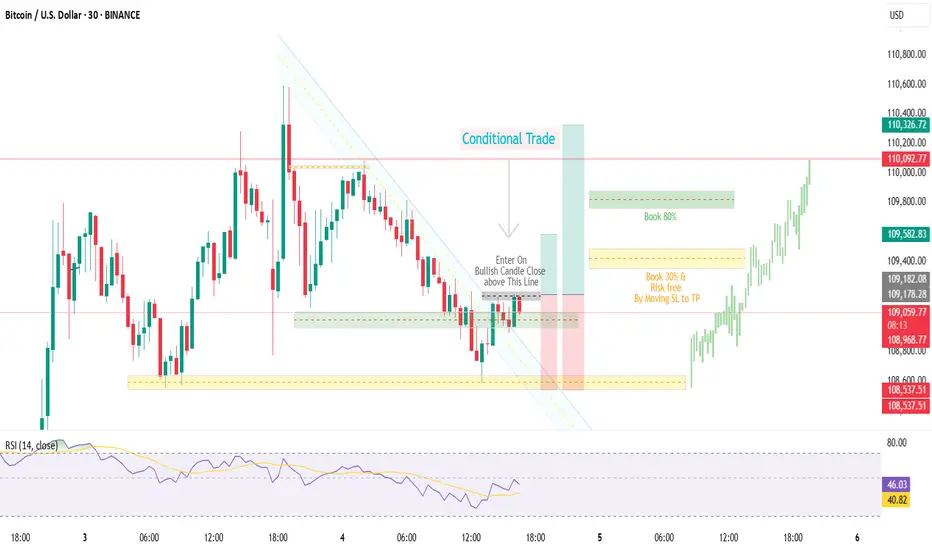
BTCUSD BTCUSD | Quiet Market Play Conditional | Trade Based On Candle Closure
After a sharp impulsive move, price is now in consolidation.
Currently entering a long position after support And trenline confirmation
Trade includes full risk management, marked on chart.🟢📈