Market Manipulators Work Together to Exploit Hope | BM Is Over Iran–Israel Tensions Rising Again | A Hidden Gem for Traders
The conflict between Iran and Israel is heating up once again, and things are far from settled. Behind the scenes, there are signs that Iran may restart its nuclear weapons program, which could trigger a serious reaction — not just from Israel, but also from Western countries and nearby Arab nations.
If this conflict turns into a wider war, we could see major global impacts, including:
Rising oil prices due to tensions in the Middle East
Increased defense spending and movement in military-related stocks
Volatility in gold, USD, and crypto markets as investors seek safety
📉 While the world is watching quietly, this is actually a hidden signal for smart traders. The media might not be talking loudly about it yet, but war risk is building — and when it explodes into headlines, markets could react fast and hard.
🧠 Smart Traders Know:
Geopolitical tension = market moves
Fear fuels gold, oil, and crypto spikes
Nuclear headlines could shift investor psychology overnight
BTCUSD.PM trade ideas

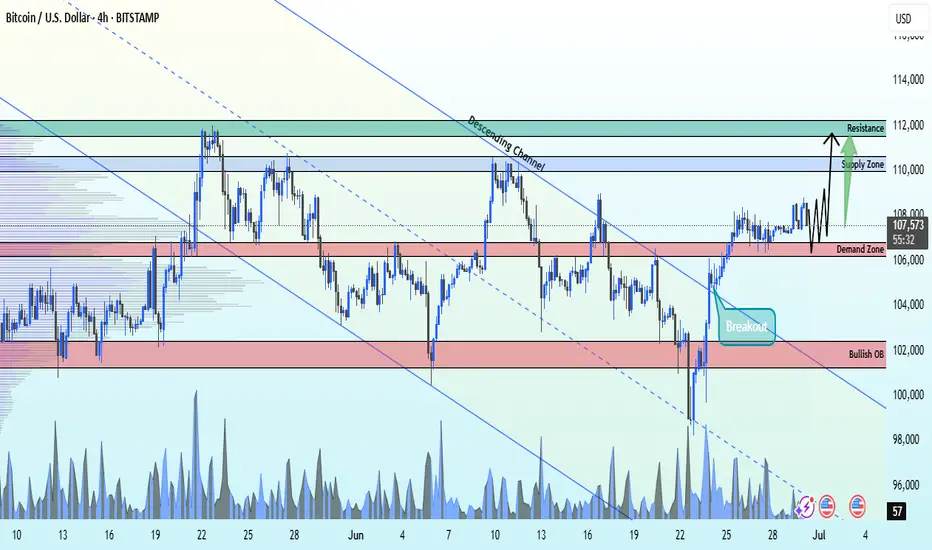
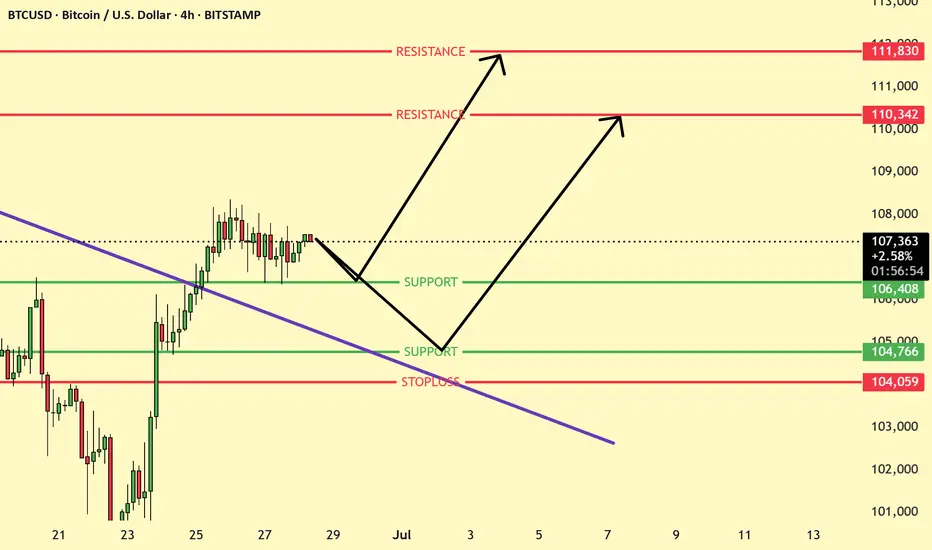
BITCOIN Breakout From Ascending Channel bullish from demand ZoneBTCUSD Breakout Alert
Bitcoin has officially broken out of the descending channel on the 4H timeframe, signaling a potential bullish reversal from the key demand zone at 106,100.
🎯 Technical Targets:
1st Target: 110,000 – Major supply zone
2nd Target: 112,000 – Strong resistance level
🔒 Stop Loss: 103,000 – Below bullish order block for risk protection
This setup offers a clean R:R with strong confluence. Watch for continuation above 108K for confirmation.
📊 TA only – always manage your risk!
🔥 Like, follow, & comment to stay ahead with more real-time updates!
#BTC #CryptoTrading #PriceAction #BitcoinAnalysis #LiviaTrades 😜
BTCUSD📉 The Setup: Bearish Divergence on BTCUSD (1H/15m/30m)
🔍 Observation:
On the 1 Hour chart, Bitcoin
🧠 Meaning: The Buying pressure is weakening, and a breakdown might be near!
Entry SL TP shared in chart

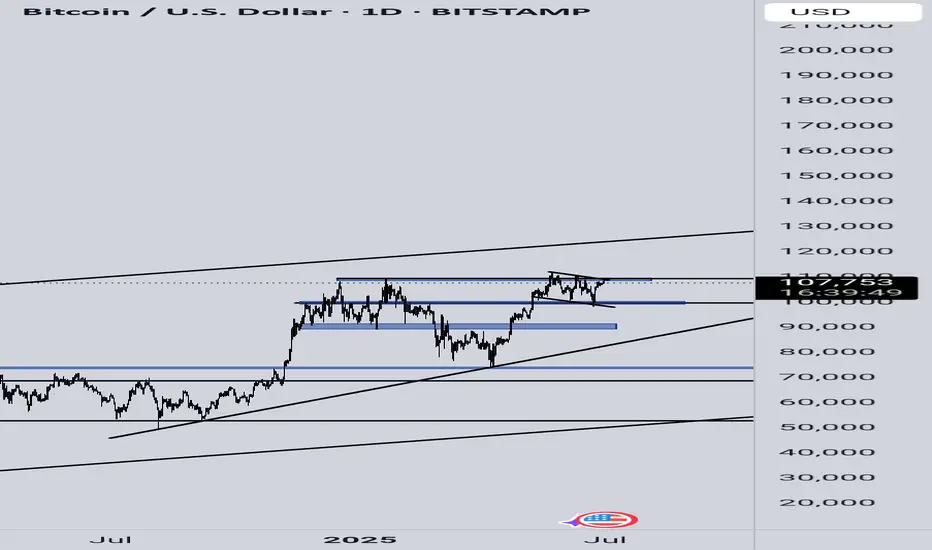
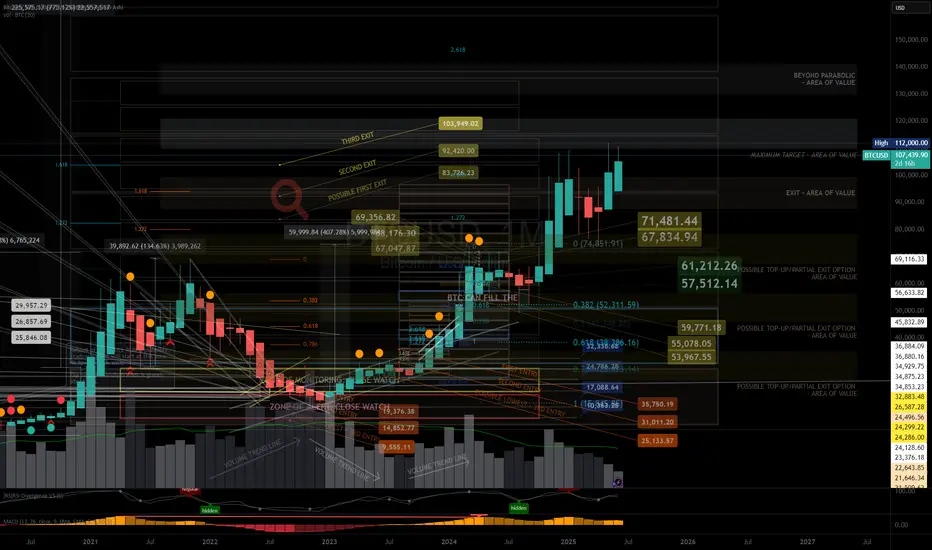
BTCUSD-Breakout Loading – Massive Opportunity Ahead!BTC is consolidating within a major structure for 224+ days. Current price action is forming a bull flag, signaling strong potential for a breakout toward $120,000–$150,000. Short-term volatility expected, but long-term trend remains bullish.
🔸 Support at $90,000–$93,000:
Strong confluence in this region including CME gap, liquidity pools, and previous structure support. Rejection from $113K could trigger a flush into this zone. Long setups should be considered here. Whales are accumulating.
🔸 Upside Target: $120,000 – $150,000
Long-term breakout from consolidation range aligning with historical accumulation patterns and macro indicators like M2 lag. Break of $113K with strength opens doors to $120K+. Clean structure with confirmed support will fuel rally continuation.
🔸 Risk Level at $88,000:
If BTC breaks below $88K with volume and closes under structure, it would invalidate the bull flag scenario short-term and signal deeper correction.
🔸 Outlook:
Monitor price reaction near $113K. Prepare for fakeout and potential sweep into $90K–$93K zone. Place laddered long orders in that range for optimal R:R. If dip occurs, treat it as a gift entry. No bearish outlook unless macro conditions shift drastically. Momentum remains upward.

Traders Gurus always wrong at the crucial pointWhy are trading gurus often wrong at market tops or bottoms?
I recently received an email from the B*itcoin L… channel (where people like P.L. Brandt, Loukas, etc. are members), and it said the following:
The next installment of the 4-Year Cycle.
Exploring the powerful bullish case for Bitcoin, driven by a perfect storm of narratives: institutional adoption, regulatory clarity, and cycle timing. From ETF inflows and corporate treasuries to a pro-crypto U.S. administration, potential interest rate cuts, and surging legitimacy post-halving — signs point to a possible super cycle unfolding.
But honestly, if you know how to read a BTC chart, where exactly do you see a “powerful bullish case for Bitcoin”? Tons of indicators suggest the opposite — even BTC Dominance (BTC.D) doesn’t confirm it.
Wasn’t the move from $16K to $110K already the bullish case?
Based on what I’m seeing in the charts, BTC is likely to cool off for a year, maybe even two. I expect it to come down to at least $50K–$65K before making any significant move upward again. We haven’t even had a proper flash crash yet, which is surprising given everything that’s been going on in the world over the past few months. Something fishy is going on.

BITCOIN NEXTKind of a Messy coorective Structure, this is What I can see right now with the movemments it has done
YIf you lower the time frame you should see the complete map also levels are Highlighted
It should go as follows
Buy from now @ 107.600 to 108.500
Sell from @ 108.500 to 105.000
buy from @ 105.000 to 111.000
Sell from @ 111.000 to 96.000
Buy from @ 96.000/ 94.000 to 120.000 and 130.000
GG
here is the #chart #btc $bitcoin
Cautiously bullish. Bitcoin is trading at $107,983.70, up 6% from last week but 3% below its all-time high of $111,891.30 (May 22, 2025). Technicals show a strong buy signal with the 50-day and 200-day moving averages supporting an upward trend. Posts on X suggest a weekly close above resistance ($108k) could push BTC to new highs ($112k-$120k). However, bearish divergence on weekly charts and tariff-related volatility introduce risks. Pro-crypto policies and Fed rate cut expectations bolster optimism, but a potential pullback to $100,400 support looms if momentum fades.

BITCOIN/USD "Eyes $112K target!"Key facts today! 1). Bitcoin is trading over $107,000, with analysts eyeing a potential all-time high above $112,000. Bulls are holding prices above $105,000 amid easing inflation and institutional buying.
2). Investor Dan Tapiero predicts Bitcoin could hit $180,000, highlighting the need to break the $115,000 resistance level for strong upward momentum.

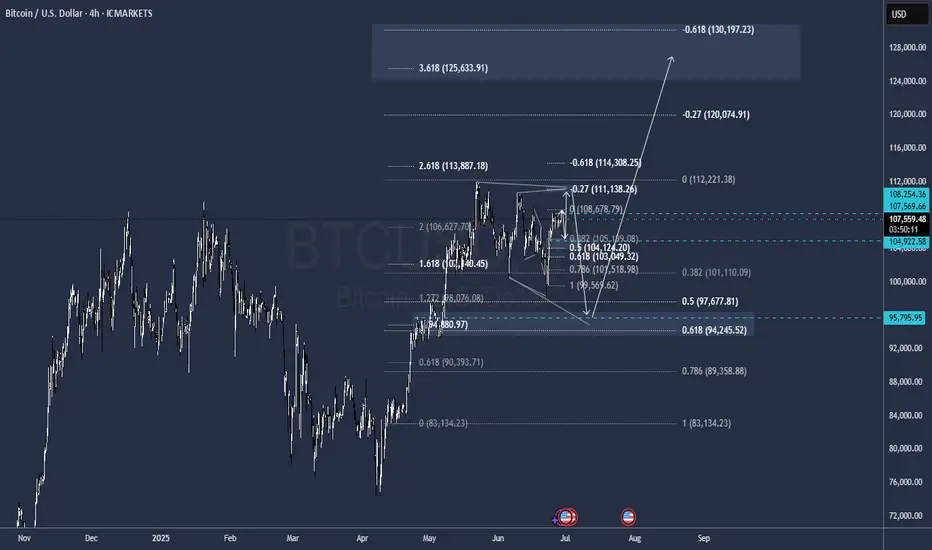
My Fav BTC Scenario Deep CrabThis is my favorite BTC htf scenario. Deep crab to 120kish with likely deviation above, potentially cycle ending.
If BTC rejects at that .786 then we have a butterfly to 115k

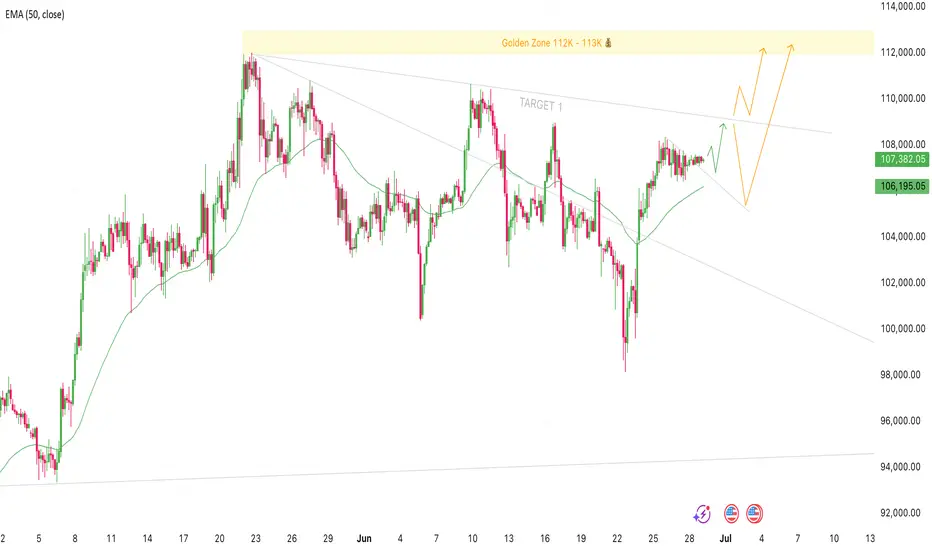
Bitcoin Setup for 109K and New Highs Could Be NextTrade Idea:
Direction: long
Entry: Now 107,350 - 106,800
Stop Loss: 102,000
Target 1: 109,000
Golden Zone: 112,000 - 113,000
Bitcoin has been consolidating for the last four days with no real price increase, but we’ve still managed to break above the short-term descending trend line. This could signal a continuation of the current swing up to the next resistance around 109K, which lines up with the daily trend line.
My bias here is that once we hit that 109K area, we could either see a pullback to around 104 to 106K before pushing higher, or we might break straight through, retest the trendline, and continue quickly to new highs above 112K.
I’ll be watching closely to see how price reacts around 109K, whether it rejects or breaks through. Either way the structure remains bullish, and if we get a rejection I'll be looking to re-enter.
Let's see how this plays out ✌️
BTCUSD Trade Setup - 28/Jun/2025Hi Traders,
I expect this pair to go Down after finishing the correction.
1) Need to wait for market to show changing of the direction.
2) The first reaction zone foe me will be at 95000 level followed by 89000 level.
3) Need to observe the characteristic of the move coming down in order to understand if market is planning to go up without coming to those levels.
Current expectation for investing is to see market dropping to 89000 level and then start to look for entry.
I only invest in BTC so no shorts for me but market shows potential to give a reversal soon and give a decent down move.

BTC Dominance and the “Double Top” Pattern🧠 BTC Dominance and the “Double Top” Pattern
1. What is a “Double Top” in BTC Dominance?
A Double Top is a bearish chart pattern formed by two peaks near the same resistance level. If the price (or dominance in this case) breaks below the neckline (middle support), it signals a potential trend reversal from bullish to bearish.
⸻
2. Is BTC Dominance forming a Double Top?
• Analysts suggest BTC dominance may be forming a double top, with two highs near the same level.
• However, it hasn’t confirmed yet. A breakdown below the neckline would confirm the reversal.
• If confirmed, this suggests that capital may start flowing from Bitcoin into altcoins.
⸻
3. What Does It Mean?
• If the Double Top is confirmed (dominance drops) → Bitcoin loses market share → capital flows to altcoins → possible start of a new Altseason.
• If dominance holds or increases → Bitcoin remains the market’s safe haven → altcoins may remain weak.
⸻
4. Current Context & Outlook
• BTC Dominance is now near 64%, a multi-year high, largely driven by institutional interest and Bitcoin ETFs.
• Historically, such highs are followed by rotations into altcoins, especially when traders seek higher returns.
• A confirmed drop in dominance might trigger runs in altcoins like ETH, SOL, or meme coins.

Playoff between down trend channel and up trend support in BTCThis is the situation Bitcoin finds itself in. On the one hand there is a strong downtrend channel which we keep getting thrown into, but on the other hand there is uptrend support that we also keep being bounced back into. We're currently in the confluence of both of these features, so shits about to get real.

Prediction for BitcoinThis is how I envision bitcoin moving based on current market events and the geopolitical situation.

BTC 120k is on about to come.- BTC retest 0.3 fib and 13 ema W with perfection.
- Stoch W is about to cross.
- MACD W is about to push upward.
- No war fud.
- Big players keep buying BTC.
- Rate cut still on the table, just a matter of time.
- Tariff soon will be settled.
Possible august 120k ?


Bitcoin(BTC/USD) Daily Chart Analysis For Week of June 27, 2025Technical Analysis and Outlook:
Throughout this week’s trading session, Bitcoin has demonstrated an upward trajectory and is positioned to achieve the specified targets of Mean Resistance 110300 and Key Resistance 111700. This progression may ultimately culminate in the realization of the Outer Coin Rally 114500 and beyond. Nevertheless, it is crucial to recognize the possibility of a subsequent decline from the current price to the Mean Support level of 104900 before a definitive upward rebound.

BTCUSD Set up Ready for LongBTCUSD is consolidating around 107,372 after a breakout. Two bullish scenarios are shown: a bounce from 106,408 or a deeper pullback to 104,766 before rallying. Key resistances lie at 110,342 and 111,830. Bullish bias holds as long as price stays above 104,059.
BTC Bento Box Analysis 6.28.25So far so good, I am back after 2 years of hibernation (been studying forex charts.) My analysis remains true to what BTC has done for the past 2 years. So much to learn in analyzing charts from crypto to forex to blue chips.
Again, we follow the tops and bottoms of the boxes. Minor and major boxes will suggest major and minor high and low reversals.
In a couple of weeks, i will study the charts and draw new Bento boxes for a year or two predictions as to where the most probable BTC ATH and ATL will take us to a new level.
Get ready to open buy/sell positions in the months to come.
Bitcoin uptrend breakBitcoin uptrend break probably monday since nasdaq etc is at ath bitcoin follows and tops out in september

BTC/USD: Breakout Watch - short setup BTC/USD 15-min: Watching for a potential long opportunity. Price is pressing against a key descending trendline, with recent internal 'bos' and 'ChoCh' indicating a shift in momentum.
Plan:
* Entry: Targeting a retest around 107,509 after a confirmed trendline breakout.
* Target: 108,971
* Stop Loss: 106,885
Risk management is key! What are your thoughts?

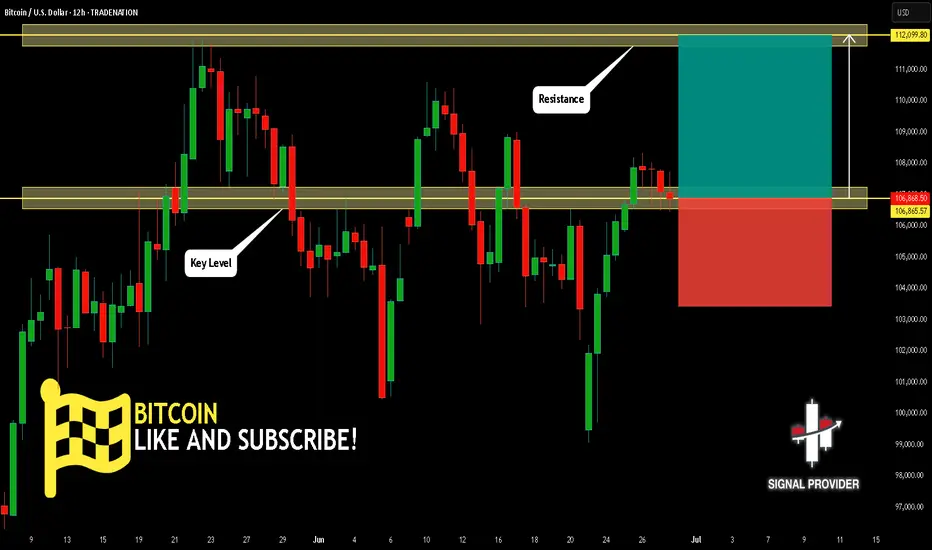
BITCOIN Is Bullish! Buy!
Here is our detailed technical review for BITCOIN.
Time Frame: 12h
Current Trend: Bullish
Sentiment: Oversold (based on 7-period RSI)
Forecast: Bullish
The market is approaching a significant support area 106,865.57.
The underlined horizontal cluster clearly indicates a highly probable bullish movement with target 112,099.80 level.
P.S
Overbought describes a period of time where there has been a significant and consistent upward move in price over a period of time without much pullback.
Disclosure: I am part of Trade Nation's Influencer program and receive a monthly fee for using their TradingView charts in my analysis.
Like and subscribe and comment my ideas if you enjoy them!